. 2017 Nov 15;7(1):15645.
doi: 10.1038/s41598-017-15154-6.

Blockade of CB1 cannabinoid receptor alters gut microbiota and attenuates inflammation and diet-induced obesity

Affiliations

Blockade of CB1 cannabinoid receptor alters gut microbiota and attenuates inflammation and diet-induced obesity

Pegah Mehrpouya-Bahrami et al. Sci Rep. .

Abstract

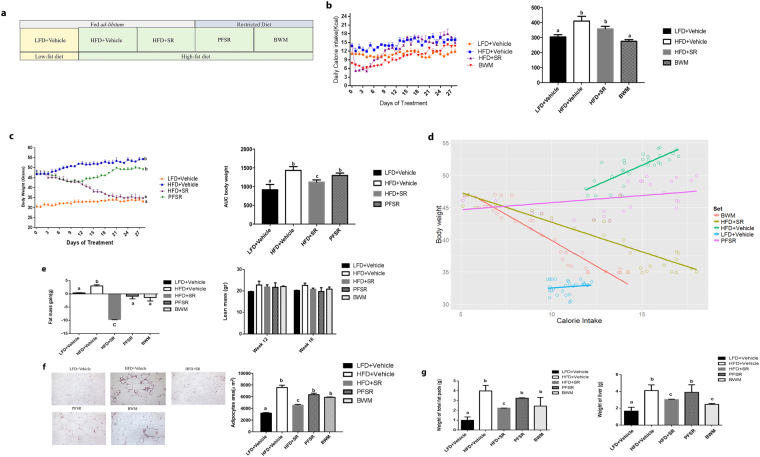
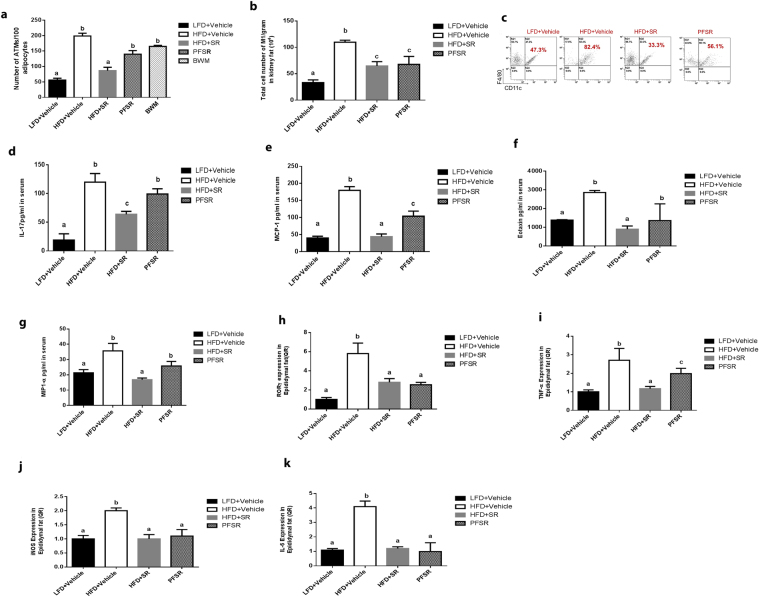
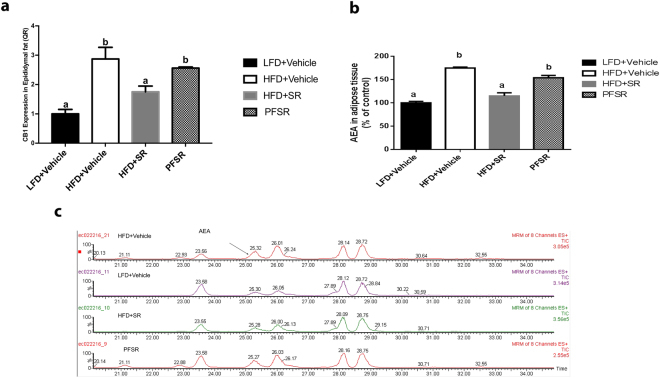
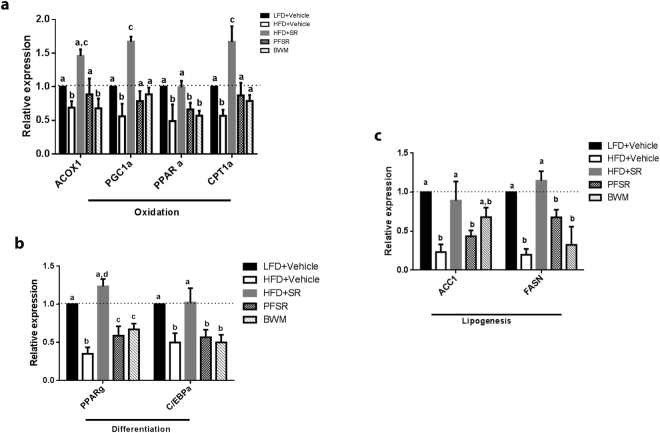
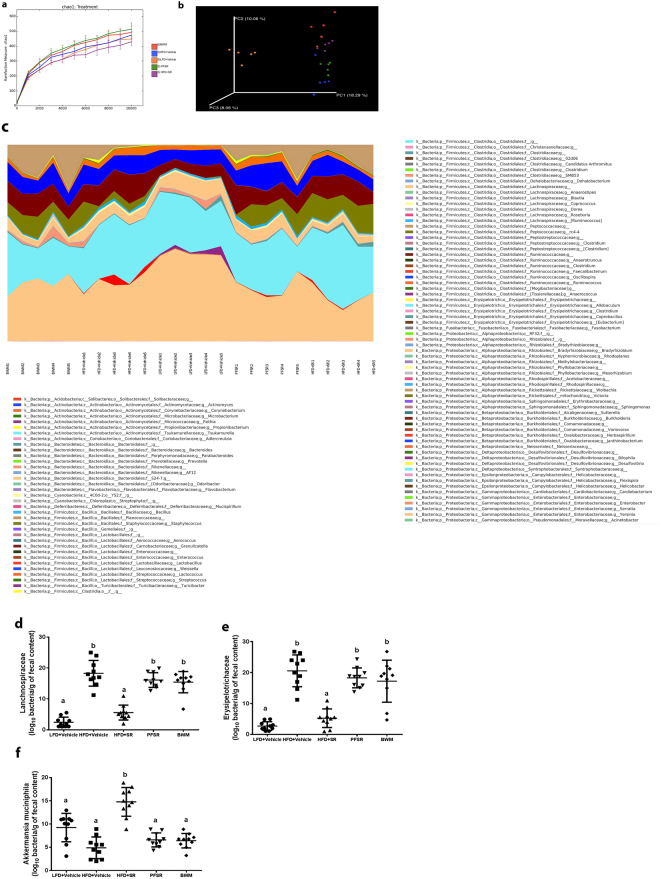
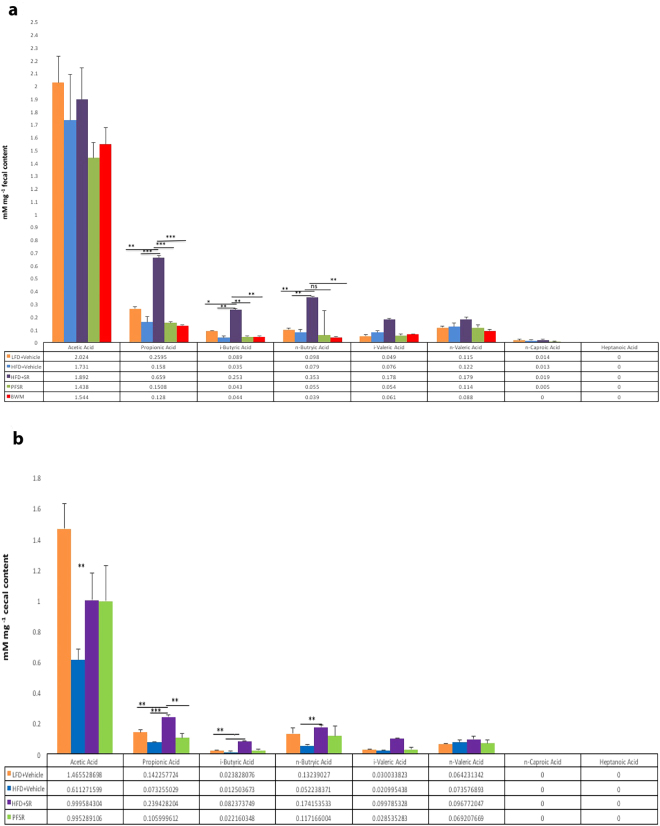
Obesity is characterized by chronic low-grade, systemic inflammation, altered gut microbiota, and gut barrier disruption. Additionally, obesity is associated with increased activity of endocannabinoid system (eCB). However, the clear connection between gut microbiota and the eCB system in the regulation of energy homeostasis and adipose tissue inflammation and metabolism, remains to be established. We investigated the effect of treatment of mice with a cannabinoid receptor 1 (CB1) antagonist on Diet-Induced Obesity (DIO), specifically whether such a treatment that blocks endocannabinoid activity can induce changes in gut microbiota and anti-inflammatory state in adipose tissue. Blockade of CB1 attenuated DIO, inflammatory cytokines and trafficking of M1 macrophages into adipose tissue. Decreased inflammatory tone was associated with a lower intestinal permeability and decreased metabolic endotoxemia as evidenced by reduced plasma LPS level, and improved hyperglycemia and insulin resistance. 16S rRNA metagenomics sequencing revealed that CB1 blockade dramatically increased relative abundance of Akkermansia muciniphila and decreased Lanchnospiraceae and Erysipelotrichaceae in the gut. Together, the current study suggests that blocking of CB1 ameliorates Diet-Induced Obesity and metabolic disorder by modulating macrophage inflammatory mediators, and that this effect is associated with alterations in gut microbiota and their metabolites.


Conflict of interest statement

The authors declare that they have no competing interests.

Figures

Figure 1
Figure 1
SR141716A causes transient reduction in diet intake and persistent weight loss when compared to vehicle-treated HFD fed control. (a) Diet-Induced Obesity (DIO) model was generated by feeding C57BL/6 J male mice with high-fat diet (HFD + Vehicle) whereas their lean, age-matched controls were fed low-fat diet (LFD + Vehicle). High Fat Diet-fed mice were treated with either SR141716A (10 mg/kg/day) (HFD + SR) or vehicle (0.1% Tween 80) (HFD + Vehicle) by daily oral gavage for 4 weeks starting at week 12. In order to assess the anti-inflammatory effect of SR141716A beyond its effect on calorie intake inhibition and weight loss in Diet-Induced Obesity (DIO) phenotype, pair-feeding was conducted in diet-intake matched controls (PFSR) and diet intake was adjusted in bodyweight-matched controls (BWM; n = 8–10 mice/group). (b) Daily energy intake during 4 week treatment with SR141716A in Diet-Induced Obesity (DIO) mice was recorded, Area Under the Curve (AUC) was calculated from the 5 replicated experiments. (c) Daily body weight of each group of mice is shown during the whole period of treatment; AUC was calculated from the 5 replicated experiments which were identical to the replicates in Fig. 1b. Area Under Curve (AUC) was calculated with Trapezoidal rule in R software. Generalized Estimating Equation (GEE) was performed to fit a repeated measurement logistic regression in SPSS. Data are shown as mean ± SD. Data with different superscript letters are significantly different (P < 0.05). (d) Pearson correlation between changes in body weight and caloric intake within different groups was assessed using R software. (e) Total fat mass gain and changes in lean mass was assessed at the baseline and after 4 weeks of treatment with Dual Energy X-ray absorptiometry (DEXA). Data are shown as mean ± SD. Data with different superscript letters are significantly different (P < 0.05). (f) The surface area of 100 adipocytes was determined and then averaged to represent mean adipocyte size for each mouse using ImageJ software (National Institutes of Health). Data are shown as mean ± SD. Data with different superscript letters are significantly different (P < 0.05) according to post hoc ANOVA one-way statistical analysis. (n = 10). (g) Weights of fat pads and livers were assessed at the end of the treatment.
Figure 2
Figure 2
SR141716A attenuates local and systemic inflammation in diet-induced obesity. Experiments Diet-Induced Obesity (DIO) were set up as described in Fig. 1 legend. (a) Adipose Tissue Macrophages (ATMs) were quantified per 100 adipocytes by Spot Studio v1.0 Analysis Software. (b,c) Kidney fat was isolated from 10 mice in each group. The ratio (b) and total cell number (c) of kidney fat F4/80 and CD11c+ cells was studied. (dg) Effect of SR141716A on plasma cytokine levels, (d) IL-17 levels (e) Monocyte chemoattractant protein-1(MCP-1) levels, (f) Eotaxin levels, and (g) Macrophage inflammatory protien-1α (MIP-1α) levels in plasma were quantified with multiplex immunoassays. (h,k) Effect of SR141716A treatment on the mRNA level of (h) RORγ, (i) TNF-𝛼, (j) iNOS, and (k) IL-6, in the epididymal adipose tissue was examined. Data shown as mean ± SD. Data with different superscript letters are significantly different (P < 0.05) according to post hoc ANOVA one-way statistical analysis. (n = 5 except LFD + Vehicle; n = 4).
Figure 3
Figure 3
SR141716A ameliorates metabolic dysfunction in diet-induced obesity. Experiments Diet-Induced Obesity (DIO)were set up as described in Fig. 1 legend. (a) Glucose tolerance test (GTT) and (b) Insulin tolerance test (ITT) of mice fed LFD + Vehicle (n = 10), HFD + Vehicle (n = 10), HFD + SR (n = 9) and Pair-fed to SR141716A (PFSR) (n = 10). Each animal received by oral gavage 1.5 g/kg body mass of glucose (25% D-glucose). Blood glucose levels were determined after 15, 30, 60 and 120 minutes. Insulin-tolerance tests were carried out on un-fasted animals by i.p injection of 1.5 U/kg body mass of insulin. Blood glucose levels were detected after 15, 30, 60 and 120 minutes. Generalized Linear Mixed Model (GLMM) was performed to calculate p values for the repeated measures in SPSS. Mean Area Under the Curve (AUC) from triplicate experiments measured between 0–120 minutes after glucose (GTT) and insulin (ITT) load. AUC was assessed with Trapezoidal rule in R software. Data with different superscript letters are significantly different. GTT (P < 0.01), ITT (P < 0.05).
Figure 4
Figure 4
SR141716A restores gut barrier function in diet-induced obesity. Experiments Diet-Induced Obesity (DIO) were set up as described in Fig. 1 legend. (a) Representative Periodic Acid Schiff images were used for in situ mucus layer staining, scale bar,100 μm. (b) Thickness of the mucus layer measured by histological image analysis software MetaMorph (LFD + Vehicle, n = 5; HFD + Vehicle, n = 5; SR, n = 6; PFSR, n = 5; and BWM, n = 6). (ce) mRNA expression analysis by qRT-PCR of mucus-related genes in the colonic mucosa. (f) Intestinal permeability was measured by quantitation of levels of serum FITC-Dextran (4 kDa) following oral gavage (n = 5 except LFD + Vehicle, n = 4). (g) Plasma lipopolysaccharide (LPS) level in Diet-Induced Obesity (DIO) mice treated with SR141716A for four weeks and controls was quantified (n = 5). (h) Myeloperoxidase (MPO) levels in colonic tissue were measured (n = 5). Data are shown as mean ± SD. Data with different superscript letters are significantly different (P < 0.05) according to post hoc ANOVA one-way statistical analysis.
Figure 5
Figure 5
SR141716A attenuates overactivity of endocannabinoid system in diet-induced obesity. Experiments Diet-Induced Obesity (DIO) were set up as described in Fig. 1 legend. (a) Adipose tissue CB1 mRNA levels in SR141716A-treated Diet-Induced Obesity (DIO) (HFD + SR), vehicle-treated Diet-Induced Obesity (DIO) (HFD + Vehicle), lean mice (LFD + Vehicle) and Pair-fed to SR141716A (PFSR) control mice was assessed by RT-PCR. (b) White adipose tissue AEA levels from the same mice (percent of control values) were measured with Liquid Chromatograph/Mass Spectrometry/Mass Spectrometry (LC/MS/MS) (n = 3). N-archidonoylethanolamine (AEA) levels (percent of LFD + Vehicle) were calculated in the epididymal adipose tissue of HFD + SR, HFD + Vehicle, and PFSR (n = 3). Data are shown as mean ± SD. Data with different superscript letters are significantly different (P < 0.05) according to post hoc ANOVA one-way statistical analysis.
Figure 6
Figure 6
SR141716A improves adipose tissue metabolism in diet-induced obesity. Experiments Diet-Induced Obesity (DIO) were set up as described in Fig. 1 legend. mRNA expression of markers of (a) lipid oxidation (CPT1; ACOX1; PGC-1α; and PPARα), (b) adipocyte differentiation (C/EBPα, PPARγ), and (c) lipogenesis (ACC1; FASN) was measured in epididymal fat depots (n = 5). Data are shown as mean ± SD. Data with different superscript letters are significantly different (P < 0.05) according to post hoc ANOVA one-way statistical analysis.
Figure 7
Figure 7
SR141716A alters gut microbiota in diet-induced obesity. Experiments Diet-Induced Obesity (DIO) were set up as described in Fig. 1 legend. Metagenomic analysis was performed on 16S rRNA V3 + V4region data, rarefied to a depth of 10,000 reads per sample. (a) Species richness metric based on Chao1 method was calculated. (b) Beta-diversity of the gut microbiome was evaluated by weighted UniFrac-based principal co-ordinate algorithim. The analysis was performed using the abundance matrix of genus-level Operational Taxonomical Units (OTUs) in different samples, and pairwise community distances were determined with 0.97 similarity using the weighted UniFrac algorithm. (c) Relative taxa abundance area plots for individuals from the five populations, summarized at the genus level. Individuals are represented along the horizontal axis, and relative taxa frequency is denoted by the vertical axis. (d) Lanchnospiraceae (e) Erysipelotrichaceae and (f) A. muciniphila abundance (log10 of bacteria per g of fecal content) was measured in mice (n = 10). Values with different superscript letters are significantly different, (P < 0.01) according to post hoc ANOVA one-way statistical analysis.
Figure 8
Figure 8
SR141716A treatment changes gut microbiome and its short chain fatty acids (SCFAs) metabolites Experiments Diet-Induced Obesity (DIO) were set up as described in Fig. 1 legend. (a,b) Gas chromatography with Flame Ionization Detector (GC-FID) quantification of short chain fatty acid (SCFA) levels in the cecal and fecal contents. Representative data are from triplicate experiments. Vertical bars represent mean ± SD. ANOVA/Tukey *p < 0.05; **p < 0.01; ***p < 0.001.

References

    1. Turnbaugh PJ, et al. An obesity-associated gut microbiome with increased capacity for energy harvest. Nature. 2006;444:1027–1031. doi: 10.1038/nature05414. - DOI - PubMed
    1. Turnbaugh PJ, Backhed F, Fulton L, Gordon JI. Diet-induced obesity is linked to marked but reversible alterations in the mouse distal gut microbiome. Cell host & microbe. 2008;3:213–223. doi: 10.1016/j.chom.2008.02.015. - DOI - PMC - PubMed
    1. Vijay-Kumar M, et al. Metabolic syndrome and altered gut microbiota in mice lacking Toll-like receptor 5. Science. 2010;328:228–231. doi: 10.1126/science.1179721. - DOI - PMC - PubMed
    1. Gill SR, et al. Metagenomic analysis of the human distal gut microbiome. Science. 2006;312:1355–1359. doi: 10.1126/science.1124234. - DOI - PMC - PubMed
    1. Koren O, et al. Host remodeling of the gut microbiome and metabolic changes during pregnancy. Cell. 2012;150:470–480. doi: 10.1016/j.cell.2012.07.008. - DOI - PMC - PubMed

Publication types

MeSH terms