. 2017 Nov 15;7(1):15655.
doi: 10.1038/s41598-017-15546-8.

Hypercholesterolemia Enhances T Cell Receptor Signaling and Increases the Regulatory T Cell Population

Affiliations

Hypercholesterolemia Enhances T Cell Receptor Signaling and Increases the Regulatory T Cell Population

Reiner K W Mailer et al. Sci Rep. .

Abstract

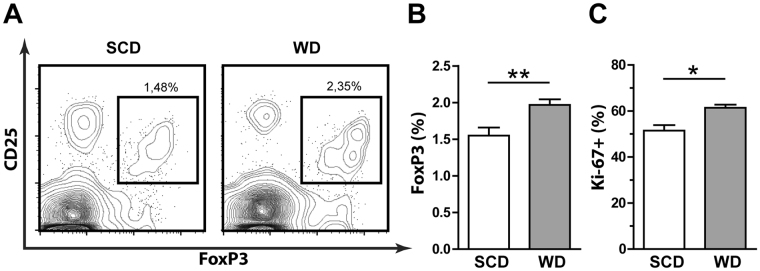
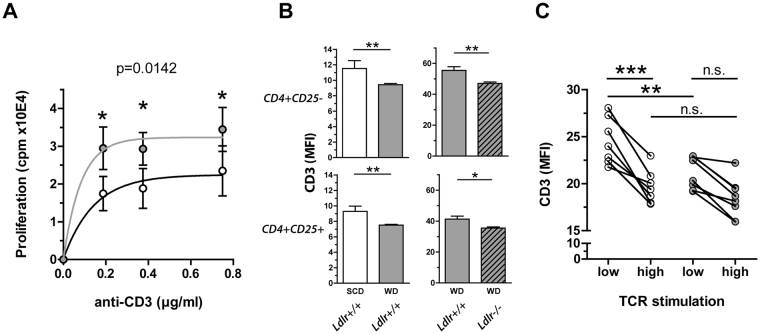
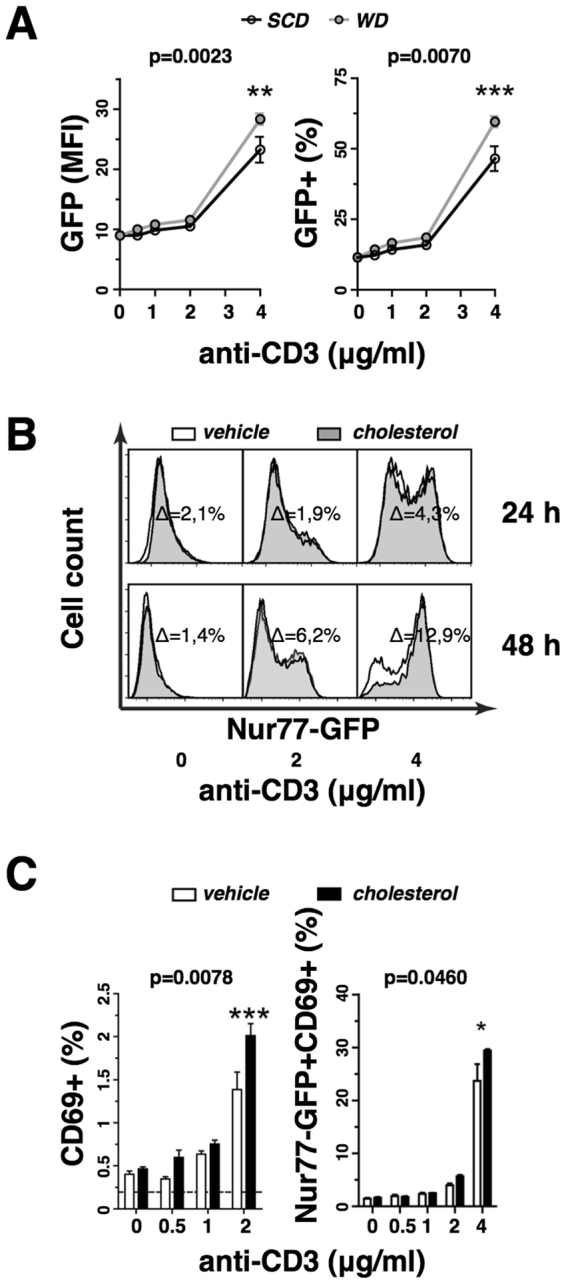
Hypercholesterolemia promotes the inflammation against lipoproteins in atherosclerosis. Development of atherosclerosis is affected by the balance between pro-inflammatory effector T cells and anti-inflammatory regulatory T (Treg) cells. However, phenotype and function of T cell subpopulations in hypercholesterolemia remain to be investigated. Here, we found that cholesterol-containing diet increased the expression of the Treg cell lineage-defining transcription factor FoxP3 among thymocytes and splenocytes. Hypercholesterolemia elevated the FoxP3 expression level and population size of peripheral Treg cells, but did not prevent enhanced proliferation of stimulated T cells. Moreover, cholesterol supplementation in diet as well as in cell culture medium promoted T cell antigen receptor (TCR) signaling in CD4+ T cells. Our results demonstrate that hypercholesterolemia enhances TCR stimulation, Treg cell development as well as T cell proliferation. Thus, our findings may help to understand why hypercholesterolemia correlates with altered CD4+ T cell responses.


Conflict of interest statement

The authors declare that they have no competing interests.

Figures

Figure 1
Figure 1
Dietary-induced hypercholesterolemia increases cellular FoxP3 expression levels and Treg cell populations in spleen and mesenteric lymph nodes. FoxP3 expression in mice fed cholesterol-free standard chow diet (SCD) or 0.15% cholesterol-containing Western diet (WD) for 4 weeks. (A) Representative contour plots of live CD4+ T cells (SCD black lines; WD red lines) as well as histograms (SCD in white; WD in gray) and bar graphs of live CD4+ CD25+ T cells from spleen (upper panel) and mesenteric lymph nodes (mLN) (lower panel) derived from SCD (n = 4) or WD (n = 5) fed mice. (B) FoxP3+ Treg cell populations among live CD4+ T cells as in (A). Data for spleen (n = 21) and mLN (n = 10) from six and four independent experiments are shown, respectively. (C) Representative contour plots (SCD black lines; WD red lines) as well as histograms and bar graphs (SCD in white; WD in gray) of FoxP3 reporter mice (DEREG) gated on live CD4+ T cells (upper panel) or live CD4+ GFP+ Treg cells (lower panel) derived from spleens of SCD (n = 5) or WD (n = 3) fed mice. One representative experiment out of three is shown. (D) FoxP3 immunoblots among splenocytes (upper panel) and mesenteric lymph nodes (mLN) (lower panel) and quantification of relative band intensities of SCD or WD fed mice. All data are expressed as mean ± SEM; two-tailed Mann Whitney U test was performed for statistical analysis; *p < 0.05; **p < 0.01.
Figure 2
Figure 2
The population of functional Treg cells correlates with hypercholesterolemia. (A) Splenic FoxP3+ Treg cell populations among live CD4+ T cells following 4 weeks of cholesterol-free (white) standard chow diet (SCD), 0.15% (gray) or 1.125% (black) cholesterol-containing Western diet (WD) in wild type mice. One-way ANOVA with Bonferroni’s multiple comparison post hoc test was performed for statistical analysis. (B) Splenic FoxP3+ Treg cell populations as in (A) against plasma cholesterol concentrations; r = Spearman’s rank correlation coefficient. (C) Splenic FoxP3+ Treg cell populations among live CD4+ T cells in wild type (Ldlr +/+, circles) and LDL receptor knockout (Ldlr−/−, triangles) mice fed SCD (white) or 0.15% cholesterol-containing WD (gray) for 4 weeks. One-way ANOVA with Bonferroni’s multiple comparison post hoc test was performed for statistical analysis. (D) Splenic FoxP3+ Treg cell populations among live CD4+ T cells in Ldlr−/− mice fed SCD or WD for 12 and 24 weeks, respectively. One-way ANOVA with Bonferroni’s multiple comparison post hoc test was performed for statistical analysis. (E) Suppression of CD4+ responder T cell proliferation by CD4+ CD25+ suppressor T cells isolated from mice treated as in (A); CFSE-labeled responder T cells and irradiated APCs are derived from SCD fed mice; maximum suppression was set to 100%. Representative data from one out of two experiments with three technical replicates per condition are shown. Two-way ANOVA with Bonferroni’s multiple comparison post hoc test was performed for statistical analysis, displayed p-value indicates the significant effect of the diet on the suppressive capacity. (The p-value for the effect of the dilution of suppressor cells is not shown). All values are expressed as mean ± SEM; color and shape of data points indicate treatment and genotype of mice, as described in the legend; *p < 0.05; ***p < 0.001.
Figure 3
Figure 3
Hypercholesterolemia increases population size and proliferation of FoxP3+ T cells in the thymus. Flow cytometry analysis of the thymus following 4 weeks of cholesterol-free standard chow diet (SCD) or 0.15% cholesterol-containing Western diet (WD). (A) Representative contour plots of live CD4+ thymocytes from SCD or WD treated mice and percentages of the CD4+ CD25+ FoxP3+ population are shown. Percentage of (B) CD4+ CD25+ FoxP3+ among CD4+ thymocytes in SCD (white, n = 6) or WD (gray, n = 7) fed mice and (C) Ki-67+ among CD4+ CD25+ FoxP3+ thymocytes in SCD (white, n = 3) or WD (gray, n = 4) fed mice. Values are expressed as mean ± SEM; ; two-tailed Mann Whitney U test was performed for statistical analysis; *p < 0.05, **p < 0.01.
Figure 4
Figure 4
Enhanced proliferation and TCR internalization of CD4+ T cells in hypercholesterolemia. (A) Proliferation of splenocytes derived from 4 weeks cholesterol-free standard chow diet (SCD, white) or 0.15% cholesterol-containing Western diet (WD, gray) fed mice stimulated with different anti-CD3 concentrations; pooled data from three independent experiments with four technical replicates for each data point are shown (n = 9). Values are expressed as mean ± SEM; two-way ANOVA with Bonferroni’s multiple comparison post hoc test was performed for statistical analysis; displayed p-value indicates the significant effect of the diet on T cell proliferation. (The p-value for the effect of the antibody dilution is not shown). (B) CD3 internalization in splenic CD4+ CD25− (upper panel) or CD4+ CD25+ (lower panel) T cells derived from wild type mice (Ldlr+/+) fed SCD (white) or WD (gray) for 4 weeks, assessed by anti-CD3 surface stainings utilizing Pacific Blue-conjugated antibody (n = 8) (left panel) or derived from Ldlr+/+ (plain) and LDL receptor knockout (Ldlr−/−) mice (hatched) fed WD for 4 weeks, assessed by anti-CD3 surface stainings utilizing phycoerythrin-conjugated antibody (n = 6) (right panel). Values are expressed as mean ± SEM; two-tailed Mann Whitney U test was performed for statistical analysis. (C) CD3 surface expression levels of naïve CD4+ T cells derived from 4 weeks SCD (white) or WD (gray) fed wild type mice following 24 h TCR stimulation with 0.5 μg/ml (low) and 1.5 μg/ml (high) soluble anti-CD3 antibody, assessed by anti-CD3 surface stainings utilizing peridinin chlorophyll-conjugated antibody. Pooled data from 2 independent experiments are shown. Repeated measures ANOVA with Bonferroni’s post-hoc test was performed for statistical analysis; *p < 0.05, **p < 0.01, ***p < 0.001.
Figure 5
Figure 5
Cholesterol supplementation enhances T cell receptor signaling. (A) GFP expression level (left panel) and GFP+ population size (right panel) of isolated naïve CD4+ T cells derived from the spleens of 4 weeks cholesterol-free standard chow diet (SCD, white) or 0.15% cholesterol-containing Western diet (WD, gray) fed Nur77GFP mice in response to 24 h polyclonal stimulation with soluble anti-CD3 antibody concentrations in vitro (n = 4). (B) GFP induction in isolated naïve CD4+ T cells derived from the spleens of Nur77GFP mice following polyclonal stimulation with soluble anti-CD3 antibody concentrations in the presence of vehicle (white) or solubilized cholesterol (black shaded) for 24 and 48 h. The cholesterol-mediated gain of GFP+ T cell populations is shown. (C) Induction of CD69 expression in vehicle (white) or solubilized cholesterol (black) treated naïve CD4+ T cells isolated from the spleens of wild type mice following polyclonal stimulation with soluble anti-CD3 antibody concentrations (left panel) (n = 4) or Nur77GFP mice following polyclonal stimulation with plate-bound anti-CD3 antibody concentrations (right panel) (n = 3). All values are expressed as mean ± SEM; two-way ANOVA with Bonferroni’s multiple comparison post hoc test was performed for statistical analysis; displayed p-values indicate the significant effect of the cholesterol supplementation on T cell activation marker expression. (The p-value for the effect of the antibody dilution is not shown); *p < 0.05, **p < 0.01, ***p < 0.001.

Similar articles

Cited by

References

    1. Spitz C, et al. Regulatory T cells in atherosclerosis: critical immune regulatory function and therapeutic potential. Cell. Mol. Life Sci. 2016;73:901–22. doi: 10.1007/s00018-015-2080-2. - DOI - PMC - PubMed
    1. Ait-Oufella H, et al. Natural regulatory T cells control the development of atherosclerosis in mice. Nat. Med. 2006;12:178–80. doi: 10.1038/nm1343. - DOI - PubMed
    1. Klingenberg R, et al. Depletion of FOXP3(+) regulatory T cells promotes hypercholesterolemia and atherosclerosis. J. Clin. Invest. 2013;123:1323–34. doi: 10.1172/JCI63891. - DOI - PMC - PubMed
    1. Maganto-Garcia E, Tarrio ML, Grabie N, Bu DX, Lichtman AH. Dynamic Changes in Regulatory T Cells Are Linked to Levels of Diet-Induced Hypercholesterolemia. Circulation. 2011;124:185–U0. doi: 10.1161/CIRCULATIONAHA.110.006411. - DOI - PMC - PubMed
    1. Butcher MJ, et al. Atherosclerosis-Driven Treg Plasticity Results in Formation of a Dysfunctional Subset of Plastic IFN gamma(+) Th1/Tregs. Circ. Res. 2016;119:1190–03. doi: 10.1161/CIRCRESAHA.116.309764. - DOI - PMC - PubMed

MeSH terms