

Bilateral 5 Hz transcranial alternating current stimulation on fronto-temporal areas modulates resting-state EEG
- PMID: 29142322
- PMCID: PMC5688177
- DOI: 10.1038/s41598-017-16003-2
Bilateral 5 Hz transcranial alternating current stimulation on fronto-temporal areas modulates resting-state EEG
Abstract
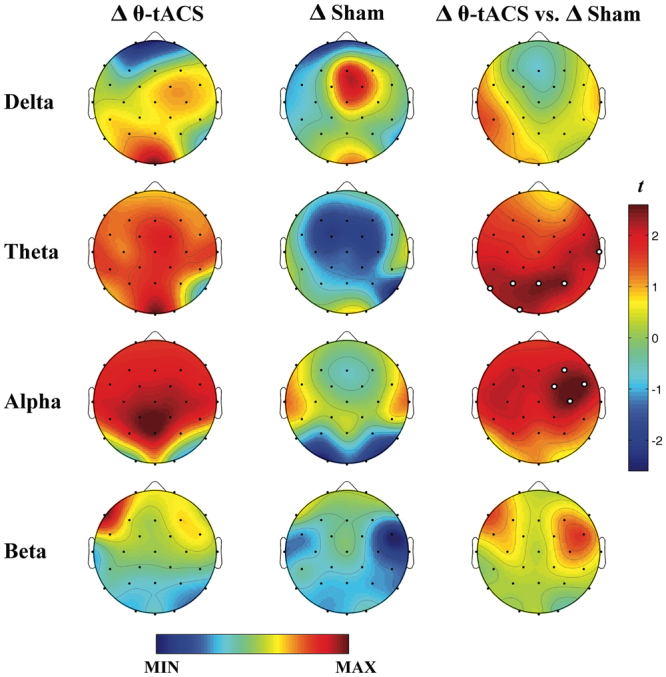
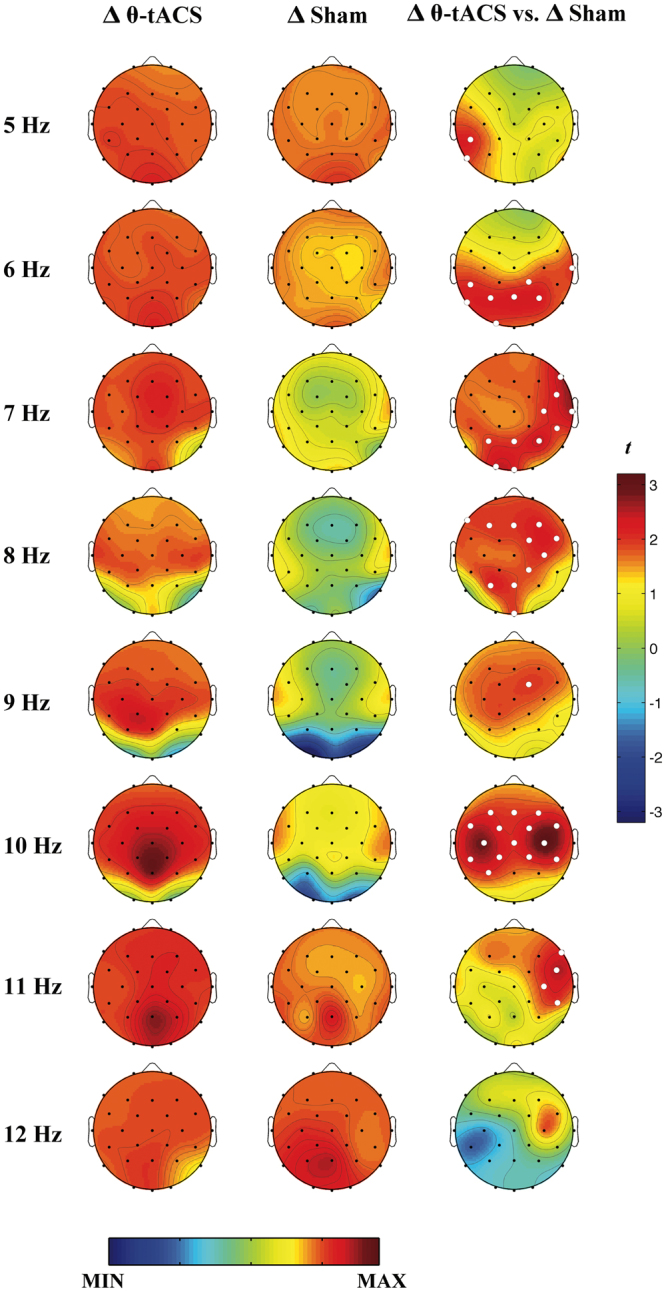
Rhythmic non-invasive brain stimulations are promising tools to modulate brain activity by entraining neural oscillations in specific cortical networks. The aim of the study was to assess the possibility to influence the neural circuits of the wake-sleep transition in awake subjects via a bilateral transcranial alternating current stimulation at 5 Hz (θ-tACS) on fronto-temporal areas. 25 healthy volunteers participated in two within-subject sessions (θ-tACS and sham), one week apart and in counterbalanced order. We assessed the stimulation effects on cortical EEG activity (28 derivations) and self-reported sleepiness (Karolinska Sleepiness Scale). θ-tACS induced significant increases of the theta activity in temporo-parieto-occipital areas and centro-frontal increases in the alpha activity compared to sham but failed to induce any online effect on sleepiness. Since the total energy delivered in the sham condition was much less than in the active θ-tACS, the current data are unable to isolate the specific effect of entrained theta oscillatory activity per se on sleepiness scores. On this basis, we concluded that θ-tACS modulated theta and alpha EEG activity with a topography consistent with high sleep pressure conditions. However, no causal relation can be traced on the basis of the current results between these rhythms and changes on sleepiness.
Conflict of interest statement
The authors declare that they have no competing interests.
Figures


Similar articles
-
Bilateral Theta Transcranial Alternating Current Stimulation (tACS) Modulates EEG Activity: When tACS Works Awake It Also Works Asleep.Nat Sci Sleep. 2019 Nov 19;11:343-356. doi: 10.2147/NSS.S229925. eCollection 2019. Nat Sci Sleep. 2019. PMID: 31819688 Free PMC article.
-
Personalized Theta Transcranial Alternating Current Stimulation and Gamma Transcranial Alternating Current Stimulation Bring Differential Neuromodulatory Effects on the Resting Electroencephalogram: Characterizing the Temporal, Spatial, and Spectral Dimensions of Transcranial Alternating Current Stimulation.Neuromodulation. 2025 Apr;28(3):425-433. doi: 10.1016/j.neurom.2024.08.008. Epub 2024 Oct 18. Neuromodulation. 2025. PMID: 39425734 Clinical Trial.
-
No aftereffect of transcranial alternating current stimulation (tACS) on theta activity during an inter-sensory selective attention task.Int J Psychophysiol. 2025 Apr;210:112539. doi: 10.1016/j.ijpsycho.2025.112539. Epub 2025 Feb 24. Int J Psychophysiol. 2025. PMID: 40010408
-
Probing the Link Between Perception and Oscillations: Lessons from Transcranial Alternating Current Stimulation.Neuroscientist. 2020 Feb;26(1):57-73. doi: 10.1177/1073858419828646. Epub 2019 Feb 7. Neuroscientist. 2020. PMID: 30730265 Free PMC article. Review.
-
EEG oscillations: From correlation to causality.Int J Psychophysiol. 2016 May;103:12-21. doi: 10.1016/j.ijpsycho.2015.02.003. Epub 2015 Feb 4. Int J Psychophysiol. 2016. PMID: 25659527 Review.
Cited by
-
The Efficacy of Transcranial Current Stimulation Techniques to Modulate Resting-State EEG, to Affect Vigilance and to Promote Sleepiness.Brain Sci. 2018 Jul 20;8(7):137. doi: 10.3390/brainsci8070137. Brain Sci. 2018. PMID: 30037023 Free PMC article. Review.
-
Bilateral Theta Transcranial Alternating Current Stimulation (tACS) Modulates EEG Activity: When tACS Works Awake It Also Works Asleep.Nat Sci Sleep. 2019 Nov 19;11:343-356. doi: 10.2147/NSS.S229925. eCollection 2019. Nat Sci Sleep. 2019. PMID: 31819688 Free PMC article.
-
Dataset of concurrent EEG, ECG, and behavior with multiple doses of transcranial electrical stimulation.Sci Data. 2021 Oct 27;8(1):274. doi: 10.1038/s41597-021-01046-y. Sci Data. 2021. PMID: 34707095 Free PMC article.
-
Neuroplastic effects of transcranial alternating current stimulation (tACS): from mechanisms to clinical trials.Front Hum Neurosci. 2025 Mar 12;19:1548478. doi: 10.3389/fnhum.2025.1548478. eCollection 2025. Front Hum Neurosci. 2025. PMID: 40144589 Free PMC article. Review.
-
Theta transcranial alternating current stimulation over the prefrontal cortex enhances theta power and working memory performance.Front Psychiatry. 2025 Jan 14;15:1493675. doi: 10.3389/fpsyt.2024.1493675. eCollection 2024. Front Psychiatry. 2025. PMID: 39876999 Free PMC article.
References
-
- Krone, L. et al. Top-down control of arousal and sleep: Fundamentals and clinical implications. Sleep Med. Rev. 10.1016/j.smrv.2015.12.005 (2016). - PubMed
MeSH terms
LinkOut - more resources
Full Text Sources
Other Literature Sources
