. 2015 Aug 1;6(8):4772-4777.
doi: 10.1039/c5sc01647a. Epub 2015 May 27.

A novel 18F-labelled high affinity agent for PET imaging of the translocator protein

Affiliations

A novel 18F-labelled high affinity agent for PET imaging of the translocator protein

Adele Blair et al. Chem Sci. .

Abstract

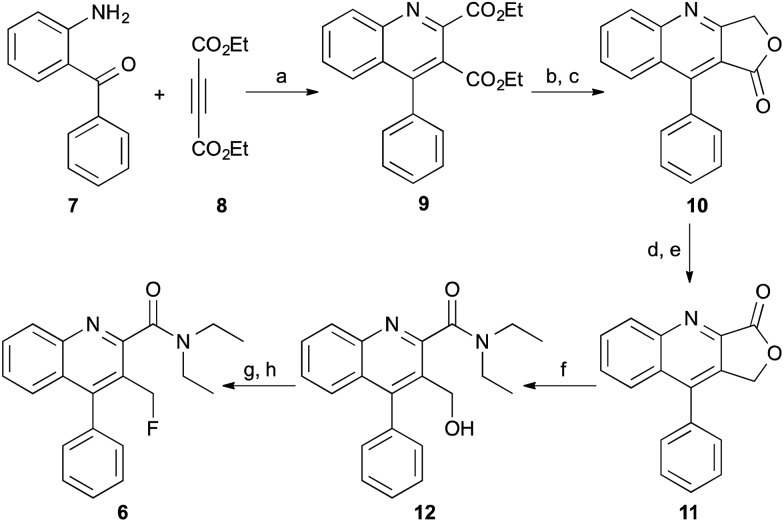
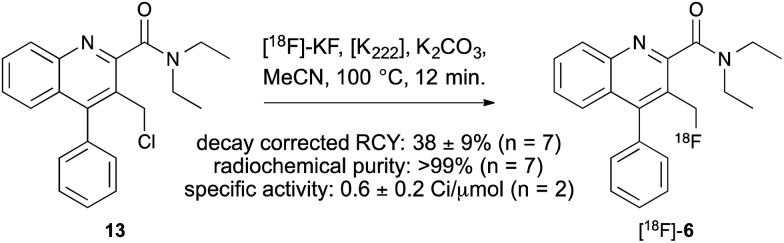
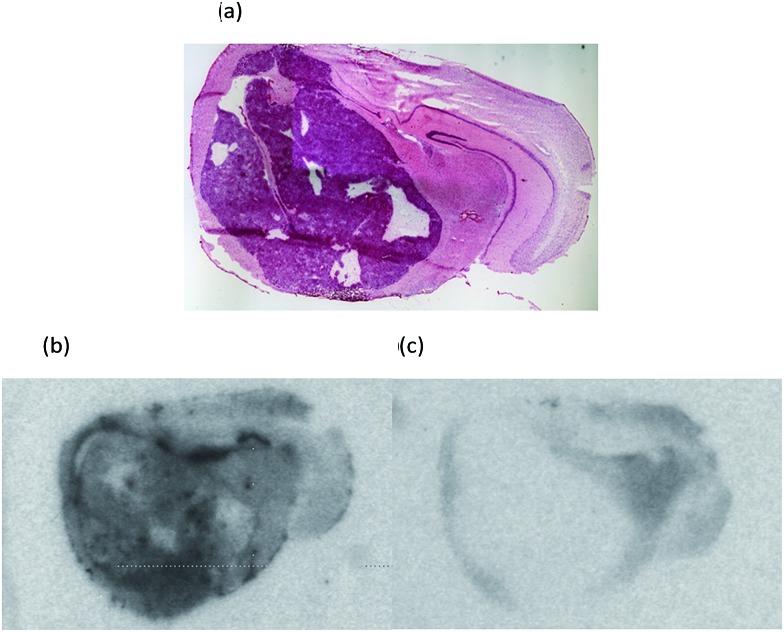
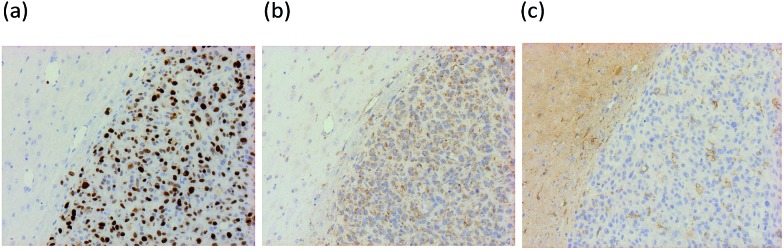
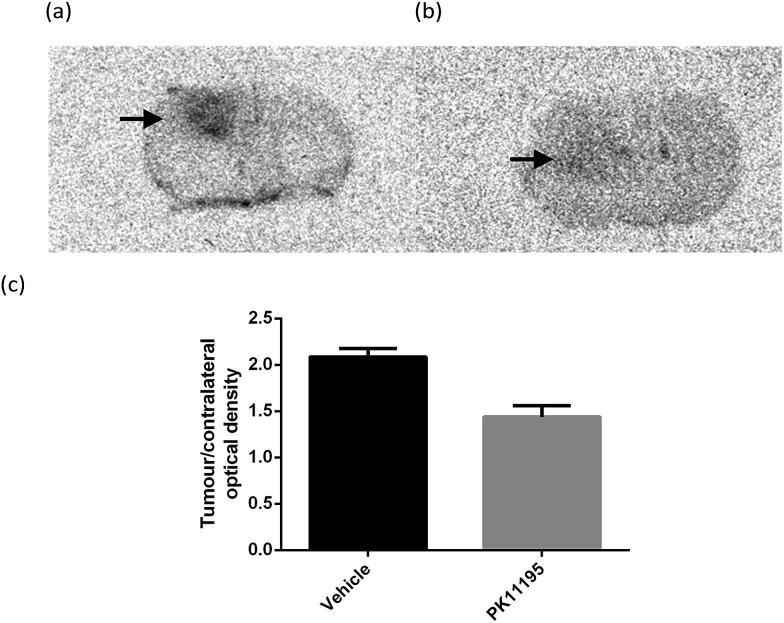
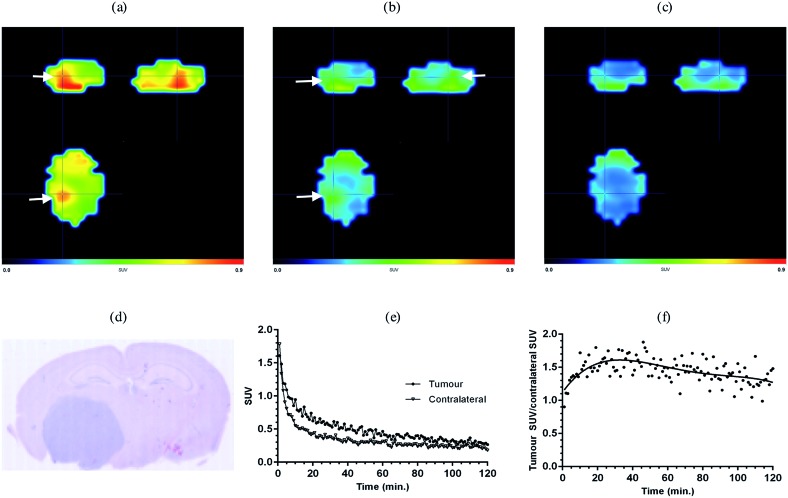
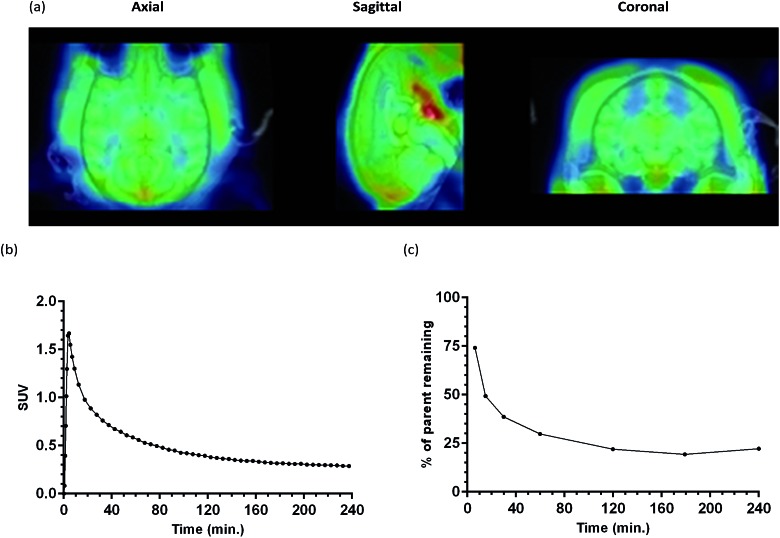
The translocator protein (TSPO) is an important target for imaging focal neuroinflammation in diseases such as brain cancer, stroke and neurodegeneration, but current tracers for non-invasive imaging of TSPO have important limitations. We present the synthesis and evaluation of a novel 3-fluoromethylquinoline-2-carboxamide, AB5186, which was prepared in eight steps using a one-pot two component indium(iii)-catalysed reaction for the rapid and efficient assembly of the 4-phenylquinoline core. Biological assessment and the implementation of a physicochemical study showed AB5186 to have low nanomolar affinity for TSPO, as well as optimal plasma protein binding and membrane permeability properties. Generation of [18F]-AB5186 through 18F incorporation was achieved in good radiochemical yield and subsequent in vitro and ex vivo autoradiography revealed the ability of this compound to bind with specificity to TSPO in mouse glioblastoma xenografts. Initial positron emission tomography imaging of a glioma bearing mouse and a healthy baboon support the potential for [18F]-AB5186 use as a radiotracer for non-invasive TSPO imaging in vivo.


Figures

Fig. 1
Fig. 1. Imaging agents for TSPO; [11C]-PK11195 (1), [18F]-DPA714 (2) and [18F]-FEDAA1106 (3).
Fig. 2
Fig. 2. Quinoline-2-carboxamides 4, 5 and 6.
Scheme 1
Scheme 1. Synthesis of AB5186 6. Reagents and conditions: (a) InCl3, 80 °C, 3 h, 100%; (b) NaBH4, THF, MeOH, Δ, 15 h, 93%; (c) MnO2, CHCl3, rt, 4 h, 83%; (d) (i) LiAlH4, THF, 0 °C, 3 h; (ii) 10% Pd/C, MeOH, rt, 15 h, 77%; (e) MnO2, CHCl3, rt, 4 h, 92%; (f) Et2NH, Me3Al, CH2Cl2, Δ, 15 h, 61%; (g) SOCl2, CH2Cl2, Δ, 24 h, 100%; (h) KF, 18-crown-6, MeCN, Δ, 24 h, 60%.
Scheme 2
Scheme 2. Radiosynthesis of [18F]-AB5186 6.
Fig. 3
Fig. 3. (a) H&E stained section of a CD1 nude mouse brain bearing an orthotopic G7 human glioblastoma xenograft which stains dark purple and distorts the normal brain. Representative autoradiograms showing (b) total binding of [18F]-AB5186 6, and (c) non-specific binding in the presence of unlabelled PK11195 1.
Fig. 4
Fig. 4. Representative immunohistochemistry images of a CD1 nude mouse brain bearing an orthotopic U87MG-luc2 glioma xenograft stained for: (a) Ki67 (cell proliferation marker), (b) TSPO, and (c) microglia (Iba1). Brown staining signifies presence of marker.
Fig. 5
Fig. 5. Representative coronal brain autoradiograms obtained after injecting intracranial U87MG-Luc2 glioma bearing mice with (a) vehicle or (b) 1 mg kg–1 PK11195 followed by [18F]-AB5186 10 min later. Brains were harvested for sectioning 20 min after tracer injection. Black arrows indicate tumour hotspots. (c) Ratios of tumour to contralateral tissue optical densities in the vehicle (n = 4) and PK11195 (n = 4) pre-treatment cohorts (P = 0.0002). Error bars represent the standard error of mean.
Fig. 6
Fig. 6. Averaged PET images of a U87MG-Luc2 glioma bearing mouse brain following [18F]-AB5186 injection: (a) 0–40 min averaged, (b) 41–80 min averaged, and (c) 81–120 min averaged; 120 min dynamic scan. White arrows indicate tumour hotspots. The brain was defined using the skull following manual co-registration of the CT image with the PET image. (d) H&E staining showing location of the tumour which stains dark blue. (e) Time–activity curves of the tracer in the tumour and contralateral brain regions obtained from manually defined VOIs. (f) Tracer kinetics expressed as a ratio of the tumour to contralateral SUVs.
Fig. 7
Fig. 7. (a) MRI and averaged PET image (0–60 min; 240 min dynamic scan) of healthy baboon brain following [18F]-AB5186 6 injection. (b) Whole brain time activity curve for the tracer in the baboon brain. (c) Parent fraction profile of [18F]-AB5186 6 over time following bolus injection into baboon.

Similar articles

Cited by

References

    1. Pimlott S. L., Sutherland A. Chem. Soc. Rev. 2011;40:149–162. - PubMed
    1. Ametamey S. M., Honer M., Schubiger P. A. Chem. Rev. 2008;108:1501–1516. - PubMed
    1. Cai L., Lu S., Pike V. W. Eur. J. Org. Chem. 2008:2853–2873.
    1. Miller P. W., Long N. J., Vilar R., Gee A. D. Angew. Chem., Int. Ed. 2008;47:8998–9033. - PubMed
    1. Scott P. J. Angew. Chem., Int. Ed. 2009;48:6001–6004. - PubMed