

Investigation of useful carbon tracers for 13C-metabolic flux analysis of Escherichia coli by considering five experimentally determined flux distributions
- PMID: 29142823
- PMCID: PMC5678827
- DOI: 10.1016/j.meteno.2016.06.001
Investigation of useful carbon tracers for 13C-metabolic flux analysis of Escherichia coli by considering five experimentally determined flux distributions
Abstract
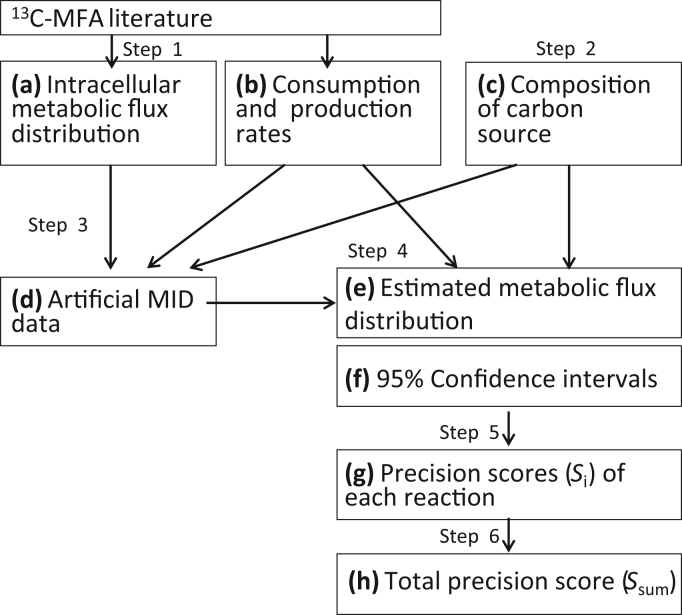
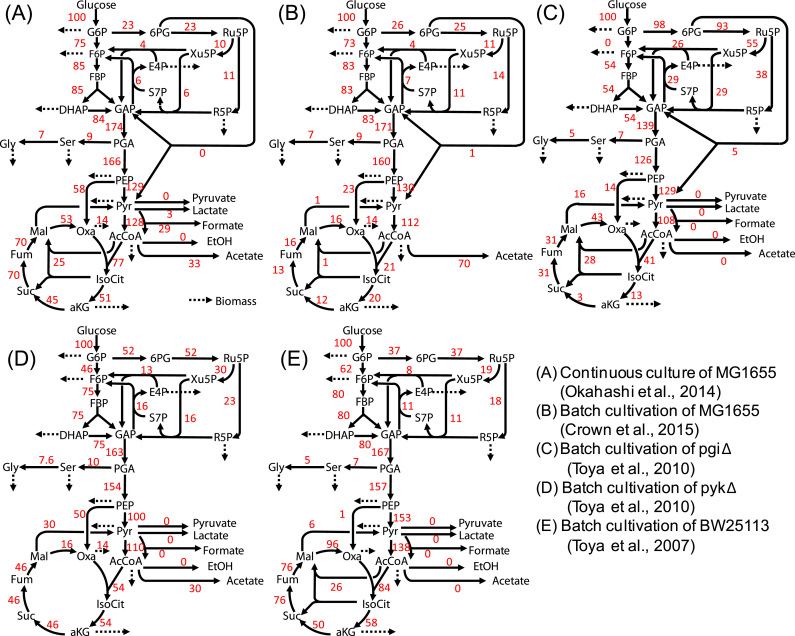
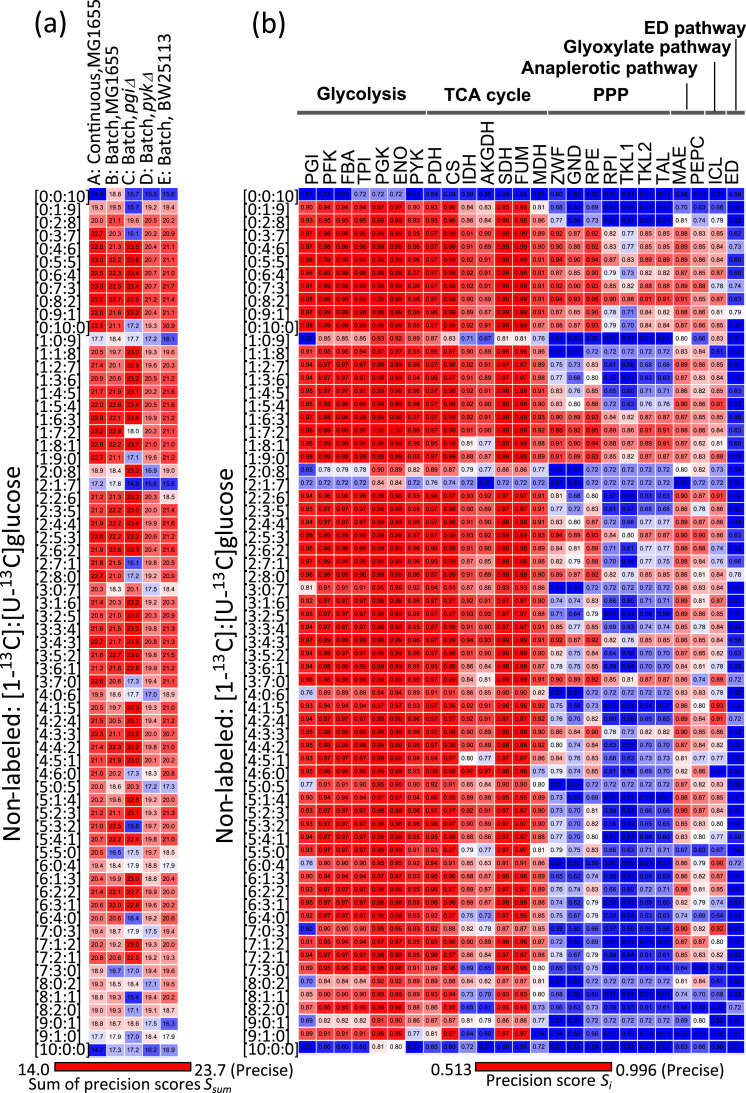
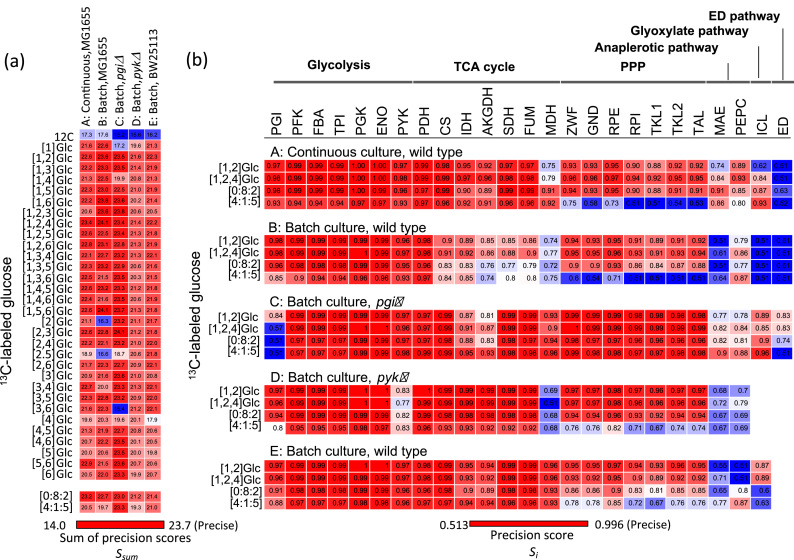
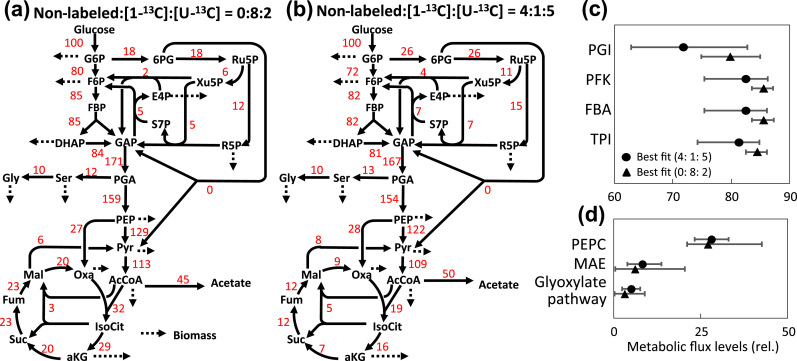
The 13C-MFA experiments require an optimal design since the precision or confidence intervals of the estimated flux levels depends on factors such as the composition of 13C-labeled carbon sources, as well as the metabolic flux distribution of interest. In this study, useful compositions of 13C-labeled glucose for 13C-metabolic flux analysis (13C-MFA) of Escherichia coli are investigated using a computer simulation of the stable isotope labeling experiment. Following the generation of artificial mass spectra datasets of amino acid fragments using five literature-reported flux distributions of E. coli, the best fitted flux distribution and the 95% confidence interval were estimated by the 13C-MFA procedure. A comparison of the precision scores showed that [1, 2-13C]glucose and a mixture of [1-13C] and [U-13C]glucose at 8:2 are one of the best carbon sources for a precise estimation of flux levels of the pentose phosphate pathway, glycolysis and the TCA cycle. Although the precision scores of the anaplerotic and glyoxylate pathway reactions were affected by both the carbon source and flux distribution, it was also shown that the mixture of non-labeled, [1-13C], and [U-13C]glucose at 4:1:5 was specifically effective for the flux estimation of the glyoxylate pathway reaction. These findings were confirmed by wet 13C-MFA experiments.
Keywords: 13C-labeling experiment; 13C-metabolic flux analysis; Computer simulation; Design of experiment; Escherichia coli.
Figures
Similar articles
-
Integrated 13C-metabolic flux analysis of 14 parallel labeling experiments in Escherichia coli.Metab Eng. 2015 Mar;28:151-158. doi: 10.1016/j.ymben.2015.01.001. Epub 2015 Jan 14. Metab Eng. 2015. PMID: 25596508 Free PMC article.
-
Optimal tracers for parallel labeling experiments and 13C metabolic flux analysis: A new precision and synergy scoring system.Metab Eng. 2016 Nov;38:10-18. doi: 10.1016/j.ymben.2016.06.001. Epub 2016 Jun 4. Metab Eng. 2016. PMID: 27267409 Free PMC article.
-
Optimal 13C-labeling of glycerol carbon source for precise flux estimation in Escherichia coli.J Biosci Bioeng. 2018 Mar;125(3):301-305. doi: 10.1016/j.jbiosc.2017.09.009. Epub 2017 Nov 6. J Biosci Bioeng. 2018. PMID: 29107627
-
13C metabolic flux analysis: optimal design of isotopic labeling experiments.Curr Opin Biotechnol. 2013 Dec;24(6):1116-21. doi: 10.1016/j.copbio.2013.02.003. Epub 2013 Feb 28. Curr Opin Biotechnol. 2013. PMID: 23453397 Review.
-
Metabolic flux analysis based on 13C-labeling experiments and integration of the information with gene and protein expression patterns.Adv Biochem Eng Biotechnol. 2004;91:1-49. doi: 10.1007/b94204. Adv Biochem Eng Biotechnol. 2004. PMID: 15453191 Review.
Cited by
-
Mass Spectrometry-Based Method to Study Inhibitor-Induced Metabolic Redirection in the Central Metabolism of Cancer Cells.Mass Spectrom (Tokyo). 2018;7(1):A0067. doi: 10.5702/massspectrometry.A0067. Epub 2018 Jun 14. Mass Spectrom (Tokyo). 2018. PMID: 29922569 Free PMC article.
-
Direct and quantitative analysis of altered metabolic flux distributions and cellular ATP production pathway in fumarate hydratase-diminished cells.Sci Rep. 2020 Aug 3;10(1):13065. doi: 10.1038/s41598-020-70000-6. Sci Rep. 2020. PMID: 32747645 Free PMC article.
-
mfapy: An open-source Python package for 13C-based metabolic flux analysis.Metab Eng Commun. 2021 Jul 17;13:e00177. doi: 10.1016/j.mec.2021.e00177. eCollection 2021 Dec. Metab Eng Commun. 2021. PMID: 34354925 Free PMC article.
-
13C-metabolic flux analysis of ethanol-assimilating Saccharomyces cerevisiae for S-adenosyl-L-methionine production.Microb Cell Fact. 2018 May 31;17(1):82. doi: 10.1186/s12934-018-0935-6. Microb Cell Fact. 2018. PMID: 29855316 Free PMC article.
-
Prediction of Metabolic Flux Distribution by Flux Sampling: As a Case Study, Acetate Production from Glucose in Escherichia coli.Bioengineering (Basel). 2023 May 24;10(6):636. doi: 10.3390/bioengineering10060636. Bioengineering (Basel). 2023. PMID: 37370567 Free PMC article.
References
-
- Ahn W.S., Antoniewicz M.R. Parallel labeling experiments with [1,2-13C]glucose and [U-13C]glutamine provide new insights into CHO cell metabolism. Metab. Eng. 2013;15:34–47. - PubMed
-
- Antoniewicz M.R. 13C metabolic flux analysis: optimal design of isotopic labeling experiments. Curr. Opin. Biotechnol. 2013;24:1116–1121. - PubMed
-
- Antoniewicz M.R. Using multiple tracers for 13C metabolic flux analysis. Methods Mol. Biol. 2013;985:353–365. - PubMed
-
- Antoniewicz M.R. Methods and advances in metabolic flux analysis: a mini-review. J. Ind. Microbiol. Biotechnol. 2015;42:317–325. - PubMed
-
- Antoniewicz M.R., Kelleher J.K., Stephanopoulos G. Determination of confidence intervals of metabolic fluxes estimated from stable isotope measurements. Metab. Eng. 2006;8:324–337. - PubMed
LinkOut - more resources
Full Text Sources
Other Literature Sources
