Quantification of the tug-back by measuring the pulling force and micro computed tomographic evaluation
- PMID: 29142875
- PMCID: PMC5682143
- DOI: 10.5395/rde.2017.42.4.273
Quantification of the tug-back by measuring the pulling force and micro computed tomographic evaluation
Erratum in
-
Corrigendum: Corrections to the funding. Quantification of the tug-back by measuring the pulling force and micro computed tomographic evaluation.Restor Dent Endod. 2018 Jan 24;43(1):e8. doi: 10.5395/rde.2018.43.e8. eCollection 2018 Feb. Restor Dent Endod. 2018. PMID: 29488510 Free PMC article.
Abstract
Objectives: The aims of this study were to quantify tug-back by measuring the pulling force and investigate the correlation of clinical tug-back pulling force with in vitro gutta-percha (GP) cone adaptation score using micro-computed tomography (µCT).
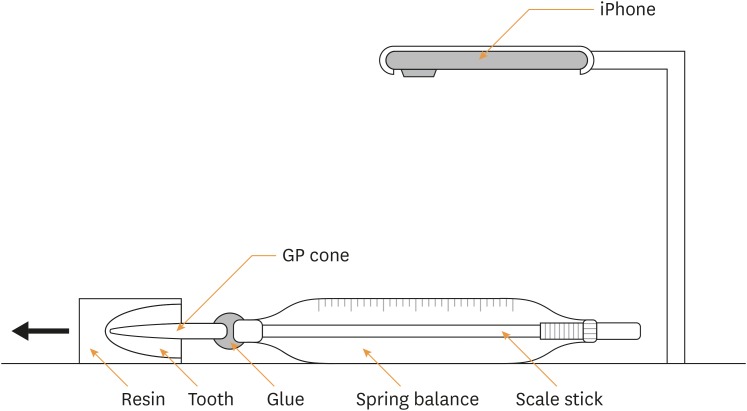
Materials and methods: Twenty-eight roots from human single-rooted teeth were divided into 2 groups. In the ProTaper Next (PTN) group, root canals were prepared with PTN, and in the ProFile (PF) group, root canals were prepared using PF (n = 14). The degree of tug-back was scored after selecting taper-matched GP cones. A novel method using a spring balance was designed to quantify the tug-back by measuring the pulling force. The correlation between tug-back scores, pulling force, and percentage of the gutta-percha occupied area (pGPOA) within apical 3 mm was investigated using µCT. The data were analyzed using Pearson's correlation analysis, one-way analysis of variance (ANOVA) and Tukey's test.
Results: Specimens with a strong tug-back had a mean pulling force of 1.24 N (range, 0.15-1.70 N). This study showed a positive correlation between tug-back score, pulling force, and pGPOA. However, there was no significant difference in these factors between the PTN and PF groups. Regardless of the groups, pGPOA and pulling force were significantly higher in the specimens with a higher tug-back score (p < 0.05).
Conclusions: The degree of subjective tug-back was a definitive determinant for master cone adaptation in the root canal. The use of the tug-back scoring system and pulling force allows the interpretation of subjective tug-back in a more objective and quantitative manner.
Keywords: Gutta-percha; Microcomputed tomography; Pulling force; Root canal obturation; Tug-back.
Conflict of interest statement
Conflict of Interest: No potential conflict of interest relevant to this article was reported.
Figures

References
-
- Inan U, Aydin C, Tunca YM, Basak F. In vitro evaluation of matched-taper single-cone obturation with a fluid filtration method. J Can Dent Assoc. 2009;75:123. - PubMed
-
- Gordon MP, Love RM, Chandler NP. An evaluation of .06 tapered gutta-percha cones for filling of .06 taper prepared curved root canals. Int Endod J. 2005;38:87–96. - PubMed
-
- Schilder H. Filling root canals in three dimensions. 1967. J Endod. 2006;32:281–290. - PubMed
-
- Silva-Filho JM, Souza-Gabriel AE, Leoni GB, De-Bem SH, Alfredo E, Silva RG. Comparison of two techniques for selection of master gutta-percha cone using micro-computed tomography. Braz Dent J. 2013;24:367–370. - PubMed
-
- Hembrough MW, Steiman HR, Belanger KK. Lateral condensation in canals prepared with nickel titanium rotary instruments: an evaluation of the use of three different master cones. J Endod. 2002;28:516–519. - PubMed
LinkOut - more resources
Full Text Sources
Other Literature Sources