

Geographic Variation and US County Characteristics Associated With Rapid Kidney Function Decline
- PMID: 29142937
- PMCID: PMC5678675
- DOI: 10.1016/j.ekir.2016.08.016
Geographic Variation and US County Characteristics Associated With Rapid Kidney Function Decline
Abstract
Introduction: Geographic variation in the prevalence of chronic kidney disease and incidence of end-stage renal disease has been previously reported. However, the geographic epidemiology of rapid estimated glomerular filtration rate (eGFR) decline has not been examined.
Methods: We built a longitudinal cohort of 2,107,570 US veterans to characterize the spatial epidemiology of and examine the associations between US county characteristics and rapid eGFR decline.
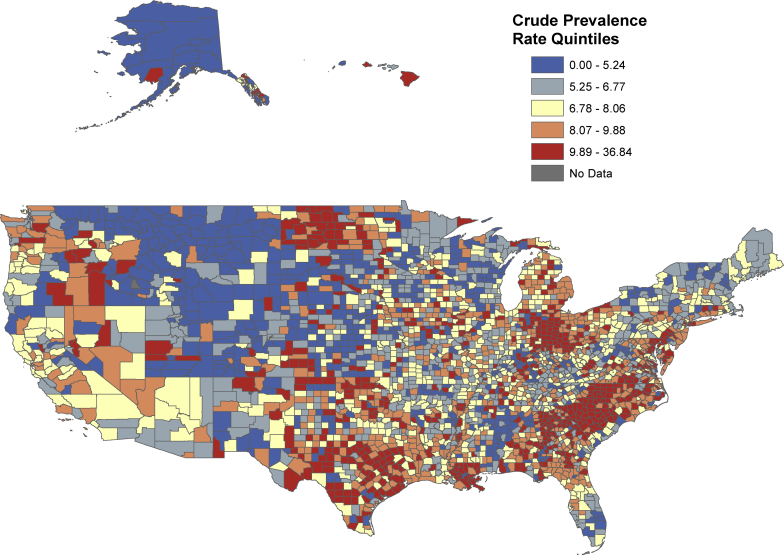
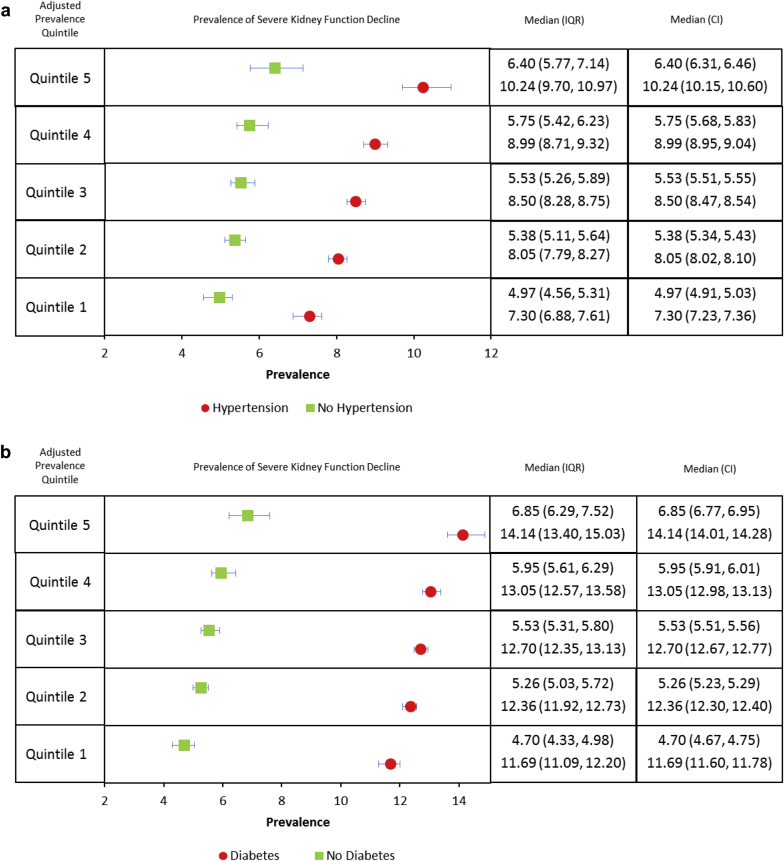
Results: There were 169,029 (8.02%) with rapid eGFR decline (defined as eGFR slope < -5 ml/min per 1.73 m2/year). The prevalence of rapid eGFR decline adjusted for age, race, gender, diabetes, and hypertension varied by county from 4.10%-6.72% in the lowest prevalence quintile to 8.41%-22.04% in the highest prevalence quintile (P for heterogeneity < 0.001). Examination of adjusted prevalence showed substantial geographic variation in those with and without diabetes and those with and without hypertension (P for heterogeneity < 0.001). Cohort participants had higher odds of rapid eGFR decline when living in counties with unfavorable characteristics in domains including health outcomes (odds ratio [OR] = 1.15; confidence interval [CI] = 1.09-1.22), health behaviors (OR = 1.08; CI = 1.03-1.13), clinical care (OR = 1.11; CI = 1.06-1.16), socioeconomic conditions (OR = 1.15; CI = 1.09-1.22), and physical environment (OR = 1.15; CI = 1.01-1.20); living in counties with high percentage of minorities and immigrants was associated with rapid eGFR decline (OR = 1.25; CI = 1.20-1.31). Spatial analyses suggest the presence of cluster of counties with high prevalence of rapid eGFR decline.
Discussion: Our findings show substantial geographic variation in rapid eGFR decline among US veterans; the variation persists in analyses stratified by diabetes and hypertension status; results show associations between US county characteristics in domains capturing health, socioeconomic, environmental, and diversity conditions, and rapid eGFR decline.
Keywords: disparity in kidney disease; eGFR decline; geographic information systems; geographic variation; kidney function; spatial epidemiology.
Figures


References
-
- McClellan A.C., Plantinga L., McClellan W.M. Epidemiology, geography and chronic kidney disease. Curr Opin Nephrol Hypertens. 2012;21:323–328. - PubMed
-
- Toubiana L., Richard J.B., Landais P. Geographical information system for end-stage renal disease: SIGNe, an aid to public health decision making. Nephrol Dial Transpl. 2005;20:273–277. - PubMed
LinkOut - more resources
Full Text Sources
Other Literature Sources
Research Materials
Miscellaneous
