Review
. 2018 Jul;43(7):1590-1611.
doi: 10.1007/s00261-017-1383-1.

Magnetic resonance elastography: beyond liver fibrosis-a case-based pictorial review

Affiliations
Review

Magnetic resonance elastography: beyond liver fibrosis-a case-based pictorial review

Sudhakar K Venkatesh et al. Abdom Radiol (NY). 2018 Jul.

Abstract

Magnetic resonance elastography (MRE) has been introduced for clinical evaluation of liver fibrosis for nearly a decade. MRE has proven to be a robust and accurate technique for diagnosis and staging of liver fibrosis. As clinical experience with MRE grows, the possible role in evaluation of other diffuse and focal disorders of liver is emerging. Stiffness maps provide an opportunity to evaluate mechanical properties within a large volume of liver tissue. This enables appreciation of spatial heterogeneity of stiffness. Stiffness maps may reveal characteristic and differentiating features of chronic liver diseases and focal liver lesions and therefore provide useful information for clinical management. The objective of this pictorial review is to recapture the essentials of MRE technique and illustrate with examples, the utility of stiffness maps in other chronic liver disorders and focal liver lesions.

Keywords: Acute hepatitis; Amyloidosis; Congestive hepatopathy; Diffuse liver diseases; Elastograms; Focal liver lesions; Infiltrative diseases; Primary sclerosing cholangitis; Sarcoidosis.


Conflict of interest statement

Conflict of interest The authors confirm that this article content has no conflict of interest.

Figures

Fig. 1.
Fig. 1.
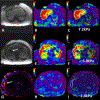
Steps in MRE of liver and generation of stiffness map. Top image showing the typical location of the passive driver on a T2W image in a patient with chronic hepatitis C cirrhosis. Magnitude and Phase maps (second row) are displayed on the scanner within seconds of acquiring an MRE slice. The color wave map, stiffness maps in gray scale, color map, and confidence maps (bottom row) are processed on the scanner and displayed within few minutes after completion of MRE sequence. The arrow shows the color scale from 0 to 8 kPa provided on the color map. Arrowheads point to the hashed out regions that are outside confidence limits. In this particular example, nearly the entire cross section of the liver is within confidence map.
Fig. 2.
Fig. 2.
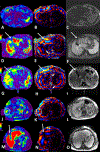
Examples illustrating correct drawing of region of interest (ROI) for measuring liver stiffness. Top row showing magnitude (A), stiffness map (B), and confidence map (C) in a 57-year-old female with BMI of 33.6 kg/m2 and non-alcoholic steatohepatitis. The ROI includes entire liver and mean stiffness is 7.2 kPa. Middle row showing magnitude (D), stiffness map (E), and confidence map (F) in a 56-year-old female with BMI of 42.8 kg/m2 with alcoholic cirrhosis. Arrow points to the artifact due to cholecystectomy clips which is seen as an area of low stiffness and the confidence map hashes out that region. The geographical ROI covers most of the right lobe of the liver and mean stiffness was 6.8 kPa. Bottom row showing wave image (G), stiffness map (H), and confidence map (I) in a 58-year-old female with BMI of 38.4 kg/m2 and fatty liver. Note that the confidence map hashes out most of the liver except for small peripheral region in right lobe which shows wave propagation (arrow, G). The ROI is drawn within the confidence map and is much smaller than two examples above. Mean stiffness was 1.8 kPa. Smaller regions of confidence may be seen in normal livers as healthy non-fibrotic liver parenchyma is soft and absorbs shear wave energy causing rapid attenuation of waves deep in the liver. This should not be interpreted as failed MRE study.
Fig. 3.
Fig. 3.
Examples illustrating areas to avoid when drawing regions of interest. Top row showing an area of hot spot (dotted circle) in stiffness map (A) that corresponds to area of large wave amplitude on wave image (B). No focal lesions demonstrated on corresponding T2W image (C). Hot spots are usually seen under the passive driver. Second row shows area of low stiffness (D, arrow) that corresponds to a region separating two wave fronts (E) and fissure for ligamentum teres seen on magnitude image (F). Third row showing region of low stiffness in the region of gallbladder fossa (arrow, G), corresponding to an area of low amplitude waves (arrow, H) and hypointensity due to gallstones in corresponding anatomical image (I). Fourth row showing a focal region of increased stiffness (white circle, J) due to wave interference (white circle, K) with no corresponding anatomical abnormality on magnitude image (L). Fifth row demonstrating a focal area of decreased stiffness (white arrow, M) secondary to artifact, and wave interference (white arrow, N) with no corresponding focal abnormality on magnitude image (O). Changing the position of passive driver may help in removing the wave interference artifacts. Arrow heads (E, H) point to vascular pulsation artifacts.
Fig. 4.
Fig. 4.
Heterogeneity of stiffness distribution and variability of mean stiffness in chronic liver disease of same etiology and same biopsy determined stage of fibrosis. Stiffness maps in four patients (AD) with chronic hepatitis C and cirrhosis. Note heterogeneity of parenchyma stiffness and mean stiffness ranges from 5.8 to 8.2 kPa.
Fig. 5.
Fig. 5.
Heterogeneity of stiffness distribution in different chronic liver diseases at same biopsy determined stage of fibrosis. Stiffness maps from biopsy-proven cirrhosis secondary to chronic hepatitis C (A), chronic hepatitis B (B), non-alcoholic steatohepatitis (C), and primary biliary cirrhosis (D).
Fig. 6.
Fig. 6.
Primary sclerosing cholangitis in a patient with ulcerative colitis. Axial T2W image (A) shows dilated peripheral ducts in right anterior liver lobe with no corresponding perfusion change on post-contrast image (B). Stiffness maps (C, D) of two consecutive MRE sections shows peripheral increased stiffness, particularly in the right anterior lobe (arrows) with normal stiffness in central liver (arrowheads).
Fig. 7.
Fig. 7.
Primary sclerosing cholangitis showing correlate of peripherally increased liver stiffness (A) to hyperintensity on T2W (B) and DWI (C), hyper perfusion in arterial phase (D) and delayed enhancement in the delayed phase (E) and decreased uptake of Eovist on hepatobiliary phase (F).
Fig. 8.
Fig. 8.
Non-alcoholic steatohepatitis with biopsy-proven stage 2 fibrosis. Axial in-phase (A) and opposed-phase (B) images show drop off signal consistent with fatty change in the liver. Note no morphological signs of advanced fibrosis or cirrhosis on T2W (C) image. Stiffness map (D) shows elevated liver stiffness with a mean of 3.8 kPa consistent with stage 2 fibrosis.
Fig. 9.
Fig. 9.
Chronic hepatitis C patient on follow-up. Biopsy performed 7 years earlier showed stage 1 fibrosis. Conventional T2W (A) and opposed-phase image (B) do not show any signs of chronic liver disease. Spleen size is also normal. Stiffness map (C) shows liver stiffness of 6.2 kPa consistent with advanced fibrosis/cirrhosis.
Fig. 10.
Fig. 10.
Acute inflammation. A 66-year-old male with no prior history of liver disease presented with jaundice and fatigue with elevated serum ALT of 1773 (Normal, < 55 IU/L), AST 1244 (Normal, < 48 IU/L). MRI and MRE were performed. Axial T2W image (A) and intravenous gadolinium enhanced portal venous phase (B) do not reveal any significant abnormality in liver. MRE (C) shows significantly elevated mean liver stiffness of 8.6 kPa. Biopsy showed severe inflammatory infiltrate, marked interface activity, severe lobular inflammatory with several necroinflammatory foci with focal bridging necrosis. Periportal fibrosis (stage 2) was also present. Findings were consistent with autoimmune hepatitis and patient responded to oral steroids and azathioprine therapy and currently on follow-up.
Fig. 11.
Fig. 11.
A 56-year-old female with history of alcoholism. At initial presentation showing elevated liver stiffness measuring 14 kPa (A). After abstinence and follow-up at 7 months shows liver stiffness returning to nearly normal (2.6 kPa) (B).
Fig. 12.
Fig. 12.
A 75-year-old female with biopsy-proven hilar cholangiocarcinoma. MRCP (A) showing the hilar tumor (arrow). Axial T2W image (B) and post-contrast-enhanced T1-weighted image (C) showing subtle differences in signal intensity of right and left lobes and intrahepatic biliary dilatation right more than left. MRE (D) shows diffuse increase in liver stiffness with right lobe stiffer than left lobe which may be related to cholestasis.
Fig. 13.
Fig. 13.
Congestive hepatopathy. Top row—A 36-year-old male with history of pulmonary atresia and post-Fontan surgery. Axial T2W (A) image showing dilated hepatic veins (arrow) and MRE (B) showing stiff liver predominantly in the peripheral distribution and right lobe more involved. Bottom row—A 32-year-old patient with history of long-standing constrictive pericarditis following congenital heart surgery. Axial T2W (C) image showing hepatomegaly with dilated hepatic veins (arrows). MRE (D) shows increased stiffness somewhat more in periphery. Liver biopsy confirmed cirrhosis in this patient.
Fig. 14.
Fig. 14.
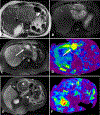
59-year-old diabetic male with elevated alkaline phosphatase and presumed fatty liver: There is mild hepatomegaly but otherwise normal MRI of the liver. Note enlarged spleen (A) with heterogeneous enhancement (B, arrow). There were enlarged portal lymph nodes (C, arrow) and thoracic lymphadenopathy and bone lesion (D, arrows). MRE (E) helped show liver is abnormal which would otherwise appear normal on routine MRI. PET (F) showed diffusely increased FDG uptake in liver and spleen. Patient underwent biopsy that was consistent with sarcoidosis.
Fig. 15.
Fig. 15.
45-year-old male with sarcoidosis diagnosed 3 years earlier. T2W (A) and T1W (B) images showing nodular liver suggestive of cirrhosis. Note granulomas in the spleen (arrows). MRE (C) shows increased liver stiffness with a mean of 4 kPa.
Fig. 16.
Fig. 16.
Lymphoma. A 19-year-old female with common variable immunodeficiency with history of splenectomy and presenting with enlarged liver. Coronal post-contrast-enhanced T1W image (A) showing hepatomegaly and enlarged mesenteric lymph nodes, axial DWI (B) showing multiple enlarged retroperitoneal lymph nodes as well (B, arrows). MRE (C) showed diffuse increased stiffness of liver with a mean of 5.9 kPa. Histology confirmed lymphoma and no fibrosis.
Fig. 17.
Fig. 17.
47-year-old female with proven amyloidosis. Coronal T2W image (A) showing hepatosplenomegaly. Stiffness map (B) showing elevated stiffness in both liver and spleen. Stiffness map with 0–20 scale (C) showing the heterogeneous distribution of amyloid deposition in the liver.
Fig. 18.
Fig. 18.
Neuroendocrine metastases diffusely studding both lobes of the liver on axial T2W (A) and post-contrast T1W (B) images. MRE (C) shows diffusely increased stiffness of the liver with focal areas of increased stiffness corresponding to regions of coalescing metastases.
Fig. 19.
Fig. 19.
Focal confluent fibrosis. Chronic biliary cirrhosis showing a region of hyperintensity on T2W (A) and diffusion-weighted images (B) that correspond to focally increased stiffness region on the eiastograms (C, D). The focally increased stiffness is better demonstrated on 0–20 kPa scale (arrow, D).
Fig. 20.
Fig. 20.
Focal biliary stricture causing focal region of elevated stiffness in primary sclerosing cholangitis. T2W (A) and MRCP (B) showing focal dilatation of segment 3 ducts (circle). Stiffness map (C) shows focal increased stiffness over same region.
Fig. 21.
Fig. 21.
Healing liver abscess in a liver transplant. Focal area of increased liver stiffness corresponds to hyperintensity (arrow) on T2W image (A) and enhancing region (arrow) on post-gadolinium-enhanced portal venous image (B). Note central core of higher stiffness within the abscess in the stiffness map (C).
Fig. 22.
Fig. 22.
Hepatocellular carcinomas in two patients. Top row (AC) showing a large HCC with arterial phase (A) hyperenhancement and portal venous washout (B) with corresponding heterogeneous but increased stiffness region (arrow) on the stiffness map (C). Note only mildly elevated stiffness of the surrounding liver parenchyma. A small HCC in another patient (bottom row, DF) shows arterial phase hyperenhancement (arrow, A) with no washout in portal venous phase (arrow, B) and is not distinguishable from surrounding cirrhotic liver parenchyma (circle) on the stiffness map (F).
Fig. 23.
Fig. 23.
Malignant focal lesions. Top row T2W (A), postcontrast T1W (B), and stiffness map (C) showing an intrahepatic cholangiocarcinoma with satellite lesions and intrahepatic metastases. Large primary mass (arrow) corresponds to stiff region on stiffness map. Note the satellite lesion and metastases (arrowheads) corresponding to regions of increased stiffness in right lobe. Note also increased left lobe stiffness due to other metastases (metastases are not shown). Bottom row T2W (D), hepatobiliary phase image (E), and stiffness map (F) showing two large metastases (arrows) from neuroendocrine carcinoma of the pancreas (not shown). The focal regions of increased stiffness correspond to metastases within normal liver parenchyma.
Fig. 24.
Fig. 24.
Primary sclerosing cholangitis on follow-up. Two adjacent large hypointense regions (*) in right lobe on T2W image (A) that show no restricted diffusion on DWI (B) and only mild significant post-contrast hyperenhancement in arterial phase (C) and other phases (not shown). These regions have normal or slightly elevated stiffness on stiffness map (D, arrows) suggestive of regenerative nodules. These lesions showed mild increase in size during 2-year follow-up and no other suspicious features.
Fig. 25.
Fig. 25.
Chronic autoimmune hepatitis with multiple regenerative nodules. Axial T2W (A), DWI (B), post-contrast-enhanced delayed phase T1W (C) images and stiffness map (D) show multiple regenerative nodules studded throughout the liver. Regenerative nodules show lower stiffness as compared to background fibrotic parenchyma. Arrows point to a single regenerative nodule in posterior right lobe that is surrounded by fibrotic band.
Fig. 26.
Fig. 26.
Hepatic adenomas as stealth lesions on stiffness maps. Axial T2W (A), DWI (B), and hepatobiliary phase image following Eovist (C) showing multiple lesions in liver in a patient with hepatic adenomatosis. The stiffness map (D) shows normal stiffness with no discrete lesions. Note difference from diffuse metastatic disease which is associated with increases in liver stiffness.
Fig. 27.
Fig. 27.
A 47-year-old male with a biopsy-proven large HCC involving the left lobe of the liver. The mass is mildly hyperintense on T2W (A) at initial diagnostic MRI and shows partial internal necrosis on the T2W (B) on MRI performed 3 weeks after chemoembolization. Post-contrast-enhanced arterial phase image (C, E) and their corresponding MRE slices (D, F). Residual enhancing nodule (arrow, D) appears stiff on the elastogram with remainder necrotic region appearing softer (dotted outline). The completely necrotic inferior aspect appears soft (*, dotted outline) similar to gallbladder (GB).

Similar articles

Cited by

References

    1. Venkatesh SK, Yin M, Ehman RL (2013) Magnetic resonance elastography of liver: technique, analysis, and clinical applications. J Magn Reson Imaging 37:544–555 - PMC - PubMed
    1. Singh S, Venkatesh SK, Wang Z, et al. (2015) Diagnostic performance of magnetic resonance elastography in staging liver fibrosis: a systematic review and meta-analysis of individual participant data. Clin Gastroenterol Hepatol 13(440–451):e6 - PMC - PubMed
    1. Singh S, Venkatesh SK, Loomba R, et al. (2016) Magnetic resonance elastography for staging liver fibrosis in non-alcoholic fatty liver disease: a diagnostic accuracy systematic review and individual participant data pooled analysis. Eur Radiol 26:1431–1440 - PMC - PubMed
    1. Singh S, Venkatesh SK, Keaveny A, et al. (2016) Diagnostic accuracy of magnetic resonance elastography in liver transplant recipients: a pooled analysis. Ann Hepatol 15:363–376 - PMC - PubMed
    1. Jajamovich GH, Dyvome H, Donnerhack C, et al. (2014) Quantitative liver MRI combining phase contrast imaging, elastography, and DWI: assessment of reproducibility and postprandial effect at 3.0 T. PLoS ONE 9:e97355. - PMC - PubMed

Publication types

MeSH terms