. 2018 Feb;44(1):115-145.
doi: 10.1007/s10827-017-0672-6. Epub 2017 Nov 16.

Cliques and cavities in the human connectome

Affiliations

Cliques and cavities in the human connectome

Ann E Sizemore et al. J Comput Neurosci. 2018 Feb.

Abstract

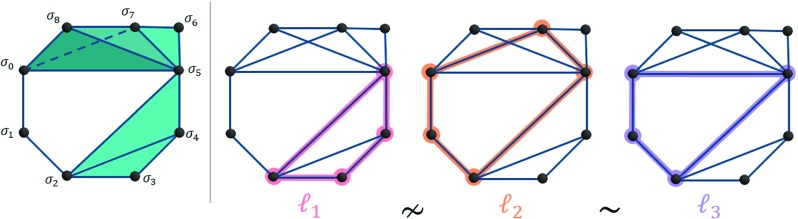
Encoding brain regions and their connections as a network of nodes and edges captures many of the possible paths along which information can be transmitted as humans process and perform complex behaviors. Because cognitive processes involve large, distributed networks of brain areas, principled examinations of multi-node routes within larger connection patterns can offer fundamental insights into the complexities of brain function. Here, we investigate both densely connected groups of nodes that could perform local computations as well as larger patterns of interactions that would allow for parallel processing. Finding such structures necessitates that we move from considering exclusively pairwise interactions to capturing higher order relations, concepts naturally expressed in the language of algebraic topology. These tools can be used to study mesoscale network structures that arise from the arrangement of densely connected substructures called cliques in otherwise sparsely connected brain networks. We detect cliques (all-to-all connected sets of brain regions) in the average structural connectomes of 8 healthy adults scanned in triplicate and discover the presence of more large cliques than expected in null networks constructed via wiring minimization, providing architecture through which brain network can perform rapid, local processing. We then locate topological cavities of different dimensions, around which information may flow in either diverging or converging patterns. These cavities exist consistently across subjects, differ from those observed in null model networks, and - importantly - link regions of early and late evolutionary origin in long loops, underscoring their unique role in controlling brain function. These results offer a first demonstration that techniques from algebraic topology offer a novel perspective on structural connectomics, highlighting loop-like paths as crucial features in the human brain's structural architecture.

Keywords: Applied topology; Network neuroscience; Persistent homology.


Conflict of interest statement

The authors declare that they have no conflict of interest.

Figures

Fig. 1
Fig. 1
Cliques are features of local neighborhoods in structural brain networks. a Diffusion spectrum imaging (DSI) data can be summarized as a network of nodes corresponding to brain regions, and weighted edges corresponding to the density of white matter streamlines reconstructed between them. Here we present a group-averaged network, where each edge corresponds to the mean density of white matter streamlines across eight subjects scanned in triplicate. We show the network at an edge density ρ = 0.25, and display its topology on the brain (top), and on a circle plot (bottom). This and all brain networks are drawn with BrainNetViewer (Xia et al. 2013). b All-to-all connected subgraphs on k nodes are called k-cliques. For example, 2-, 3-, and 4-cliques are shown both as schematics and as features of a structural brain network. c A maximal 4-clique has 3-, 2-, and 1-cliques as faces. d For statistical validation, we construct a minimally wired null model by linking brain regions by edge weights equal to the inverse of the Euclidean distance between nodes corresponding to brain region centers. Here we show an example of this scheme on 15 randomly chosen brain regions
Fig. 2
Fig. 2
Spatial distribution of maximal cliques varies between average DSI and minimally wired null model. a Distribution of maximal cliques in the average DSI (black) and individual minimally wired (gray) networks, thresholded at an edge density of ρ = 0.25. Heat maps of node participation on the brain for a range of clique degrees equal to 4–6 (left), 8–10 (middle), and 12–16 (right). b Node participation in maximal cliques sorted by the putative cognitive system to which the node is affiliated in functional imaging studies (Power et al. 2011). We show individual node values (top) as well as the difference between real and null model (P k D S IP k M W; bottom) according to the colormap (right). Individual node labels are listed in Fig. 9
Fig. 3
Fig. 3
Maximal clique participation tracks with network measures. a Scatter plot of node participation and node strength (top) or communicability (bottom). b Calculated k-core (top) and s-core decomposition in relation to participation in maximal cliques with rich club nodes (shown k RC = 43; see Methods and Fig. 10) indicated in orange (bottom). Size indicates maximum k-core or s-core level attained by the node, while color indicates the participation P(v)
Fig. 4
Fig. 4
Tracking clique patterns through a network filtration reveals key topological cavities in the structural brain network. a Example filtration of a network on 15 nodes shown in the brain across edge density (ρ). Blue line on the axis indicates the density of birth (ρ birth) of the 2D cavity surrounded by the green minimal cycle. As edges are added, 3-cliques (cyan) form and shrink the cavity and consequentially the minimal green cycle is now four nodes in size. Finally, the orange line marks the time of death (ρ death) when the cavity is now filled by 3-cliques. b Persistence diagram for the cavity surrounded by the green cycle from panel a. c Persistence diagrams for the group-averaged DSI (teal) and minimally wired null (gray) networks in dimensions one (left) and two (right). Cavities in the group-averaged DSI network with long lifetime or high death-to-birth ratio are shown in unique colors and will be studied in more detail. d Box plots of the death-to-birth ratio π for cavities of two and three dimensions in the group-averagd DSI and minimally wired null networks. Colored dots correspond to those highlighted in panel c. The difference between π values for 3D topological cavities in the average DSI data versus the minimally wired null model was not found to be significant. e Minimal cycles representing each persistent cavity at ρ birthnoted in panels c, d shown in the brain (top) and as a schematic (bottom)
Fig. 5
Fig. 5
Cycles and similar cavities in the average DSI network are consistently seen across individuals. a, c, e, g Edge weights connecting nodes seen in the minimal cycle(s) recovered from the average DSI were summed then normalized for all individual scan data. b, d, f, h (Top) Within each scan, the network was thresholded at the minimal weight of any edge which would form the cycle seen in the average DSI data. At this threshold, any connection which exists between these cycle nodes is shown. A gray background indicates a similar cavity found in this scan. For those cycles seen which are not tessellated by higher cliques yet there is no gray background, there must exist some set of nodes which cone this cycle and thus make this loop equivalent to a point. (Bottom) Similar cycles found represented by vertical bars from birth to death density in the individual DSI networks, minimally wired networks, normalized data, and contralateral (cont.) hemispheres
Fig. 6
Fig. 6
Removal of subcortical nodes allows for detection of nine-node cortical cycle enclosing large 2D cavity. a Minimal cycles shown in the brain (left) and as a schematic (right). b Persistence diagram of D S I cortand M W cort. Persistent feature corresponding to minimal cycles in (a) indicated with maroon dot
Fig. 7
Fig. 7
Maximal clique distribution along the filtration. a Distribution of maximal cliques at each edge density for the average DSI network, and b average maximal clique distribution for the minimally wired networks
Fig. 8
Fig. 8
Maximal clique correlation with anterior-posterior gradient. a Pearson correlation coefficient of P k(v)with the coordinate along the anterior-posterior axis. b Spatial distribution of P k(v)for each k. Color of node corresponds to the value of P k(v)between zero and the maximum participation of any node for the given degree k
Fig. 9
Fig. 9
Order of brain regions for Fig. 2b
Fig. 10
Fig. 10
Defining the rich club of the DSI network. Rich club coefficient of the DSI network (ϕ(k)) is shown in black, the average rich club coefficient of randomized networks (ϕ rand(k)) in gray, and the normalized rich club coefficient ϕ norm(k)) in blue. Shaded regions indicate values of k for which ϕ(k)significantly exceeded ϕ rand(k)
Fig. 11
Fig. 11
From cliques to a clique complex. a Cliques are all-to-all connected sets of nodes which we use as “filled in” building blocks. b The clique complex is created by inserting these building blocks into the completely connected subgraphs of G
Fig. 12
Fig. 12
Chain group elements are linear combinations of cliques. See Appendix text for a complete description of these graphs
Fig. 13
Fig. 13
Example of the boundary operator in C 2. See Appendix text for a complete description of these graphs
Fig. 14
Fig. 14
Illustration of creating from G the clique complex X(G). Also shown are the induced chain complex C (X(G))and an example of boundary calculations on an element in C 2(X(G))
Fig. 15
Fig. 15
Cycles. Examples of a cycle that is also a boundary ( 1) and two equivalent, non-boundary cycles ( 2and 3)
Fig. 16
Fig. 16
Filtrations and inclusion maps. Edge weights indicated by line thickness induce a filtration on the weighted graph G. The inclusion maps G iG i+ 1induce inclusion maps on the corresponding clique complexes X(G i)↪X(G i+ 1)
Fig. 17
Fig. 17
Inclusion maps between clique complexes induce maps between the corresponding chain complexes. See Appendix text for a complete description of these graphs
Fig. 18
Fig. 18
Illustration of the persistence complex of the weighted graph G. The green 1-cycle is first seen in X(G 12), is mapped through filtrations, and finally becomes the boundary of a collection of 3-cliques (pink) in X(G 14)
Fig. 19
Fig. 19
Example persistence diagram for green cycle shown in Fig. 18. See Appendix text for a complete description of these graphs
Fig. 20
Fig. 20
Minimal representatives at ρ birthof all 2D cavities found in the average DSI data, listed in order of increasing birth density. For each topological cavity, the lifespan (ρ birth- ρ death), location in the brain, and schematic is shown. For the third, seventh, and tenth appearing cavities, we could not isolate exactly one unique equivalence class
Fig. 21
Fig. 21
Minimal representatives at ρ birthof all 3D cavities found in the average DSI data, listed in order of increasing birth density. For each, the lifespan (ρ birth- ρ death), location in the brain, and schematic is shown
Fig. 22
Fig. 22
Spatial distribution of minimal generators at ρ birthof 2D (top) and 3D (bottom) persistent cavities. Edge thickness reflects the number of minimal generators in which they participate
Fig. 23
Fig. 23
Validation of similar topological cavities in additional data. For each of the four minimal generators highlighted in the main text, bars indicate cavity lifetime for all collected data. Dotted lines indicate average birth or death edge density
Fig. 24
Fig. 24
Lifetimes of all 20 persistent 2D cavities in the individuals (black bars) and minimally wired models (gray bars). Dashed lines indicate the average birth and death densities of each class
Fig. 25
Fig. 25
Lifetimes of both persistent 3D cavities in the individuals (black bars) and minimally wired models (gray bars). Dashed lines indicate the average birth and death densities of each class
Fig. 26
Fig. 26
Recovered 1-cycle on nine nodes. a Minimal representatives at ρ birthshown in the brain (left) and as a schematic (right). b Persistence diagram of D S I cortand M W cort. Topological cavity in (a) circled in maroon. c Patterns of connectivity between maroon loop nodes found for the original (c) and contralateral d hemispheres in each scan. If the exact pattern is not found, the pattern at the edge density when all cycle edges first exist is shown. For each scan, the connection pattern of nodes in the minimal generator with the fewest cross-edges is shown
Fig. 27
Fig. 27
Subcortical regions as cone points in the brain network. A loop (maroon, left) may be the base of a cone, where the cone point (gray) triangulates the loop interior thus making the loop a boundary loop. In the brain, the greater number and longevity of topological cavities seen after removing subcortical nodes indicates these subcortical regions (gray, right) may act as cone points for many cortical cycles

References

    1. Bassett DS, Bullmore E. Small-world brain networks. The Neuroscientist. 2006;12(6):512–523. doi: 10.1177/1073858406293182. - DOI - PubMed
    1. Bassett DS, Bullmore ET. Human brain networks in health and disease. Current Opinion in Neurology. 2009;22(4):340–347. doi: 10.1097/WCO.0b013e32832d93dd. - DOI - PMC - PubMed
    1. Bassett, D.S., & Bullmore, E.T. (2016). Small-world brain networks revisited. Neuroscientist Epub ahead of print 1073858416667720. - PMC - PubMed
    1. Bassett DS, Greenfield DL, Meyer-Lindenberg A, Weinberger DR, Moore SW, Bullmore ET. Efficient physical embedding of topologically complex information processing networks in brains and computer circuits. PLoS Computational Biology. 2010;6(4):1000748. doi: 10.1371/journal.pcbi.1000748. - DOI - PMC - PubMed
    1. Bassett DS, Brown JA, Deshpande V, Carlson JM, Grafton ST. Conserved and variable architecture of human white matter connectivity. NeuroImage. 2011;54(2):1262–1279. doi: 10.1016/j.neuroimage.2010.09.006. - DOI - PubMed