. 2018 Apr 1;142(7):1440-1452.
doi: 10.1002/ijc.31160. Epub 2017 Nov 29.

Intraductal papillary mucinous neoplasm of the pancreas rapidly xenografts in chicken eggs and predicts aggressiveness

Affiliations

Intraductal papillary mucinous neoplasm of the pancreas rapidly xenografts in chicken eggs and predicts aggressiveness

Zhefu Zhao et al. Int J Cancer. .

Abstract

Intraductal papillary mucinous neoplasm (IPMN) of the pancreas has a high risk of progressing to invasive pancreatic ductal adenocarcinoma (PDA), but experimental models for IPMN are largely missing. New experimental systems for the molecular characterization of IPMN and for personalized prognosis and treatment options for IPMN are urgently needed. We analyzed the potential use of fertilized chicken eggs for the culture of freshly resected IPMN tissue. We transplanted 49 freshly resected IPMN tissues into eggs and compared the growth characteristics to IPMN tissues transplanted into mice; this was followed by an analysis of histology, morphology, and marker expression. Of the IPMN tissues transplanted into eggs, 63% formed tumor xenografts within 4 days, while none of the 12 IPMN tissues transplanted into immunodeficient mice engrafted. In the eggs, the grafting efficiency of high-grade (n = 14) and intermediate-grade (n = 17) dysplasia was 77% and was significantly higher than the 39% grafting efficiency of low-grade dysplasia (n = 18). According to mucinous expression, 46 IPMN tissues were classified into gastric (n = 6), intestinal (n = 3), oncocytic (n = 23), and pancreatobiliary (n = 14) subtypes. The grafting efficiency was highest for the pancreatobiliary subtype (86%), followed by the oncocytic (70%), gastric (33%) and intestinal (33%) subtypes. The morphology and expression patterns of mucins, progression markers and pancreatic ductal markers were comparable between the primary IPMN tissues and their xenograft copies. The individual tumor environment was largely maintained during subtransplantation, as evaluated upon passage 6. This new IPMN model may facilitate experimental studies and treatment decisions for the optimal personalized management of IPMN.

Keywords: IPMN of the pancreas; chorioallantoic membrane; xenograft models.


Figures

Figure 1
Figure 1
The IPMN grafting efficiency in eggs corresponds to histological grading. (a) A representative image of a pancreatic surgical specimen with a main duct IPMN (arrows). (b) Left: A representative photograph of a subcutaneous PDA xenograft in nude mice. Right: Twenty‐eight freshly resected PDA tissues and 12 freshly resected IPMN tissues were subcutaneously transplanted into nude mice. The latency (days until tumor growth is visible) and grafting efficiency (percent of transplanted tissues that grew as xenografts) are shown as the mean values. *p < 0.05. (c) A representative photograph of an IPMN xenograft growing on the CAM of a fertilized chicken egg (arrow). (d) Left: The magnification of an IPMN xenograft in ovo. Right: The latency and grafting efficiency of 14 high‐dysplasia, 16 intermediate‐dysplasia and 19 low‐dysplasia IPMN tissues that were transplanted into eggs were measured, and the mean grafting efficiency is shown. *p < 0.05. [Color figure can be viewed at wileyonlinelibrary.com]
Figure 2
Figure 2
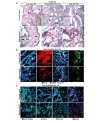
Egg xenografts resemble the primary patient tumor. ( a) Representative images of H&E‐stained primary tissue sections and the derived egg xenograft sections from a low‐dysplasia (patient No. 30), intermediate‐dysplasia (patient No. 24) and high‐dysplasia (patient No. 25) IPMN. The sections were analyzed under 400× magnification. Asterisks: ductal structures; green arrows: tumor stroma/fibrotic regions; red arrows: chick cells; black arrows: human cells. (b) Representative images of immunofluorescence staining of primary tissue sections from a high‐dysplasia IPMN (patient No. 25) and sections of the derived egg xenografts with KRAS (red) and cytokeratin 19 (Cyt19, green). The cell nuclei were stained with DAPI (blue). The sections were analyzed under 400× magnification. (c) Representative images of immunofluorescence staining of primary tissue sections from a low‐dysplasia IPMN (patient No. 30) and sections of the derived egg xenografts with MHC, cMet, CxCR4 (green), and SOX2 (red). The cell nuclei were counterstained with DAPI (blue). The sections were analyzed under 400× magnification. [Color figure can be viewed at wileyonlinelibrary.com]
Figure 3
Figure 3
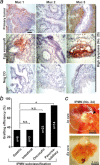
Tumor growth of IPMN in eggs correlates to mucin expression. (a) Representative images of immunohistochemistry stains of Mucin 1 (Muc 1), Mucin 2 (Muc 2) and Muc 5AC (Muc 5) in primary tumor sections from a high‐grade dysplasia IPMN (patient No. 25) and tissue sections of the derived egg xenografts. Photographs were taken at 40× magnification. Stains without primary antibodies served as a negative control (Neg CO). (b) The grafting efficiencies of 6 gastric, 3 intestinal, 23 oncocytic and 14 pancreatobiliary IPMNs were measured by callipers, and the means are shown as percentages. *p < 0.05. N.S.: non‐significant. (c) Representative images of a patient tumor‐derived egg xenograft from an intermediate‐grade dysplasia IPMN (patient No. 24) with mucinous sacs (arrows) in ovo (upper image) and after resection (ex ovo). [Color figure can be viewed at wileyonlinelibrary.com]
Figure 4
Figure 4
Establishment of intravenous gemcitabine injection and serial transplantation with IPMN‐derived primary ASANPaCa PDA cells. (a) 5 × 10⁵ ASANPaCa cells were transplanted to the CAM of fertilized chicken eggs at Day 8 of embryonic development. Ten days later, the tumors were resected, and followed by double‐immunofluorescence of frozen xenograft sections with CD44 (green)/CD24 (red) and counterstaining with DAPI (blue) or immunohistochemstry of c‐Met. (b) The proliferation marker Ki67. The positive cells appear red to dark red. TGFβ‐2 (green), E‐cadherin (green), and vimentin (red) expression in xenograft sections was detected by immunofluorescence staining and the cell nuclei were counterstained with DAPI (blue). Cell sections were analyzed under 400× magnification, and representative images are shown. (b) ASANPaCa cells were transplanted to chicken eggs as described above and at Day 15 of development, half of the eggs were intravenously injected via CAM vessels (left picture, tumor xenograft is marked by an arrow) with 20 µL of a 10 µM gemcitabine (GEM) or were left untreated (CO). At Day 18, the tumors were resected and frozen tissue sections were stained with the proliferation marker Ki67 by immunohistochemistry. The number of positive cells was quantified in 10 visual fields at 400× magnification, and the means ±SD are shown. **p < 0.01. (c) Xenotransplanted ASANPaCa cells were resected at Day 18 of development, minced and re‐transplanted to new eggs for 4 passages. The picture on the top is a cartoon of serial transplantation (P1: passage 1; P3: passage 3; P4: passage 4). Below, photographs of representative tumor xenografts growing on eggs at Day 17 are shown. Below, stainings of the resected tumor tissues with marker indicated are shown. (d) The tumor volumes of each individual tumor xenograft of each passage are presented as black dots and the mean tumor volume as black line. The diagram below shows the sum of tumor volumes of each passage. [Color figure can be viewed at wileyonlinelibrary.com]
Figure 5
Figure 5
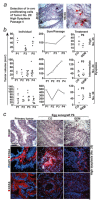
Serial transplantation enhances the volume of more aggressive IPMNs and enables treatment experiments. (a) Eggs harboring IPMN xenografts of primary tissue from high‐dysplasia (patient No. 25) at passage 4 were injected with 100 µL of a 10 mg/mL BrDU solution at Day 15, followed by xenograft resection at Day 18. The presence of BrDU‐positive, dividing cells (red arrows) was detected by immunohistochemistry and H&E counterstaining. IPMN xenografts of Patient 25 in passage 4 from non‐BrDU injected eggs served as controls. (b) Serial transplantation of primary tissues from high‐dysplasia (patient No. 25), intermediate‐dysplasia (patient No. 24) and low‐dysplasia (patient No. 30). P1: passage 1, P2: passage 2 and so on. The subtransplantations were repeated until, at passage 4 or 5, enough tumor xenografts for treatment experiments in small group sizes were available. Six days after transplantation, at passage 5 or 6, 50 µl gemcitabine (100 nM) was injected into the CAM blood vessels of the eggs from the treatment group (GEM), and saline was injected into the blood vessels of the control group (CO). Three days later, the xenografts were resected, the tumor volume was determined using callipers and the tissue was embedded in tissue Tek O.C.T. compound and stored on dry ice. The individual volumes of each tumor xenograft and the mean tumor volumes per passage are shown on the left (Individual). The sum of all individual tumor volumes from each passage is shown in the middle (Sum/Passage). The individual tumor volumes of untreated (CO) and gemcitabine‐treated (GEM) eggs at passage 6 (No. 25) or passage 5 (No. 24 and No. 30) and the means are shown on the right. (c) Cryosections of primary tissue from a high‐dysplasia IPMN from patient No. 25 and the derived xenograft tissue in passage 6, either treated with saline (CO) or gemcitabine (GEM) as described above, were stained with H&E or with specific antibodies to detect the expression of CD44 (red) and KRAS (red). The cell nuclei were counterstained with DAPI (blue). Representative images are shown under 400× magnification. [Color figure can be viewed at wileyonlinelibrary.com]

Similar articles

Cited by

References

    1. Ohashi KMY, Maruyama M, Takekoshi T, et al. Four cases of mucous‐secreting pancreatic cancer. Prog Dig Endosc 1982;20:348–51.
    1. Fritz S, Fernandez‐del Castillo C, Mino‐Kenudson M, et al. Global genomic analysis of intraductal papillary mucinous neoplasms of the pancreas reveals significant molecular differences compared to ductal adenocarcinoma. Ann Surg 2009;249:440–7. - PMC - PubMed
    1. Laffan TA, Horton KM, Klein AP, et al. Prevalence of unsuspected pancreatic cysts on MDCT. AJR Am J Roentgenol 2008;191:802–7. - PMC - PubMed
    1. Reid‐Lombardo KM, St Sauver J, Li Z, et al. Incidence, prevalence, and management of intraductal papillary mucinous neoplasm in Olmsted County, Minnesota, 1984–2005. A population study. Pancreas 2008;37:139–44. - PMC - PubMed
    1. Simons JP, Ng SC, Shah SA, et al. Malignant intraductal papillary mucinous neoplasm: are we doing the right thing?. J Surg Res 2011;167:251–7. - PubMed

Publication types