

Angelica sinensis Polysaccharides Ameliorate Stress-Induced Premature Senescence of Hematopoietic Cell via Protecting Bone Marrow Stromal Cells from Oxidative Injuries Caused by 5-Fluorouracil
- PMID: 29143796
- PMCID: PMC5713235
- DOI: 10.3390/ijms18112265
Angelica sinensis Polysaccharides Ameliorate Stress-Induced Premature Senescence of Hematopoietic Cell via Protecting Bone Marrow Stromal Cells from Oxidative Injuries Caused by 5-Fluorouracil
Abstract
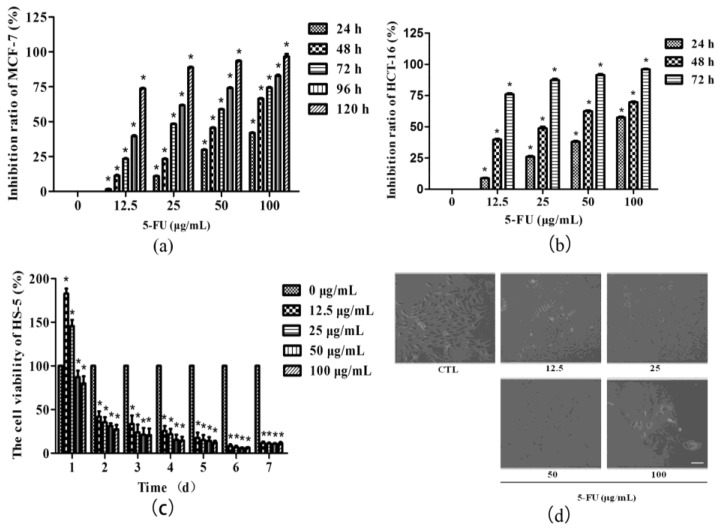
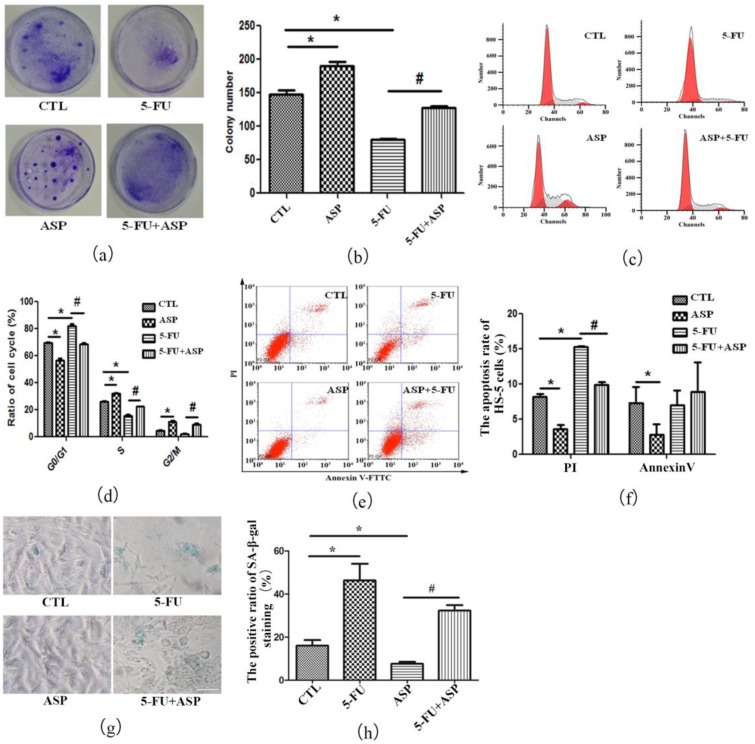
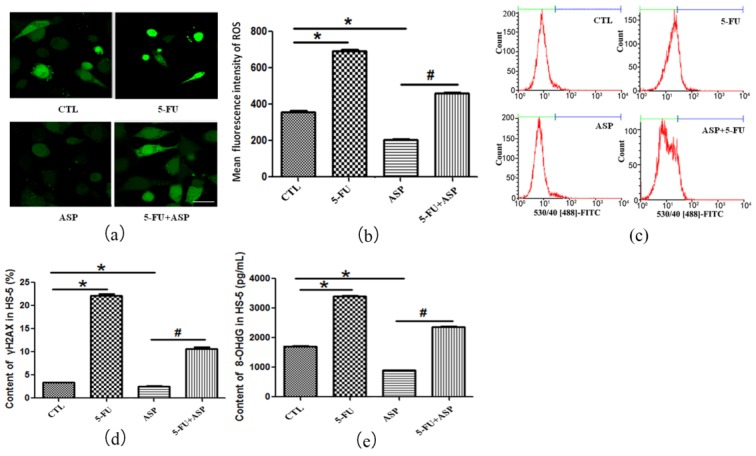
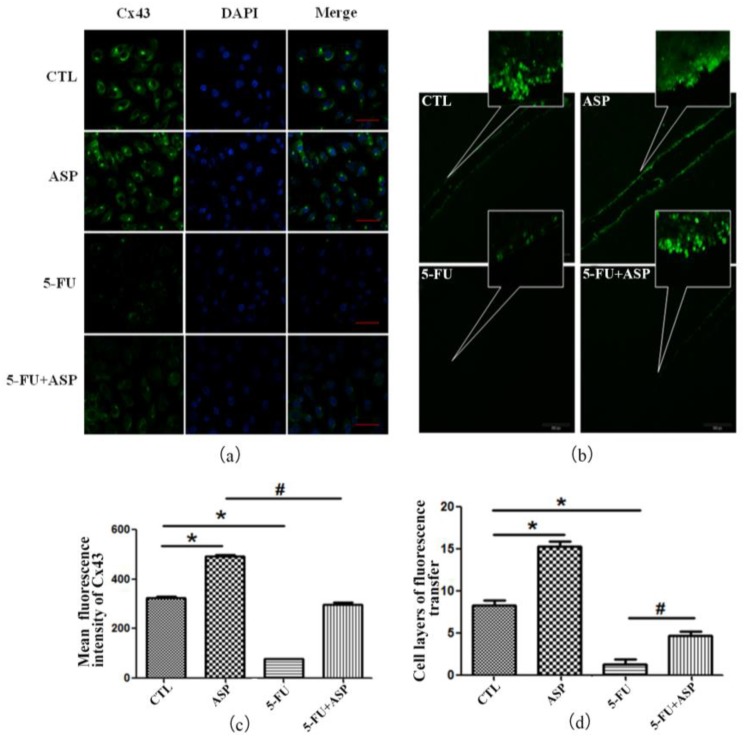
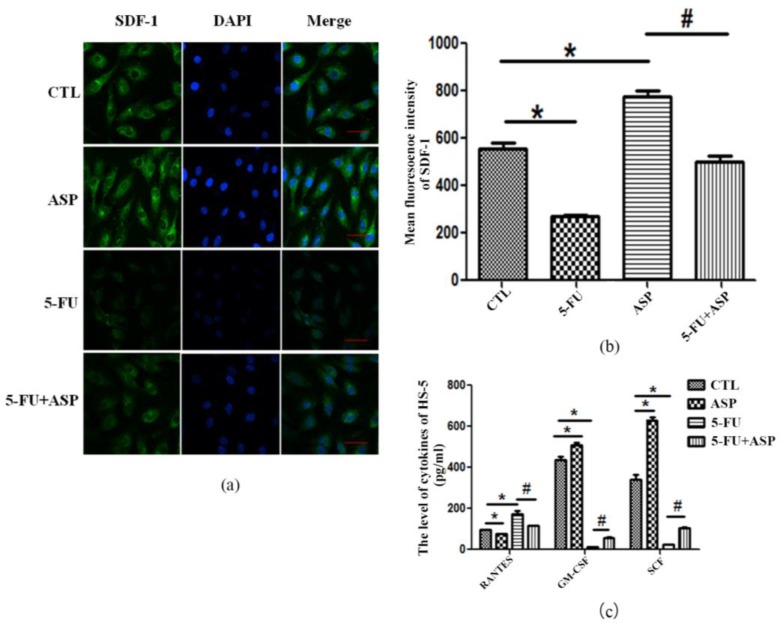
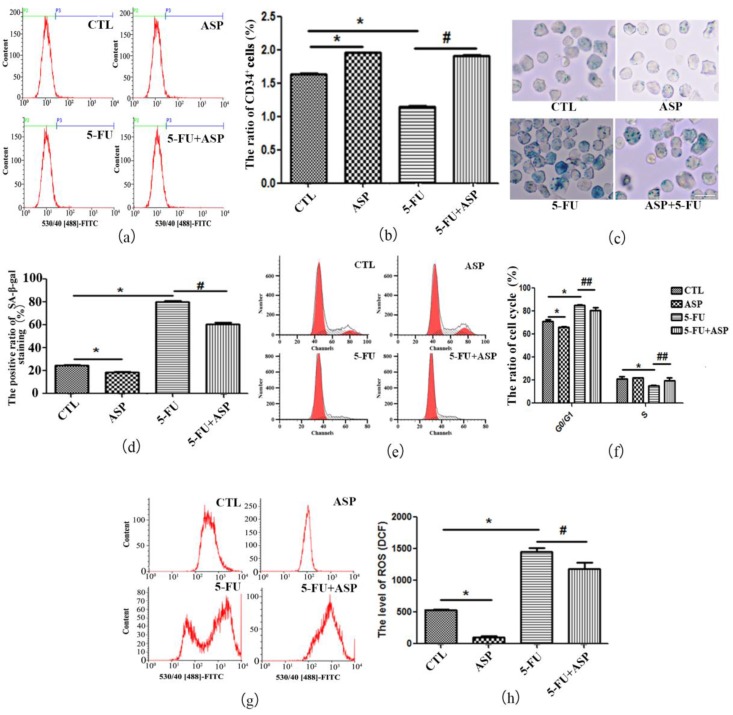
Myelosuppression is the most common complication of chemotherapy. Decline of self-renewal capacity and stress-induced premature senescence (SIPS) of hematopoietic stem cells (HSCs) induced by chemotherapeutic agents may be the cause of long-term myelosuppression after chemotherapy. Whether the mechanism of SIPS of hematopoietic cells relates to chemotherapeutic injury occurred in hematopoietic microenvironment (HM) is still not well elucidated. This study explored the protective effect of Angelica sinensis polysaccharide (ASP), an acetone extract polysaccharide found as the major effective ingredients of a traditional Chinese medicinal herb named Chinese Angelica (Dong Quai), on oxidative damage of homo sapiens bone marrow/stroma cell line (HS-5) caused by 5-fluorouracil (5-FU), and the effect of ASP relieving oxidative stress in HM on SIPS of hematopoietic cells. Tumor-suppressive doses of 5-FU inhibited the growth of HS-5 in a dose-dependent and time-dependent manner. 5-FU induced HS-5 apoptosis and also accumulated cellular hallmarks of senescence including cell cycle arrest and typical senescence-associated β-galactosidase positive staining. The intracellular reactive oxygen species (ROS) was increased in 5-FU treated HS-5 cells and coinstantaneous with attenuated antioxidant capacity marked by superoxide dismutase and glutathione peroxidase. Oxidative stress initiated DNA damage indicated by increased γH2AX and 8-OHdG. Oxidative damage of HS-5 cells resulted in declined hematopoietic stimulating factors including stem cell factor (SCF), stromal cell-derived factor (SDF), and granulocyte-macrophage colony-stimulating factor (GM-CSF), however, elevated inflammatory chemokines such as RANTES. In addition, gap junction channel protein expression and mediated intercellular communications were attenuated after 5-FU treatment. Significantly, co-culture on 5-FU treated HS-5 feeder layer resulted in less quantity of human umbilical cord blood-derived hematopoietic cells and CD34⁺ hematopoietic stem/progenitor cells (HSPCs), and SIPS of hematopoietic cells. However, it is noteworthy that ASP ameliorated SIPS of hematopoietic cells by the mechanism of protecting bone marrow stromal cells from chemotherapeutic injury via mitigating oxidative damage of stromal cells and improving their hematopoietic function. This study provides a new strategy to alleviate the complication of conventional cancer therapy using chemotherapeutic agents.
Keywords: 5-fluorouracil; Angelica sinensis polysaccharide; aging; bone marrow stromal cell; hematopoietic cell; oxidative stress.
Conflict of interest statement
The authors declare no conflict of interest.
Figures
Similar articles
-
[5-FU-Injured Bone Marrow Stromal Cells Initiate Stress-induced Premature Senescence of Hematopoietic Cells].Zhongguo Shi Yan Xue Ye Xue Za Zhi. 2017 Aug;25(4):1178-1186. doi: 10.7534/j.issn.1009-2137.2017.04.038. Zhongguo Shi Yan Xue Ye Xue Za Zhi. 2017. PMID: 28823289 Chinese.
-
Angelica sinensis polysaccharides alleviate the oxidative burden on hematopoietic cells by restoring 5-fluorouracil-induced oxidative damage in perivascular mesenchymal progenitor cells.Pharm Biol. 2023 Dec;61(1):768-778. doi: 10.1080/13880209.2023.2207592. Pharm Biol. 2023. PMID: 37148130 Free PMC article.
-
Angelica sinensis polysaccharides prevents hematopoietic regression in D-Galactose-Induced aging model via attenuation of oxidative stress in hematopoietic microenvironment.Mol Biol Rep. 2023 Jan;50(1):121-132. doi: 10.1007/s11033-022-07898-w. Epub 2022 Oct 31. Mol Biol Rep. 2023. PMID: 36315330
-
Extraction, structure, pharmacological activities and drug carrier applications of Angelica sinensis polysaccharide.Int J Biol Macromol. 2021 Jul 31;183:2337-2353. doi: 10.1016/j.ijbiomac.2021.05.213. Epub 2021 Jun 6. Int J Biol Macromol. 2021. PMID: 34090852 Review.
-
β3-Adrenoreceptors as ROS Balancer in Hematopoietic Stem Cell Transplantation.Int J Mol Sci. 2021 Mar 11;22(6):2835. doi: 10.3390/ijms22062835. Int J Mol Sci. 2021. PMID: 33799536 Free PMC article. Review.
Cited by
-
Nano-drug co-delivery system of natural active ingredients and chemotherapy drugs for cancer treatment: a review.Drug Deliv. 2022 Dec;29(1):2130-2161. doi: 10.1080/10717544.2022.2094498. Drug Deliv. 2022. PMID: 35815678 Free PMC article. Review.
-
Pharmacological Components and Mechanism Research on the Treatment of Myelosuppression after Chemotherapy with Danggui Jixueteng Decoction Based on Spectrum-Effect Relationships and Transcriptome Sequencing.ACS Omega. 2024 Jun 18;9(26):28926-28936. doi: 10.1021/acsomega.4c03641. eCollection 2024 Jul 2. ACS Omega. 2024. PMID: 38973888 Free PMC article.
-
Polysaccharide from Angelica Sinensis Suppresses Inflammation and Reverses Anemia in Complete Freund's Adjuvant-induced Rats.Curr Med Sci. 2020 Apr;40(2):265-274. doi: 10.1007/s11596-020-2183-3. Epub 2020 Apr 26. Curr Med Sci. 2020. PMID: 32337688
-
Angelica sinensis polysaccharide prevents mitochondrial apoptosis by regulating the Treg/Th17 ratio in aplastic anemia.BMC Complement Med Ther. 2020 Jun 22;20(1):192. doi: 10.1186/s12906-020-02995-4. BMC Complement Med Ther. 2020. Retraction in: BMC Complement Med Ther. 2022 Oct 20;22(1):277. doi: 10.1186/s12906-022-03752-5. PMID: 32571324 Free PMC article. Retracted.
-
Myelosuppression Alleviation and Hematopoietic Regeneration by Tetrahedral-Framework Nucleic-Acid Nanostructures Functionalized with Osteogenic Growth Peptide.Adv Sci (Weinh). 2022 Sep;9(27):e2202058. doi: 10.1002/advs.202202058. Epub 2022 Jul 26. Adv Sci (Weinh). 2022. PMID: 35882625 Free PMC article.
References
-
- Wickremasinghe R.G., Hoffbrand A.V. Biochemical and genetic control of apoptosis: Relevance to normal hematopoiesis and hematological malignancies. Blood. 1999;93:3587–3600. - PubMed
MeSH terms
Substances
LinkOut - more resources
Full Text Sources
Other Literature Sources
Medical
Miscellaneous
