. 2017 Nov 30;551(7682):585-589.
doi: 10.1038/nature24628. Epub 2017 Nov 15.

Salt-responsive gut commensal modulates TH17 axis and disease

Affiliations

Salt-responsive gut commensal modulates TH17 axis and disease

Nicola Wilck et al. Nature. .

Abstract

A Western lifestyle with high salt consumption can lead to hypertension and cardiovascular disease. High salt may additionally drive autoimmunity by inducing T helper 17 (TH17) cells, which can also contribute to hypertension. Induction of TH17 cells depends on gut microbiota; however, the effect of salt on the gut microbiome is unknown. Here we show that high salt intake affects the gut microbiome in mice, particularly by depleting Lactobacillus murinus. Consequently, treatment of mice with L. murinus prevented salt-induced aggravation of actively induced experimental autoimmune encephalomyelitis and salt-sensitive hypertension by modulating TH17 cells. In line with these findings, a moderate high-salt challenge in a pilot study in humans reduced intestinal survival of Lactobacillus spp., increased TH17 cells and increased blood pressure. Our results connect high salt intake to the gut-immune axis and highlight the gut microbiome as a potential therapeutic target to counteract salt-sensitive conditions.


Conflict of interest statement

Author Information The authors declare no competing financial interests.

Figures

Extended Data Figure 1
Extended Data Figure 1. Body weight, food, fluid and sodium chloride (NaCl) intake, and intestinal transit in mice fed a NSD or HSD.
Body weight (a), food intake (b), fluid intake (c), NaCl intake from the chow (d), NaCl intake from the drinking water (e) and total NaCl intake (f; sum of NaCl intake from chow and drinking water) in mice fed normal salt diet (NSD, n=8) or high salt diet (HSD, n=8). (g) Measurement of intestinal transit. FVB/N mice were fed NSD (n=8) or HSD (n=9) for 14 days and administered activated charcoal (0.5 g/10 ml in 0.5% methylcellulose; 0.1 ml/10 g body weight by oral gavage). Twenty minutes later mice were euthanized and the distance travelled by charcoal was measured. Bars show mean±s.e.m., circles represent individual mice. **p<0.01, ****p<0.001 using paired two-tailed Student‘s t test for (a-c), one-tailed Wilcoxon matched-pairs signed rank test for (d-f) and unpaired two-tailed Student‘s t test for (g).
Extended Data Figure 2
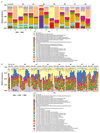
Extended Data Figure 2. Fecal microbiome profiles of mice kept on NSD or HSD over time.
Taxonomic bar charts showing relative abundance of RDP-based OTUs on indicated days. (a) Mice remaining on NSD for 14 days served as NSD controls. Baseline NSD day -1 and NSD day 14 are shown. (b) Separate mice were switched from NSD (days -2 and -1) to HSD for 14 days, and finally re-exposed to NSD for another 14 days (recovery). For time course analyses, fecal samples from baseline NSD days (-1 and -2), early (days 1-3) and late (day 14) HSD days and NSD recovery days (days 15-17, 19, 22, 28) are shown. n=8 mice per group.
Extended Data Figure 3
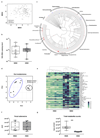
Extended Data Figure 3. HSD alters the fecal microbiome and the fecal metabolite profile.
(a) Mouse 16S rDNA fecal microbiome samples do not separate by diet in a MDS ordination (white, NSD samples; black, HSD samples; grey, recovery on NSD). (b) Real-time PCR on DNA extracted from fecal samples of mice fed NSD or HSD using universal 16S rDNA primers (n=8 fecal samples per group from independent mice, indicated by circles; two-tailed Wilcoxon matched-pairs signed rank test). (c) Phylogenetic tree showing changes in microbiome composition caused by HSD. OTUs present in samples from day 14 are indicated by colored circles (red indicates reduction in HSD samples; blue indicates enrichment). The circles’ radii indicate median log fold difference in relative abundance between the two diets. Filled circles mark statistically significant differences (two-tailed Student‘s t-test, Benjamini-Hochberg correction, p<0.05). (d-g) High dietary salt strongly influences the fecal metabolite profile. Male FVB/N mice (n=8) were fed a NSD and then switched to HSD. Metabolites were extracted from fecal pellets taken under NSD (day -3) and HSD (day 13), and analyzed by gas-chromatography mass-spectrometry. (d) HSD samples are clearly distinguishable from NSD samples in a principal component analysis for fecal metabolites. (e) Fecal metabolites clearly cluster by treatment. The majority of fecal metabolites are reduced by HSD. Hierarchically clustered heatmap, metabolites shown in alphabetical order. Metabolites were normalized by subtracting the minimum and dividing by the maximum value across all mice. (f) Fecal levels of the nucleoside adenosine were similar in both diets, suggesting that the change in metabolites is not due to a decrease in overall bacterial biomass. (g) HSD leads to a reduction in total metabolite peak intensities in fecal samples. **p<0.01 two-tailed paired Student‘s t-test for (f, g).
Extended Data Figure 4
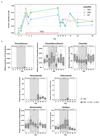
Extended Data Figure 4. Accuracy of AdaBoost and Random Forest classifiers.
(a) AdaBoost and random forest classifiers (trained on samples from days -2, -1, and 14) were used to predict the classification of all samples from HSD mice. The fraction of samples from each time point that the classifiers predicted as belonging to animals currently on a HSD is shown. The two runs of the random forest produced the same fractions, so only one line is shown for the two random forest classifiers. (b) Time series for the other remaining 7 OTUs important to the classifier. NSD and HSD phases are indicated by white and grey backgrounds. Mice (n=12) were switched from NSD to HSD and back to NSD (subgroup of n=8). Other control mice (n=8) remaining on NSD shown in white. Boxplots: median, IQR, whiskers 1.5*IQR, circles represent samples from independent mice.
Extended Data Figure 5
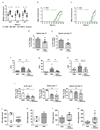
Extended Data Figure 5. L. murinus genome and in vitro growth of Lactobacilli.
(a) Venn diagram of the coding sequences present in the L. murinus and two other isolates with available with full genome sequences. (b) Bootstrapped phylogenetic tree of full-length 16S rDNA from a variety of Lactobacillus species resident to rodent or human guts. Prevalence of the respective species in the MetaHIT cohort is shown. L. murinus strains are absent in the MetaHIT cohort. (c) Growth yield (OD600) of L. murinus measured at increasing concentrations of NaCl. Aerobic endpoint measurements of liquid L. murinus cultures in MRS medium and increasing NaCl concentrations relative to growth in MRS without the addition of NaCl. n=5 independent experiments. (d) Anaerobic growth yield of L. murinus, A. muciniphila, P. excrementihominis, and C. difficile grown at 37 °C for 48 hours in MGAM liquid medium. Growth at each salt concentration is normalized to growth at 0.086 M Na+. The respective IC50 is indicated. n=3 technical replicates across 2 experiments. (e) Anaerobic growth of selected human Lactobacilli in MGAM medium with increasing NaCl concentrations. Relative growth yield is calculated based on AUCs by comparing to growth in MGAM without the addition of NaCl. n=3 independent experiments with 3 technical replicates. (f) Heatmap showing data as in (e). The respective IC50 is shown in the bottom row. (g) Growth yield of E. coli and L. murinus, grown at 37 °C for 12-16 hours on LB (E.coli) or MRS broth (L. murinus). n=4 technical replicates from two independent experiments. Mean±s.e.m.
Extended Data Figure 6
Extended Data Figure 6. Indole metabolites in murine fecal samples.
(a) Effect of HSD on fecal indole-3 acetic acid (IAA) and (b) indole-3 carboxaldehyde (IAld) content in FVB/N mice fed a NSD or HSD (n=12 per group in b; n=13 per group in c). (c-d) Germ-free (GF) mice monocolonized with L. murinus showed increased fecal IAA and IAld content (n=8 per group). *p<0.05 using one-tailed Wilcoxon matched-pairs signed rank test for (a-b), ****p<0.0001 using one-tailed Mann-Whitney U test for (c) and ****p<0.0001 using unpaired one-tailed Student’s t-test for (d). n represents independent mice.
Extended Data Figure 7
Extended Data Figure 7. The effect of Lactobacilli on actively-induced EAE.
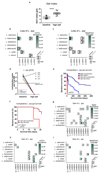
(a) Median cumulative clinical EAE scores at day 15, 16 and 17 post immunization (p.i.) of NSD (n=9), HSD (n=11) and HSD mice treated with L. murinus (n=6) starting at the day of immunization. Kruskal-Wallis followed by Dunn's multiple comparisons test *p<0.05, **p<0.01, ***p<0.001. n represents independent mice, indicated by circles. (b) Clinical course of MOG35-55 EAE in NSD mice (black circles, n=7) and NSD mice treated with L. murinus (green squares, n=4. Mean±s.e.m.). *p<0.05 using two-tailed Mann-Whitney U test. (c) Clinical course of MOG35-55 EAE in HSD mice (black circles) and HSD mice treated with L. reuteri (green squares, n=6 independent mice per group, mean±s.e.m.). *p<0.05 using two-tailed Mann-Whitney U test. (d-e) Quantification for CD4+IL-17A+IFN-γ- cells on day 17 of EAE in the spleen (d) and spinal cord (e). n=4 independent mice per group. Mean±s.e.m. *p<0.05 one-tailed Mann-Whitney U test. (f-h) Spinal cords on day 17 of EAE were analyzed by real-time RT-PCR for relative expression of Il17a (f, n=7 for NSD, n=6 for HSD and n=5 for HSD+L. murinus), Rorc (g, n=5 for NSD, n=6 for HSD and n=5 for HSD+L. murinus) and Csf2 (h, n=8 for NSD, n=6 for HSD and n=4 for HSD+L. murinus). Mean±s.e.m. *p<0.05, **p<0.01 using one-way ANOVA followed by Tukey’s post-hoc test. (i) Quantification of IFN-γ-producing TH1 cells in siLPL on day 3 of EAE (n=4 per group) and quantification of IFN-γ producing TH1 cells in spleen (n=4 per group) and spinal cord on day 17 of EAE (n=5 for NSD, n=6 for HSD and n=5 for HSD+L. murinus). n indicates number of independent mice per group. Mean±s.e.m. ns=not significant by one-way ANOVA. (j-m) Fecal indole metabolites were determined in MOG35-55 EAE mice by LC-MS/MS analysis. Effect of HSD on fecal IAA (j) and IAld (k) content on day 10 p.i. (n=5 per group for j, n=4 for NSD and n=5 for HSD in k). Fecal IAA (l) and IAld (m) content in MOG35-55 EAE mice fed HSD with or without concomitant L. murinus treatment on day 10 p.i. (n=7 per group for l, n=8 for HSD and n=7 for HSD+L. murinus for m). *p<0.05 using unpaired one-tailed Student’s t-test for (j and l-m) and one-tailed Wilcoxon matched-pairs signed rank test for (k). n indicates number of independent mice per group.
Extended Data Figure 8
Extended Data Figure 8. Actively-induced EAE in gnotobiotic mice.
(a, b) HSD fails to induce intestinal TH17 cells in germ-free MOG35-55 EAE mice (n=5 for GF+NSD and n=6 for GF+HSD). (a) Analysis of IL-17A and IFN-γ in CD4+ siLPL isolated from NSD or HSD-fed MOG35-55 immunized germ-free mice (day 3 p.i.). Representative flow cytometry plots (left) show one mouse per group. Quantifications show frequencies of CD4+IL-17A+IFN-γ- (middle) and CD4+IL-17A+IFN-γ+ (right) cells and (b) CD4+ RORγt+ frequencies in siLPL. (c-d) L. murinus reduces small intestinal (siLPL) and colonic (cLPL) lamina propria TH17 cells in EAE mice colonized with segmented filamentous bacteria (SFB). MOG35-55 EAE was induced in GF mice monocolonized with SFB (GF+SFB) and GF mice colonized with SFB and L. murinus (GF+SFB+L. murinus). LPL were isolated on day 3 p.i. (c) Left panel shows representative flow cytometry plots demonstrating IL-17A and IFN-γ expression in CD4+ siLPL (one mouse per group). Middle panel shows quantification of CD4+IL-17A+IFN-γ- siLPL (n=9 for GF+SFB, n=8 for GF+SFB+L. murinus). Right panel shows quantification of CD4+RORγt+ siLPL (n=9 mice per group). (d) Left panel shows representative flow cytometry plots (one mouse per group) depicting IL-17A and IFN-γ expression in CD4+ cLPL. Middle and right panel show quantification of CD4+IL-17A+IFN-γ- (n=8 for GF+SFB, n=9 for GF+SFB+L. murinus) and CD4+ IL-17A+IFN-γ+ cLPL (n=8 per group). All bar graphs show mean±s.e.m, circles represent independent mice. *p<0.05, ***p<0.001 unpaired one-tailed Student’s t-test for (a-d).
Extended Data Figure 9
Extended Data Figure 9. Treatment with L. murinus or L. reuteri ameliorates salt-sensitive hypertension.
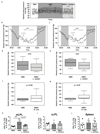
(a) Mean diastolic pressures over time in response to HSD and HSD with concomitant L. murinus treatment in n=7 FVB/N mice. Scale bar indicates 24 hours. Horizontal line indicates the mean across all values of the respective phase. (b, c) Mean systolic (b) and diastolic (c) blood pressures in these mice (n=7) fed a HSD (black curve) and HSD with concomitant L. murinus treatment at circadian scale. Arrows indicate the time of L. murinus gavage. (d, e) Boxplots (median, IQR, whiskers 1.5*IQR) show systolic (d) and diastolic (e) blood pressures recorded continuously in FVB/N mice fed a HSD and a HSD with concomitant L. reuteri treatment. These mice (n=9) were fed a HSD for 10 days prior to concomitant L. reuteri treatment for another 7 days. ***p<0.001 vs. HSD using linear mixed model. (f, g) Boxplots (median, IQR, whiskers 1.5*IQR) show systolic (f) and diastolic (g) blood pressures in mice (n=5) fed a HSD and a HSD with concomitant Escherichia coli Nissle 1917 (E. coli) treatment for 3 days, respectively. Statistics using linear mixed model. (h-j) Quantification of CD4+IL-17A-IFN-γ+ lymphocytes in siLPL (h, n=5 for NSD, n=7 for HSD, n=6 for HSD+L. murinus) and cLPL and spleen, respectively (i-j, n=5 for NSD, n=6 for HSD, n=6 for HSD+L. murinus). All bars show mean±s.e.m, circles represent independent mice. *p<0.05 using Kruskal-Wallis and Dunn’s post-hoc test for (h), one-way ANOVA for (i-j).
Extended Data Figure 10
Extended Data Figure 10. High salt challenge in healthy human subjects.
(a) Total salt intake according to dietary records (n=12, paired one-tailed t-test). (b, c) Metagenome analysis shows loss of Lactobacillus gut populations during human high salt challenge. Shown are all subjects (horizontal axis) for which gut Lactobacilli were detected at baseline and all species so detected (vertical axis) using the mOTU (b) or MetaPhlAn framework (c) for bacterial species identification. Heatmap cells show abundance for mOTU (insert counts as fraction of sample total) or average coverage (reads per position) for MetaPhlAn of these Lactobacilli at baseline (left part of cells, black border) and after high salt challenge (right part of cells, grey border). Cross markers show complete loss (nondetection after high salt challenge) of each species. In all cases but one (shown), baseline Lactobacillus populations are no longer detected post high salt. (d) qPCR using Lactobacillus-specific 16S rDNA primers in human fecal samples positive for Lactobacillus at baseline show a loss of the respective species after 14 days of high salt. Lactobacillus 16S rDNA copy number in 4 ng fecal DNA is shown. Symbols indicate study subject, colors indicate respective Lactobacillus species. (e) Kaplan-Meier survival curves contrasting the fate of gut Lactobacillus populations (detected using the mOTU framework) following high salt challenge (bright red curve) and in healthy control individuals from reference cohorts (n=121, see methods) not undergoing any intervention (bright blue curve). This is compared with corresponding survival curves over time for the set of all other detected gut bacterial species following high salt challenge (high salt-others, dark red curve) and without such challenge in controls (NSD-others, dark blue curve). (f) For a clearer view of its time range only the salt intervention curves from (e) are shown. Two observations are clear. First, Lactobacillus on average persist for shorter times in the gut than the average over all other species. Second, a high salt challenge strongly increases gut loss of both Lactobacillus and non-Lactobacillus species. As such, in combination, Lactobacillus loss is highly pronounced under high salt intervention and significantly (p<1.62e-8) faster than the average over all species. (g-i) Metagenome analysis shows introduction of novel Lactobacillus gut populations during human high salt challenge. Shown are all subjects (horizontal axis) for which gut Lactobacilli were detected following high salt challenge, and all species so detected (vertical axis) using the SpecI (g), mOTU (h) or MetaPhlAn (i). Heatmap cells show abundance (insert counts as fraction of sample total for SpecI and mOTU) and average coverage (reads per position for MetaPhlAn) of these Lactobacilli at baseline (left part of cells, black border) and after high salt challenge (right part of cells, gray border). Cross markers show novel introduction (nondetection at baseline) of each species.
Figure 1
Figure 1. HSD alters the fecal microbiome and depletes Lactobacillus in mice.
(a) AdaBoost identified eight 16S rDNA OTUs distinguishing NSD from HSD samples. (b) Classifier accuracy per mouse and diet. (c) Relative OTU abundances on HSD day 14 (n=12 mice, n=8 NSD control mice). (d) Lactobacillus abundance over time. Samples >1% not shown. Boxplots: IQR, whiskers 1.5*IQR. (e, f) L. murinus qPCR (n=8 mice). **p<0.01, ***p<0.001 paired two-tailed t-test. (g) Fecal indole-3-lactic acid (ILA), n=12 mice per group. *p<0.05, Wilcoxon signed-rank test. (h) Fecal ILA in gnotobiotic mice (n=8 germ-free, n=7 L. murinus-monocolonized mice). ****p<0.0001 unpaired two-tailed t-test.
Figure 2
Figure 2. L. murinus prevents HSD-induced exacerbation of EAE and reduces TH17 cells.
(a) Mean disease scores±s.e.m. of MOG35-55-EAE mice fed NSD (n=9), HSD (n=11), or HSD with L. murinus (n=6). (b) siLPL (day 3 p.i.) analyzed for CD4+ IL-17A+ IFN-γ- cells (n=4). (c, d) Spleens (n=5) and spinal cords (NSD n=4; HSD n=6; HSD+L. murinus n=5, day 17 p.i.) were similarly analyzed. Representative plots, quantification to the right. Mean±s.e.m., circles represent individual mice. *p<0.05, **p<0.01 by one-way ANOVA and post-hoc Tukey’s for (c), Kruskal-Wallis and Dunn’s post-hoc test for (a, b, d). n equals mice per group.
Figure 3
Figure 3. Putative role for ILA.
(a) HSD reduces fecal ILA in MOG35-55-EAE mice (n=5), day 10 p.i. (b) Fecal ILA in HSD+L. murinus treated (n=6) vs. HSD-fed MOG35-55-EAE mice (n=8), day 10 p.i. Circles represent samples from individual mice. *p<0.05 using unpaired one-tailed t-test for (a); Mann-Whitney U test for (b). (c) Naïve murine CD4+ T cells cultured under TH17-polarizing conditions in presence (+ILA) or absence (+vehicle) of ILA, analyzed for IL-17A (n=3 replicates per group, mean±s.e.m., one representative out of two independent experiments is shown). ***p<0.001 vs. vehicle using one-way ANOVA and Tukey's post-hoc test.
Figure 4
Figure 4. L. murinus ameliorates salt-sensitive hypertension and reduces TH17 cells.
Continuous blood pressure recordings in n=7 FVB/N mice. (a) Mean systolic pressures over time and (b) systolic and diastolic pressures as boxplots (IQR, whiskers 1.5*IQR). ###p<0.001 vs. NSD, ***p<0.001 vs. HSD (linear mixed model). (c) CD4+RORγt+ siLPL in mice fed NSD (n=7), HSD (n=8) or HSD+L. murinus (n=9). (d-f) CD4+IL-17A+IFN-γ- siLPL, cLPL, splenocytes in mice fed NSD (n=5), HSD (n=6; siLPL n=7) and HSD+L. murinus (n=6; siLPL n=5). Representative plots per group, quantification showing mean±s.e.m., circles represent individual mice. *p<0.05, **p<0.01, one-way ANOVA and post-hoc Tukey’s (c, e, f), Kruskal-Wallis and post-hoc Dunn’s (d).
Figure 5
Figure 5. High salt challenge affects blood pressure, TH17 cells and Lactobacilli in healthy humans.
(a) Mean nocturnal systolic and diastolic blood pressures and (b) IL-17A+TNF-α+ cells in CD4+ enriched PBMC (one representative subject is shown) in n=8 males at baseline and after challenge. *p<0.05, **p<0.01, ****p<0.0001, paired one-tailed t-test (a) and Wilcoxon signed-rank test (b). (c) Loss of Lactobacilli after high salt challenge. Subjects positive for Lactobacilli at baseline are shown. Split cells show abundance at baseline (left) and after high salt (right), crosses indicate nondetection. (d) Kaplan-Meier curves comparing the persistence of Lactobacilli to control cohorts (log-rank test).

Comment in

Similar articles

Cited by

References

    1. Manzel A, et al. Role of "Western diet" in inflammatory autoimmune diseases. Current allergy and asthma reports. 2014;14:404. doi: 10.1007/s11882-013-0404-6. - DOI - PMC - PubMed
    1. O'Donnell M, et al. Urinary sodium and potassium excretion, mortality, and cardiovascular events. The New England journal of medicine. 2014;371:612–623. doi: 10.1056/NEJMoa1311889. - DOI - PubMed
    1. Weber MA, et al. Clinical practice guidelines for the management of hypertension in the community a statement by the American Society of Hypertension and the International Society of Hypertension. Journal of hypertension. 2014;32:3–15. doi: 10.1097/HJH.0000000000000065. - DOI - PubMed
    1. Taylor J. 2013 ESH/ESC guidelines for the management of arterial hypertension. European heart journal. 2013;34:2108–2109. - PubMed
    1. Mozaffarian D, et al. Global sodium consumption and death from cardiovascular causes. The New England journal of medicine. 2014;371:624–634. doi: 10.1056/NEJMoa1304127. - DOI - PubMed

Publication types

MeSH terms