Review
. 2018 Feb;91(1083):20170573.
doi: 10.1259/bjr.20170573. Epub 2017 Dec 11.

Imaging assessment of acute ischaemic stroke: a review of radiological methods

Affiliations
Review

Imaging assessment of acute ischaemic stroke: a review of radiological methods

Aubrey George Smith et al. Br J Radiol. 2018 Feb.

Abstract

Acute ischaemic stroke is the second largest cause of death worldwide and a cause of major physical and psychological morbidity. Current evidence based treatment includes intravenous thrombolysis (IVT) and mechanical thrombectomy (MT), both requiring careful patient selection and to be administered as quickly as possible within a limited time window from symptom onset. Imaging plays a crucial role identifying patients who may benefit from MT or IVT whilst excluding those that may be harmed. For IVT, imaging must as a minimum exclude haemorrhage, stroke mimics and provide an estimate of non-viable brain. For MT, imaging must in addition detect and characterize intra-arterial thrombus and assess the intra and extracranial arterial architecture. More advanced imaging techniques may be used to assess more accurately the volume of non-viable and potentially salvageable brain tissue. It is highly likely that further research will identify patients who would benefit from treatment beyond currently accepted time windows for IVT (4.5 h) and MT (6 h) and patients with an unknown time of symptom onset. Current evidence indicates that best outcomes are achieved when treatment is instituted as soon as possible after symptom onset. A rapid, efficient imaging pathway including interpretation is fundamental to achieving the best outcomes. This review summarizes current techniques for imaging assessment of acute stroke, highlighting strengths and limitations of each. The optimum pathway is a balance between diagnostic information, local resources, specialization and the time taken to acquire, process and interpret the data. As new evidence emerges, it is likely that the minimum required imaging data will change.


Figures
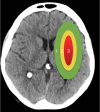
Figure 1.
Figure 1.
The three-compartment model of cerebral ischaemia. 1 = oligaemia, parenchyma that is likely to survive, 2 = ischaemic penumbra, parenchyma that is at risk of infarction without intervention, 3 = ischaemic core, parenchyma that is non-viable.
Figure 2.
Figure 2.
Hyperacute stroke trials listing treatment and imaging protocols used. CTA, CT angiography; DWI, diffusion-weighted imaging; PWI, perfusion-weighted imaging.
Figure 3.
Figure 3.
Unenhanced CT. (a) Demonstrates a right MCA territory infarct with loss of differentiation of the caudate and lentiform nuclei and the insula ribbon (Star). There is swelling with overlying sulcal effacement. (b) Demonstrates haemorrhagic transformation of the right MCA territory infarct in the same patient (Arrow), a complication of large territory infarction.
Figure 4.
Figure 4.
(a) (5-mm slices) Fails to demonstrate the proximal right sylvian M2 thrombus observed on (b) (Arrow) (0.5-mm slices) showing the importance of thin slice review.
Figure 5.
Figure 5.
The 10 Territories identified in ASPECTS. Ischaemia in one of these regions leads to a one point reduction in the score. ASPECTS, Alberta Stroke Program Early CT Score.
Figure 6.
Figure 6.
MCA dot sign—small focus of high density in the sylvian branch of the right MCA representing acute thrombus (arrow) (0.5 mm slices, unenchanced CT).
Figure 7.
Figure 7.
CT angiography with thick slice coronal (a) and sagittal (b) reformatted images demonstrating thrombus of the right MCA and occlusion in the right extracranial ICA, respectively. The patient was treated successfully with mechanical thrombectomy and stenting of the occluded ICA.
Figure 8.
Figure 8.
Patient (a) has a left MCA thrombus with complete occlusion. Delayed multiphase imaging shows good collaterals, which was not shown on single-phase imaging alone. The patient underwent thrombectomy and had a good recovery. Patient (b) has a small distal MCA thrombus. Multiphase imaging demonstrates delayed washout of contrast in the left MCA territory aiding the detection and localization of thrombus. The patient was treated with i.v. tPA and made a good functional recovery.
Figure 9.
Figure 9.
A single example of a scoring system that has demonstrated good interobserver agreement in the analysis of collaterals using CT angiography.
Figure 10.
Figure 10.
A 65-year-old male with right-sided weakness. (a) Demonstrates loss of grey white matter differentiation and cortical swelling involving the left anterior MCA territory. There is a mismatch between the CBF (b) and CBV (c) with an overall increase in MTT (d) suggesting there is ischaemic penumbra that would benefit from revascularization. (Image courtesy of Dr D Scoffings). CBF, cerebral blood flow; MTT, mean transit time.
Figure 11.
Figure 11.
MRI of left PICA territory infarct (a) High FLAIR signal clearly identifies the region of oedema related to the infarct. (b) ADC map and (c) DWI demonstrates restricted diffusion confirming the acute nature of the pathology. (d) Sagittal T2 demonstrates high signal. (e) Gradient echo sequences demonstrates low signal confirming the presence of haemorrhage. ADC, apparent diffusioncoefficient; DWI, Diffusion-weighted imaging; FLAIR, fluid attenuated inversion recovery; Posterior Inferior Cerebellar Artery.
Figure 12.
Figure 12.
There are multiple infarcts in the left cerebellar hemisphere as demonstrated on FLAIR (a) and DWI (b). Further investigation with TOF MRA demonstrates a dissection of the left vertebral artery (Arrow). DWI, Diffusion-weighted imaging; FLAIR, fluid attenuated inversion recovery, TOF, time-of-flight.

References

    1. Stroke Association. State of the nation Stroke statistics – January 2016. 2017. Available from: https://www.stroke.org.uk/sites/default/files/state_of_the_nation_2017_f...
    1. World Health Organisation. The top 10 causes of death Worldwide - 2015. 2017. Available from: http://www.who.int/mediacentre/factsheets/fs310/en/ [updated January 2017]
    1. Luengo-Fernandez R, Gray AM, Bull L, Welch S, Cuthbertson F, Rothwell PM. Quality of life after TIA and stroke: ten-year results of the Oxford vascular study. Neurology 2013; 81: 1588–95. doi: https://doi.org/10.1212/WNL.0b013e3182a9f45f - DOI - PMC - PubMed
    1. Somford DM, Nederkoorn PJ, Rutgers DR, Kappelle LJ, Mali WP, van der Grond J. Proximal and distal hyperattenuating middle cerebral artery signs at CT: different prognostic implications. Radiology 2002; 223: 667–71. doi: https://doi.org/10.1148/radiol.2233011017 - DOI - PubMed
    1. National Institute of Neurological Disorders and Stroke rt-PA Stroke Study Group. Tissue plasminogen activator for acute ischemic stroke. N Engl J Med 1995; 333: 1581–7. doi: https://doi.org/10.1056/NEJM199512143332401 - DOI - PubMed