. 2017 Nov 16;551(7680):394-397.
doi: 10.1038/nature24490. Epub 2017 Nov 8.

Structure and assembly of the Ebola virus nucleocapsid

Affiliations

Structure and assembly of the Ebola virus nucleocapsid

William Wan et al. Nature. .

Abstract

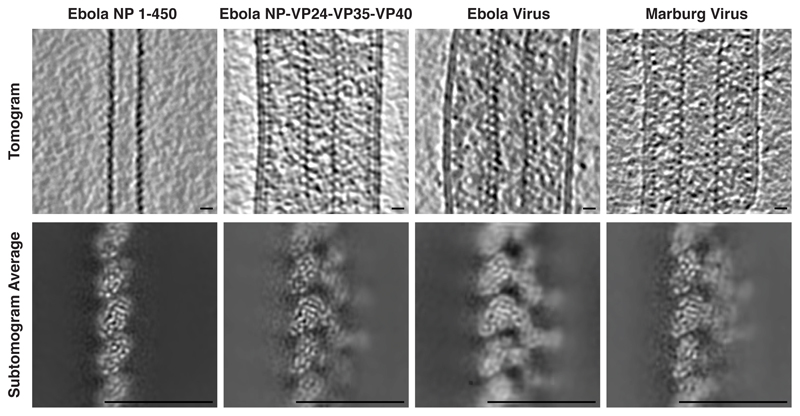
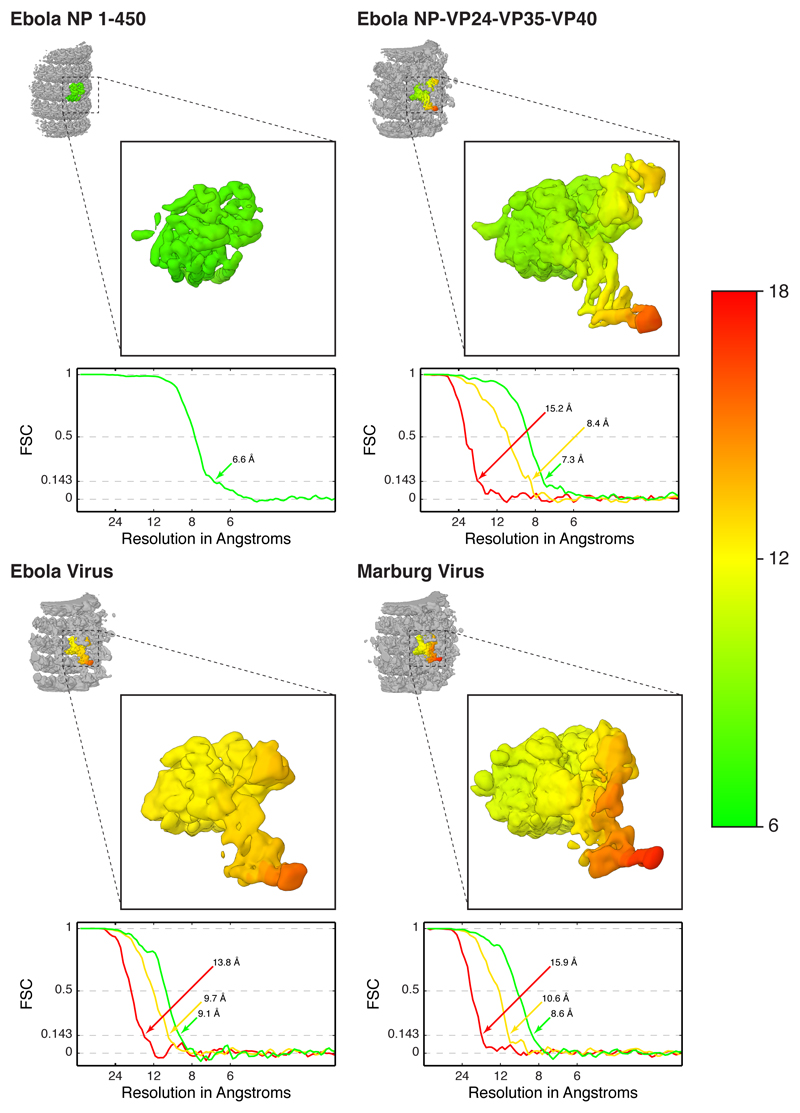
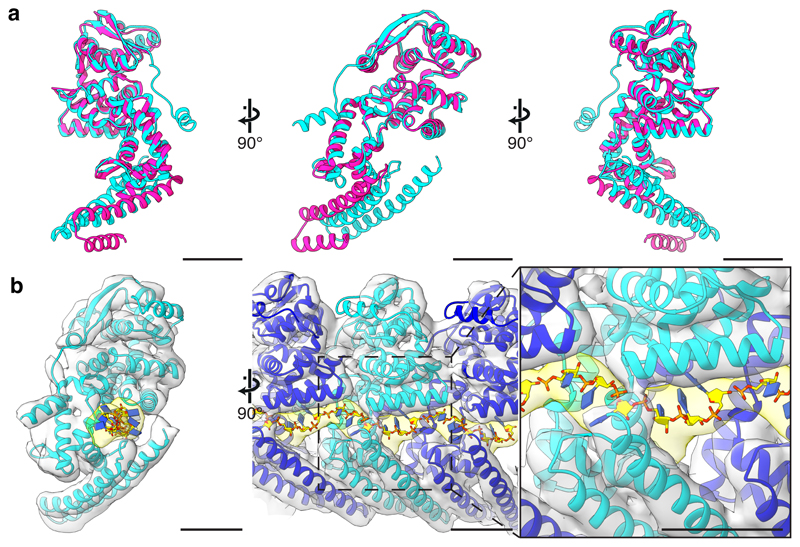
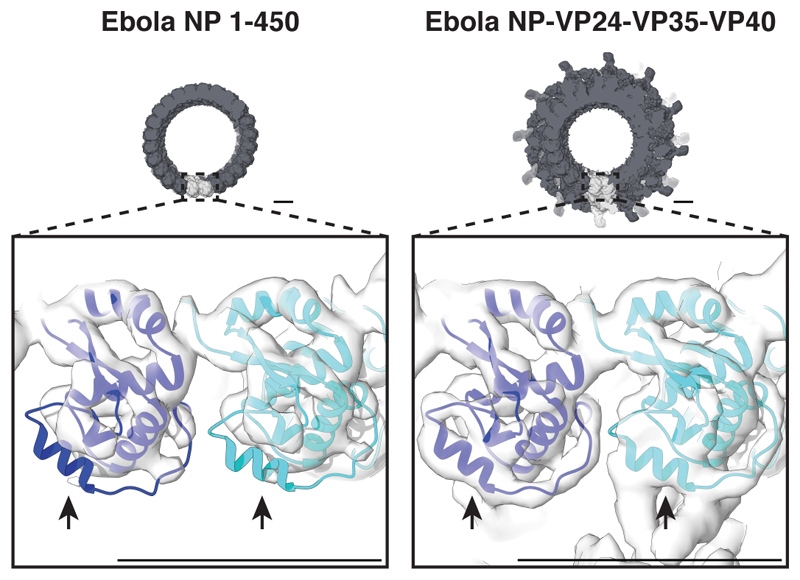
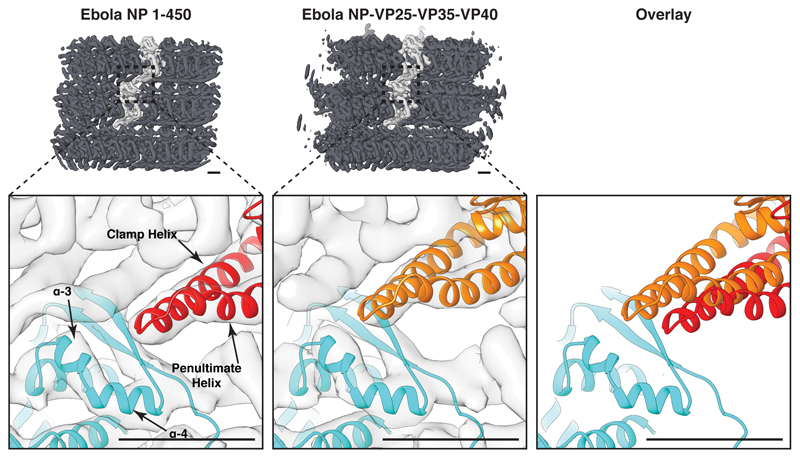
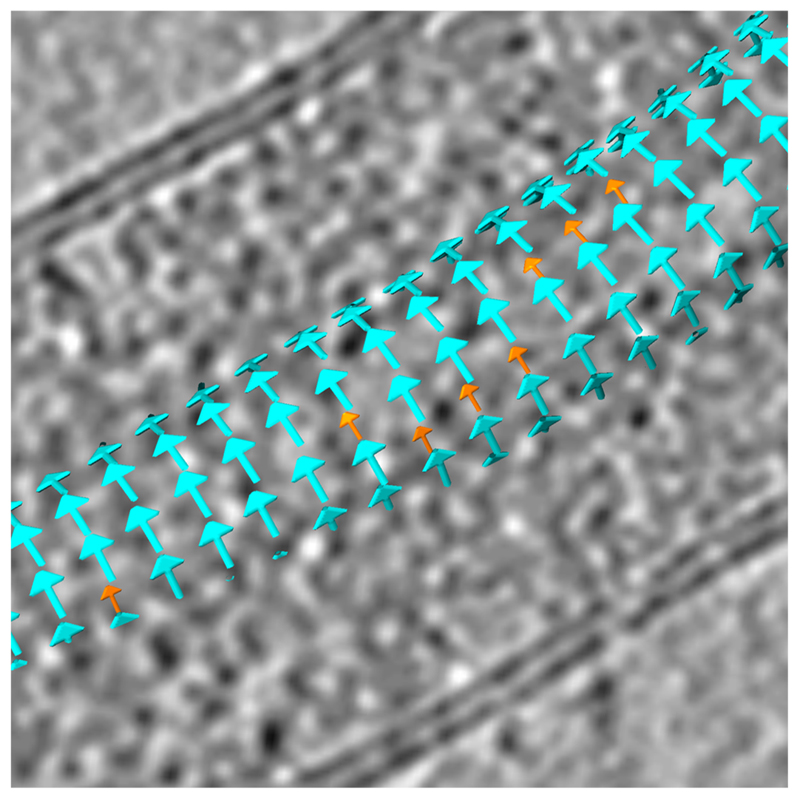
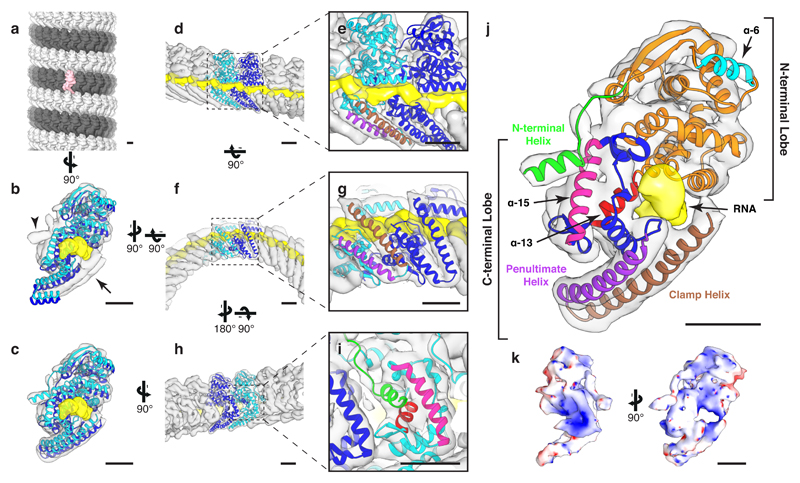
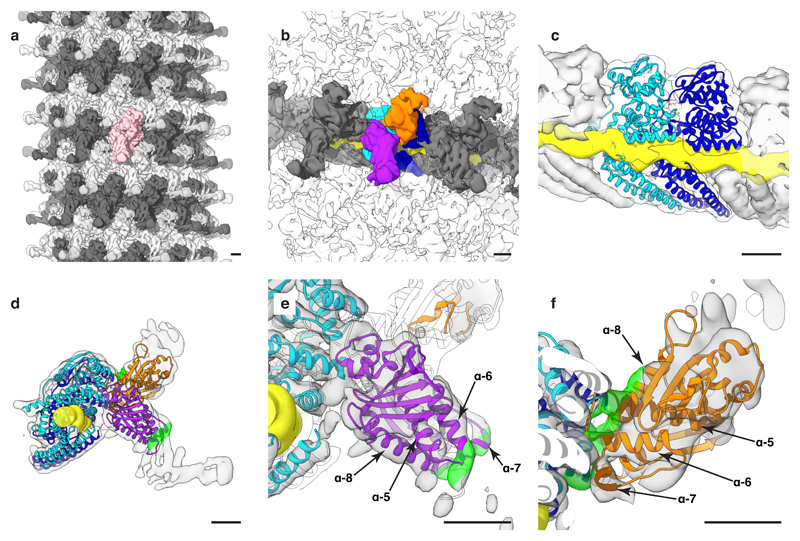
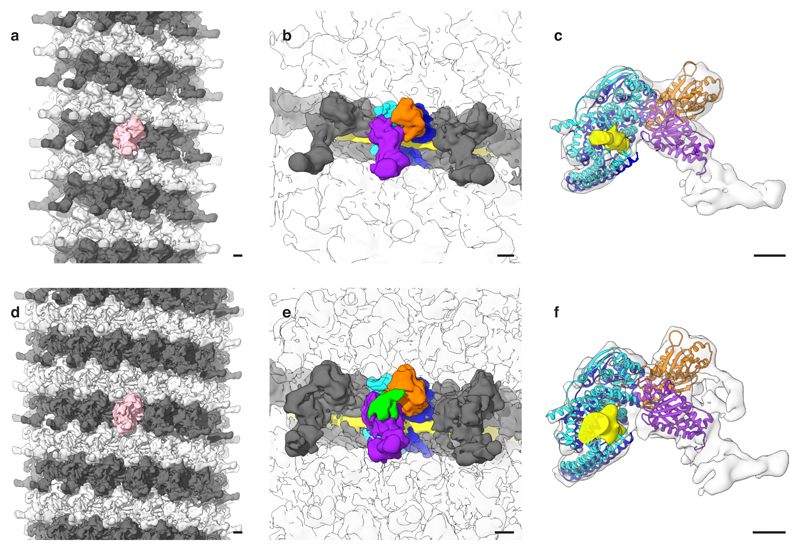
Ebola and Marburg viruses are filoviruses: filamentous, enveloped viruses that cause haemorrhagic fever. Filoviruses are within the order Mononegavirales, which also includes rabies virus, measles virus, and respiratory syncytial virus. Mononegaviruses have non-segmented, single-stranded negative-sense RNA genomes that are encapsidated by nucleoprotein and other viral proteins to form a helical nucleocapsid. The nucleocapsid acts as a scaffold for virus assembly and as a template for genome transcription and replication. Insights into nucleoprotein-nucleoprotein interactions have been derived from structural studies of oligomerized, RNA-encapsidating nucleoprotein, and cryo-electron microscopy of nucleocapsid or nucleocapsid-like structures. There have been no high-resolution reconstructions of complete mononegavirus nucleocapsids. Here we apply cryo-electron tomography and subtomogram averaging to determine the structure of Ebola virus nucleocapsid within intact viruses and recombinant nucleocapsid-like assemblies. These structures reveal the identity and arrangement of the nucleocapsid components, and suggest that the formation of an extended α-helix from the disordered carboxy-terminal region of nucleoprotein-core links nucleoprotein oligomerization, nucleocapsid condensation, RNA encapsidation, and accessory protein recruitment.


Conflict of interest statement

The authors declare no competing financial interests.

Figures

Extended Data Figure 1
Extended Data Figure 1. Representative orthoslices of tomograms and subtomogram averages.
Top row shows orthoslices through the middle of representative tomograms of the NC and NC-like assemblies. Bottom row shows orthoslices taken through the structures determined by subtomogram averaging. The inside of the NC helix is on the left. Scale bars indicate 20 nm.
Extended Data Figure 2
Extended Data Figure 2. Local resolution maps and FSCs of NC and NC-like assemblies.
In each panel, the small inset shows the full subtomogram averaging structure of part of the helix with a central subunit colored. Subtomogram averaging maps are locally filtered and sharpened. The isolated central subunits are shown zoomed in. The surface is colored according to local resolution in Å, as defined by the colormap on the right. FSC curves are calculated using cylindrical masks, with a circular cross section of approximately one viral subunit (2 NPs and outer protrusions) and height centered at each protein layer; green is for NP core, yellow is for VP24 layer, and red is for outer unassigned density layer. In general, the NP-core has high, homogeneous resolutions while outer subunits have decreasing resolution with respect to their distance from NP core.
Extended Data Figure 3
Extended Data Figure 3. Model of NP from subtomogram averaging compared to NP crystal structure and with modeled RNA.
a, different views of the subtomogram averaging derived NP model (cyan) and the NP crystal structure (pink, PDB: 4YPI). Left is a view from inside the NC helix, center is a cross-sectional view of the NC, and right is a view from outside the NC. b, the NP model in the EM density from our NP 1–450 subtomogram averaging structure. Left shows a cross-sectional view of NC. In the RNA density (yellow), is a rigid-body fit of the 6 nucleotide RNA segment from measles virus NP (PDB: 4UFT). In the center and right panels, three NP-RNA models from the left panel are fitted as rigid bodies. Center is a view from the outside of the NC, and right is a focused view of the RNA density. Scale bars indicate 20 Å.
Extended Data Figure 4
Extended Data Figure 4. Sequence and secondary structure of NP model.
Our NP model contains NP residues 16 – 405. Secondary structure elements are highlighted and colored according to Fig. 1j. Secondary structure labels follow that of crystal structure 4YPI.
Extended Data Figure 5
Extended Data Figure 5. Comparison of mononegavirus NPs and encapsidated RNA.
Each row shows two views of each NP: left is a cross-sectional view of the NC, with the center of the NC axis to the left, right is a view of the NP from outside the NC. Scale bar indicates 20 Å.
Extended Data Figure 6
Extended Data Figure 6. Global fit of Ebola crystal structures into the subtomogram averaging structure of Ebola NP-VP24-VP35-VP40 NC-like assembly.
Left column shows histograms for random rigid-body fits. Coloured arrows identify the fits illustrated in the other columns. Second column shows top two scoring fits within the targeted density. Last two columns show detailed views of the highest and second highest scoring fits, respectively. a, fits into the full outer densities, densities are shown at 1.5 σ, except the detailed view of the VP24 fits which are shown at 2.5 σ. The fits of VP24 are high scoring outliers indicating correct fits, and are those shown in Fig 2. b, fits into the VP24-subtracted outer protrusion densities; densities are shown at 1.2 σ.
Extended Data Figure 7
Extended Data Figure 7. Stabilization of NP helix 6 upon outer protein binding.
Top of each panel shows cross section of NC-like structures. In light grey are two NC subunits. Lower panel shows a detailed view of the two NC subunits with molecular models fitted. Helix 6 (arrow) in NP 1-450 shows nearly no density while in NP-VP24-VP35-VP40, binding of VP24 stabilizes this helix. Scale bars indicate 50 Å.
Extended Data Figure 8
Extended Data Figure 8. Different inter-rung contacts between Ebola NP 1–450 and NP-VP24-VP35-VP40.
Top row shows part of the helix viewed from the inside. Subunits on adjacent rungs are highlighted in grey; these correspond to the subunits fitted by the NP models on the bottom rows. The relative positions of NP molecules across the inter-rung contact differ by 8.3 Å. Scale bars indicate 20 Å.
Extended Data Figure 9
Extended Data Figure 9. Lattice map revealing the helical symmetry of Ebola NC.
Cyan arrows denote the positions of one asymmetric unit (two copies of NP, each of which has VP24 bound in a different orientation), as determined by subtomogram averaging. Orange arrows denote positions where a single NP subunit is present that disrupts the normal alternating arrangement of VP24 binding position. Single-NP subunits often appear on consecutive rungs along higher-order helical symmetries, forming “seams” along the NC helix. This suggests that VP24 binding is not only influenced by the neighbouring subunits along the NP helix, but also by neighbouring subunits on adjacent rungs.
Figure 1
Figure 1. Structure of Ebola NP 1–450.
a, The structure of an NP 1–450 helix, visualized by placing the structure of the subunit at the positions and orientations determined by subtomogram averaging. For ease of visualization, adjacent rungs are colored dark and light grey; a single subunit is highlighted in pink. In (b – j), structure of the NP 1-450 helix determined by subtomogram averaging (grey isosurface, putative RNA density in yellow) fitted with models of consecutive NP subunits colored in cyan and blue. b, crystal structure (4YPI) and c, our model fit into density map. Arrowhead indicates empty density corresponding to the N-terminal helix, arrow indicates empty density corresponding to the clamp-helix. All remaining panels use our NP model from c. d, wide and e, focused outer view of the RNA encapsidated into the cleft of NP. Above the RNA is the N-terminal lobe of the NP-core, below the RNA are the penultimate- (purple) and clamp-helices (brown). f, wide and g, focused view showing the stabilizing ribbon formed by the penultimate- and clamp-helices. h, wide and i, focused view showing the N-terminal helix of the blue subunit binding into a pocket in the neighboring cyan subunit. In i the N-terminal helix of the blue NP is colored green; it binds into a pocket in the cyan NP formed by helix-13 (red) and helix-15 (pink). j, colored schematic of NP subunit; N-terminal lobe in green, orange, and cyan; C-terminal lobe in blue, pink, purple, red, and brown. A key to helix numbering is provided in Extended Data Fig. 4. k, electrostatic potential maps calculated from our NP 1-450 model. Scale bars indicate 20 Å.
Figure 2
Figure 2. Structure of Ebola NP-VP24-VP35-VP40 VLPs.
a, The structure of an Ebola NP-VP24-VP35-VP40 VLP helix, visualized by placing the density of a subunit in positions and orientations determined by subtomogram averaging. For ease of visualization, adjacent rungs are in dark and light grey; a single subunit is highlighted in pink. b, Ebola NP-VP24-VP35-VP40 VLP subunit densities. In blue and cyan are NP subunits, in orange is the small outer protrusion and in purple is the large outer protrusion. Continuous yellow density is RNA. Densities along the same rung are in dark grey, densities from other rungs are transparent. c, Detailed view of the RNA-encapsidation region; the outer densities are sliced to reveal the NP-RNA interface. This interface is nearly identical to that shown in (Fig. 1d, e). In (df), panels show molecular models fitted into the EM densities. The two NP models are in blue and cyan while two VP24 models are shown in orange and purple; model colors match the density colors in panel (b). Highlighted on the EM densities in green is a VP24 surface region including the N-terminal end of helix-1, the ends and loop joining helix-5 and -6, helix-7, and the N-terminal end of helix-8. In the orange VP24 this region binds NP, in the purple VP24 this region binds VP35. d, Side view of an individual asymmetric unit; the density threshold is set to show weaker unassigned densities. e, and f, Detailed views of VP24 fits in the large and small outer protrusions, respectively (see also Extended Data Fig. 6). Density thresholds are set to show helical densities. Scale bars indicate 20 Å. See also Supplementary Video 1.
Figure 3
Figure 3. Structure of Ebola and Marburg NCs from intact viruses.
a, and d, Visualizations of Ebola and Marburg NC, respectively. Visualizations consists of subunit densities positioned using the positions and orientations determined by subtomogram averaging. b, and e, Subunit densities of Ebola and Marburg NC, respectively. In cyan and blue are NC densities. In orange and purple are the small and large outer protrusions, respectively. Green density is extra disordered density in Marburg NC. Grey densities show other subunits on the same rung; densities from adjacent rungs are transparent. RNA density is in yellow. c, and f, Molecular model fits of NP and VP24 in Ebola and Marburg NC subunits, respectively. Model colors correspond with colors in (b and e). Scale bars indicate 20 Å.

Similar articles

Cited by

References

    1. Feldmann H, Sanchez A, Geisbert T. In: Fields virology. Knipe David M, Howley Peter M., editors. Lippincott Williams Wilkins; 2013. pp. 923–956.
    1. Lamb RA. In: Fields Virology. Knipe David M, Howley Peter M., editors. Vol. 30. Lippincott Williams Wilkins; 2013. pp. 880–884.
    1. Albertini AAV, et al. Crystal Structure of the Rabies Virus Nucleoprotein-RNA Complex. Science. 2006;313:360–363. doi: 10.1126/science.1125280. - DOI - PubMed
    1. Green TJ, Zhang X, Wertz GW, Luo M. Structure of the Vesicular Stomatitis Virus Nucleoprotein-RNA Complex. Science. 2006;313:357–360. doi: 10.1126/science.1126953. - DOI - PubMed
    1. Tawar RG et al. Crystal Structure of a Nucleocapsid-Like Nucleoprotein-RNA Complex of Respiratory Syncytial Virus. Science. 2009;326:1279–1283. doi: 10.1126/science.1177634. - DOI - PubMed

Publication types