. 2017 Nov 16;551(7680):389-393.
doi: 10.1038/nature24484. Epub 2017 Nov 8.

A ubiquitin-dependent signalling axis specific for ALKBH-mediated DNA dealkylation repair

Affiliations

A ubiquitin-dependent signalling axis specific for ALKBH-mediated DNA dealkylation repair

Joshua R Brickner et al. Nature. .

Abstract

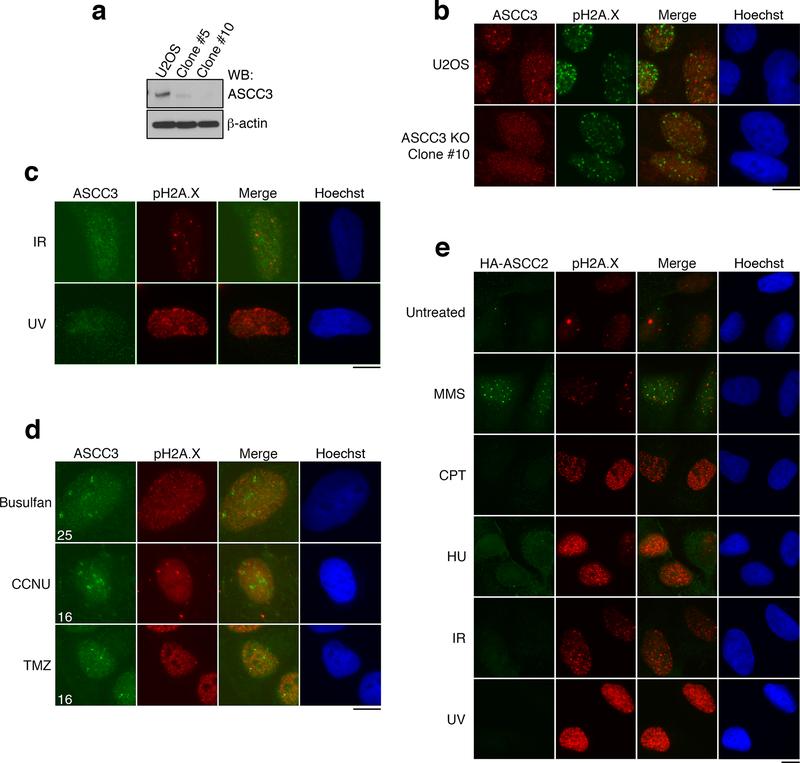
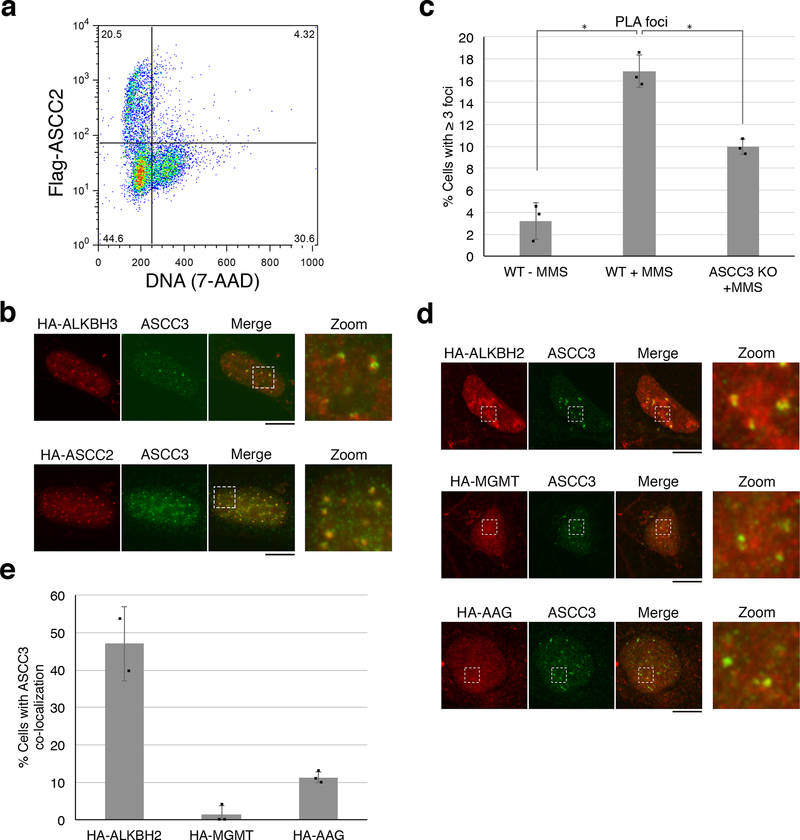
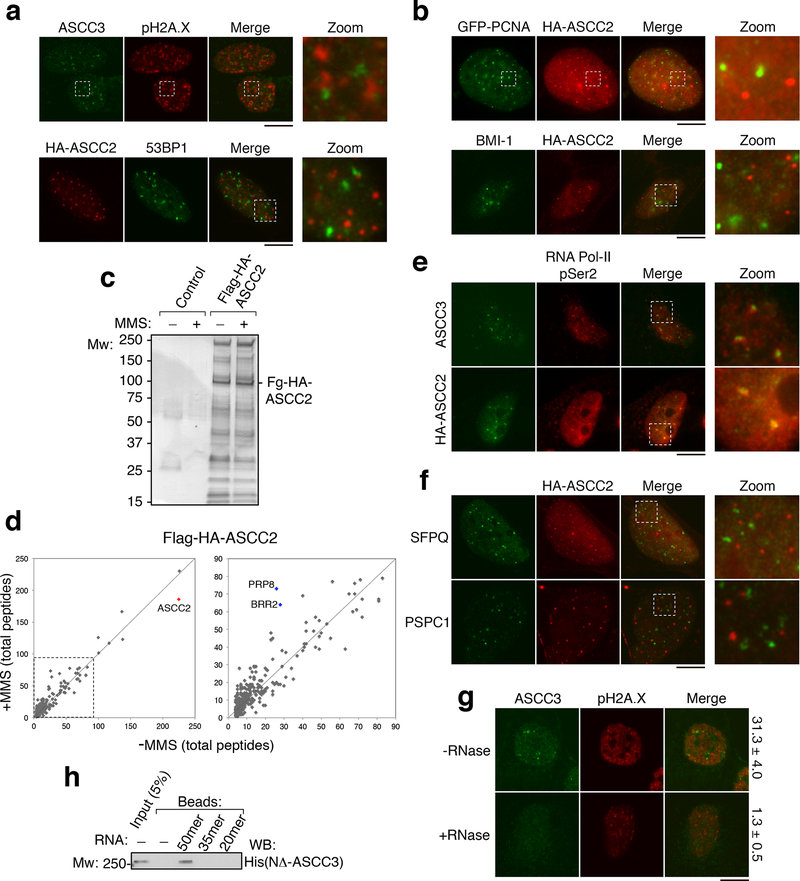
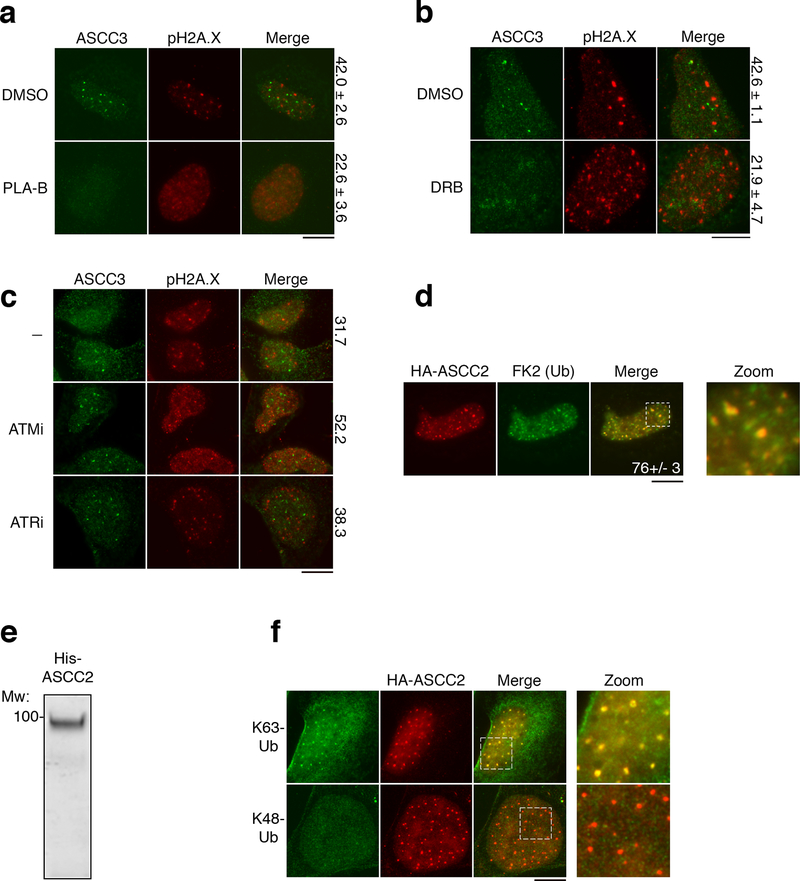
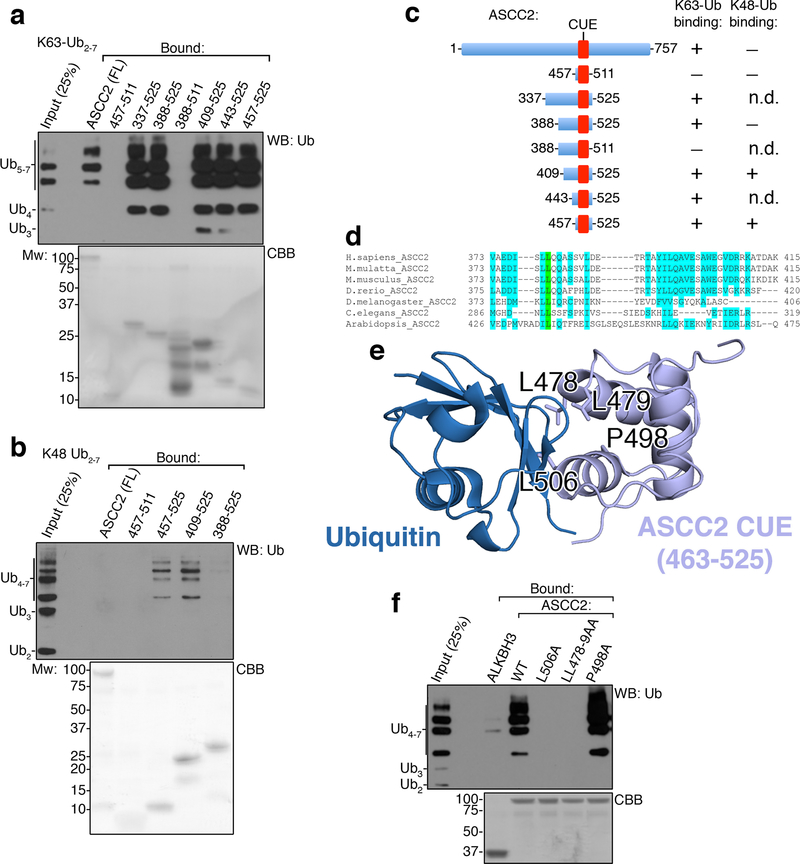
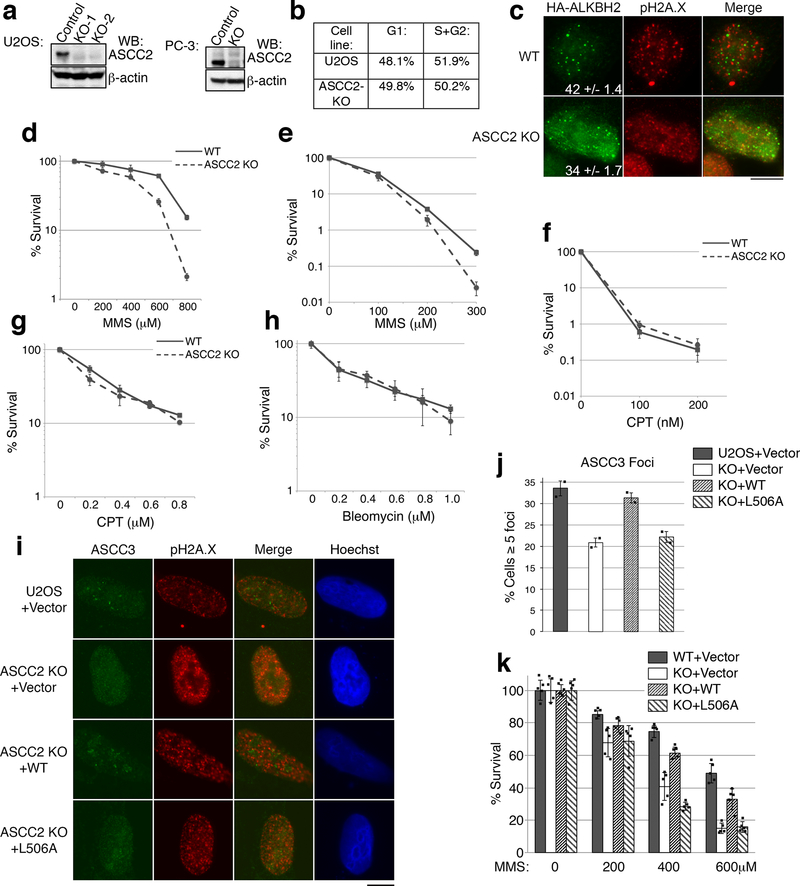
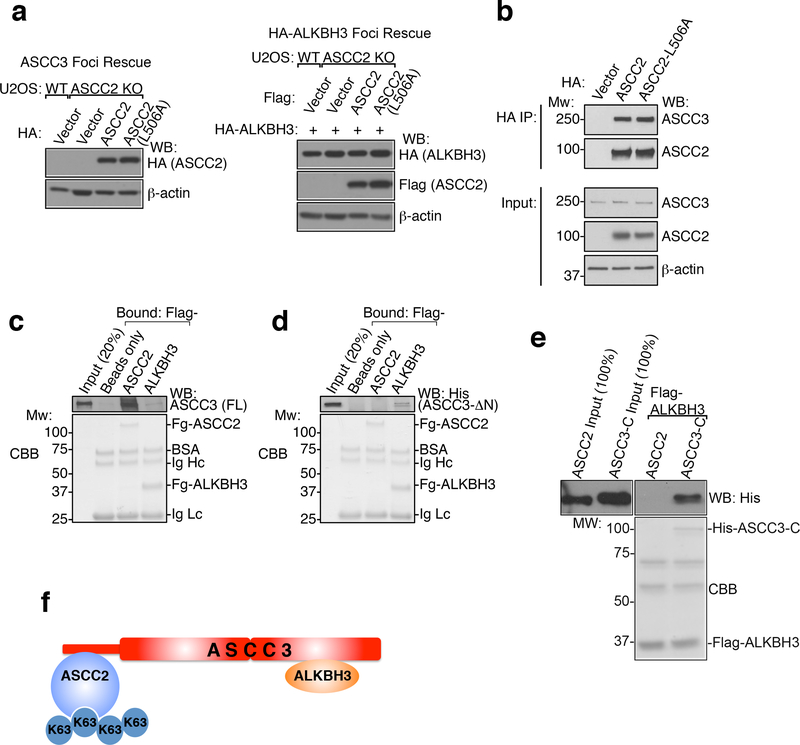
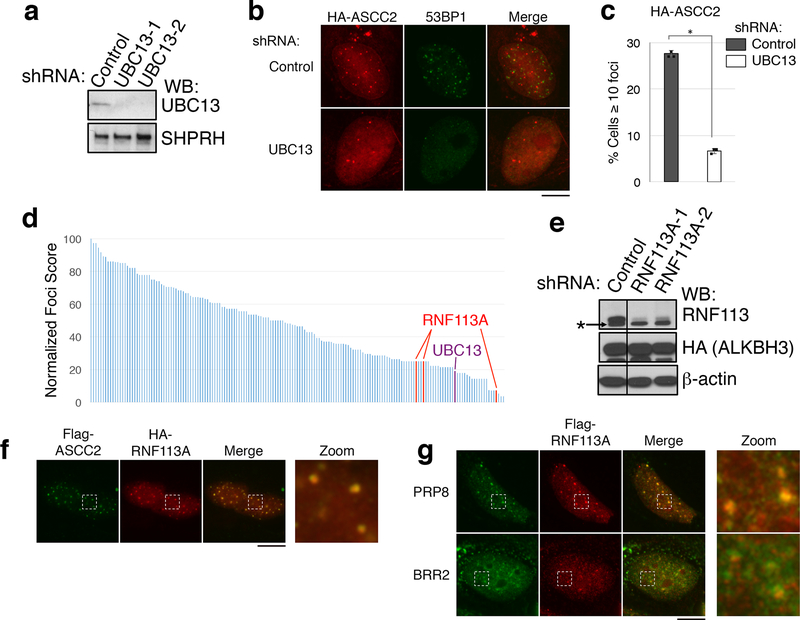
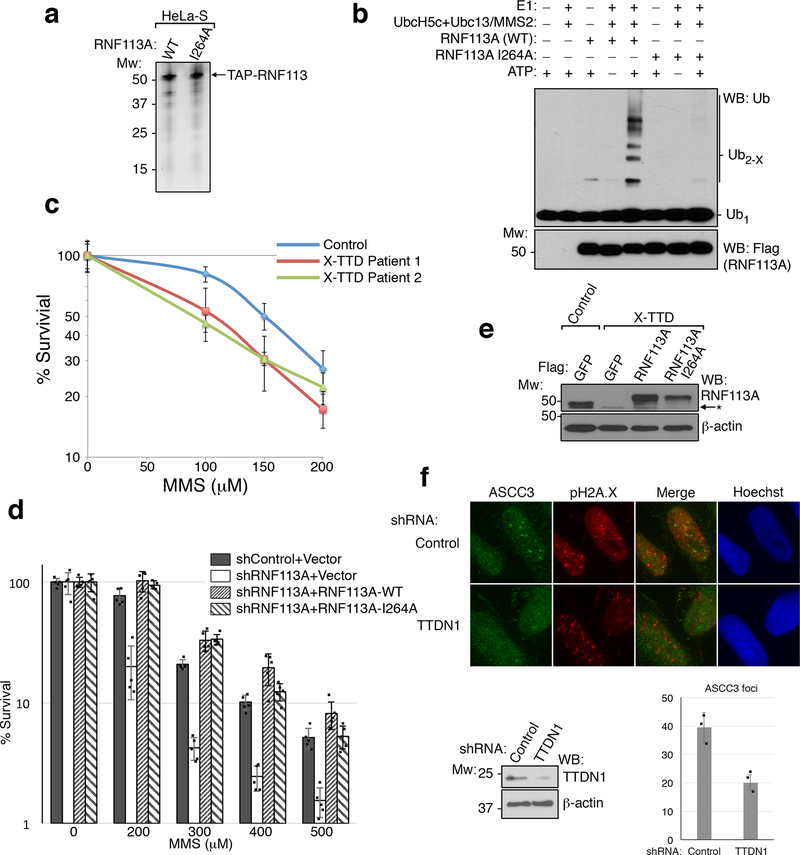
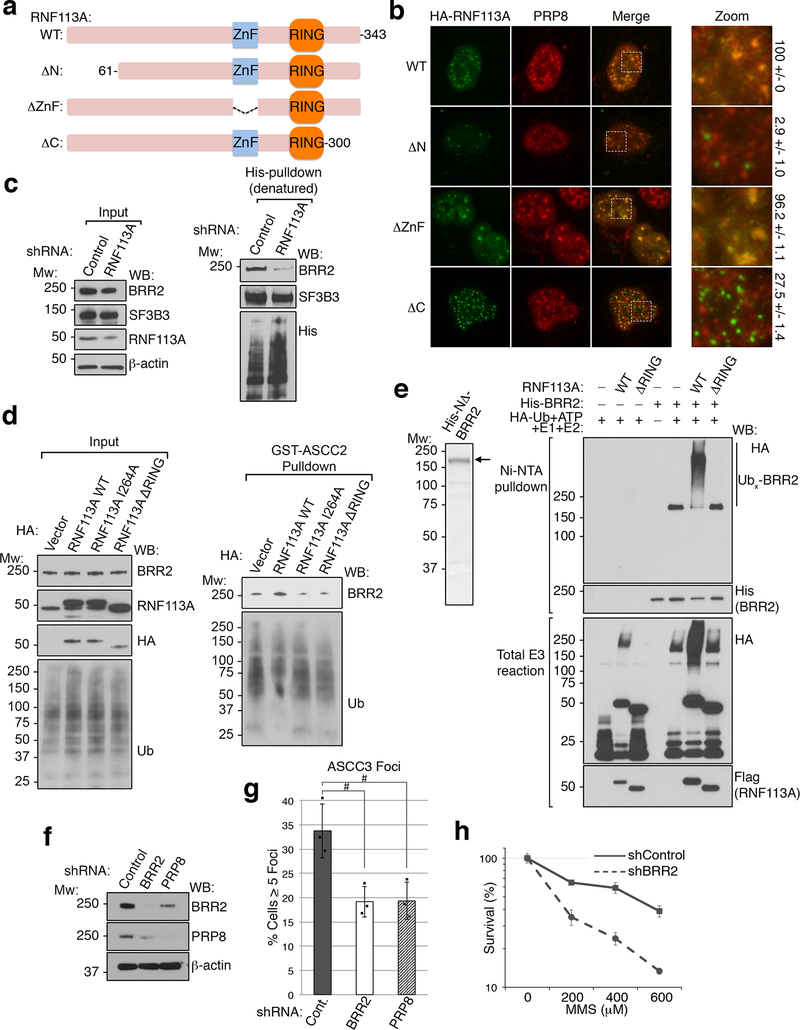
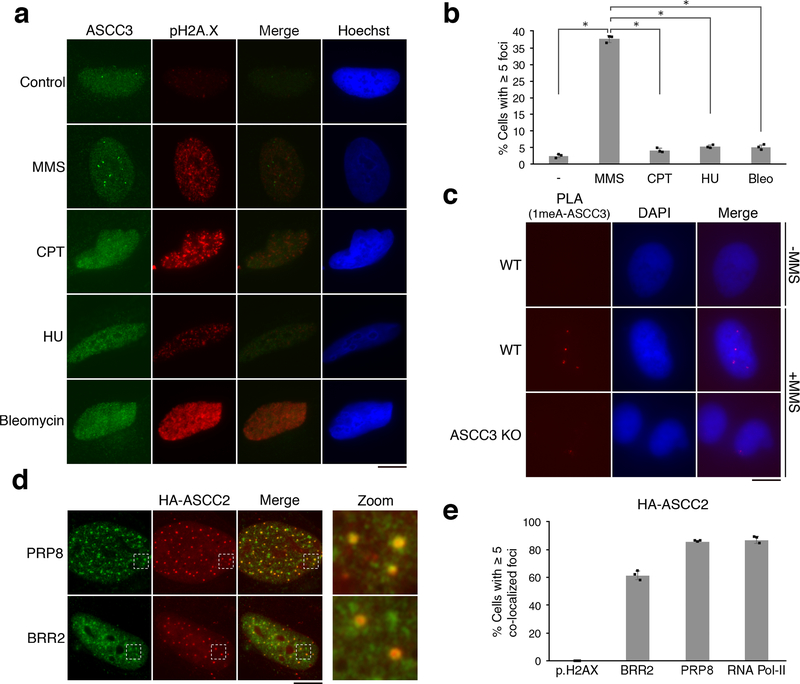
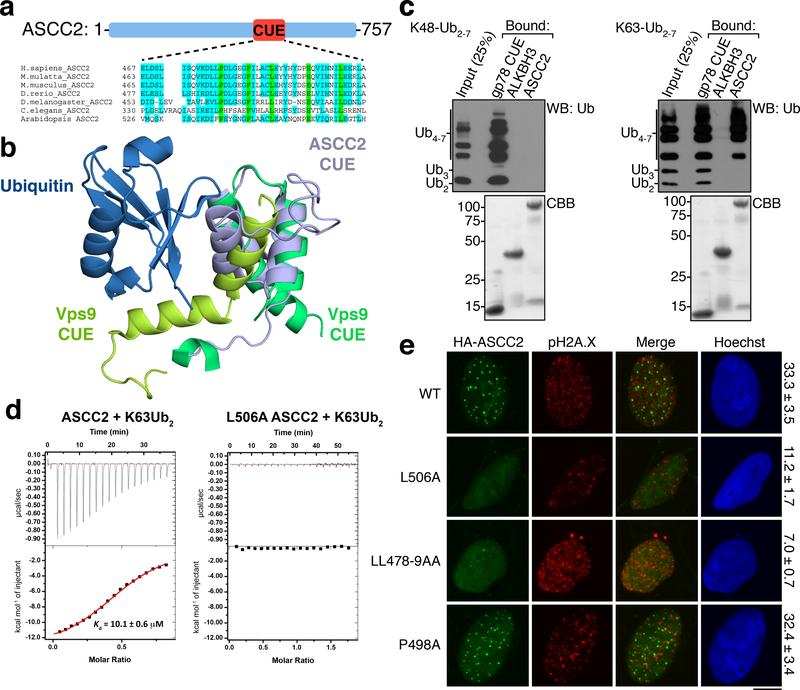
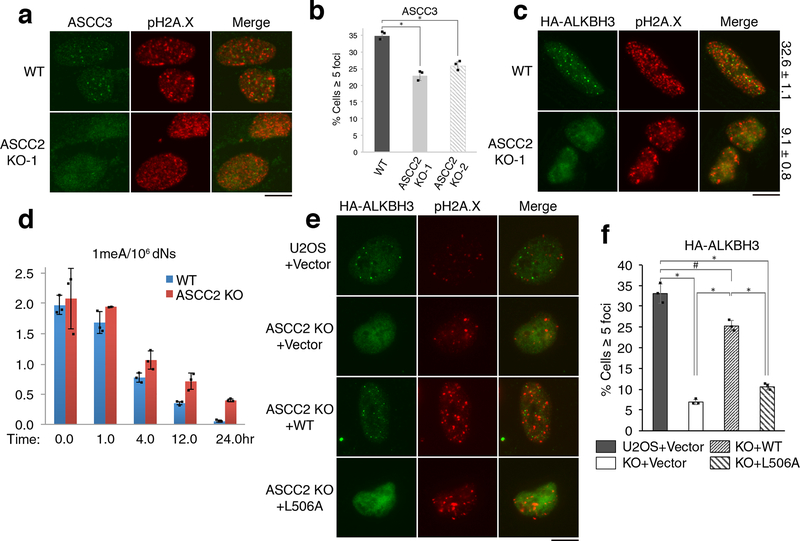
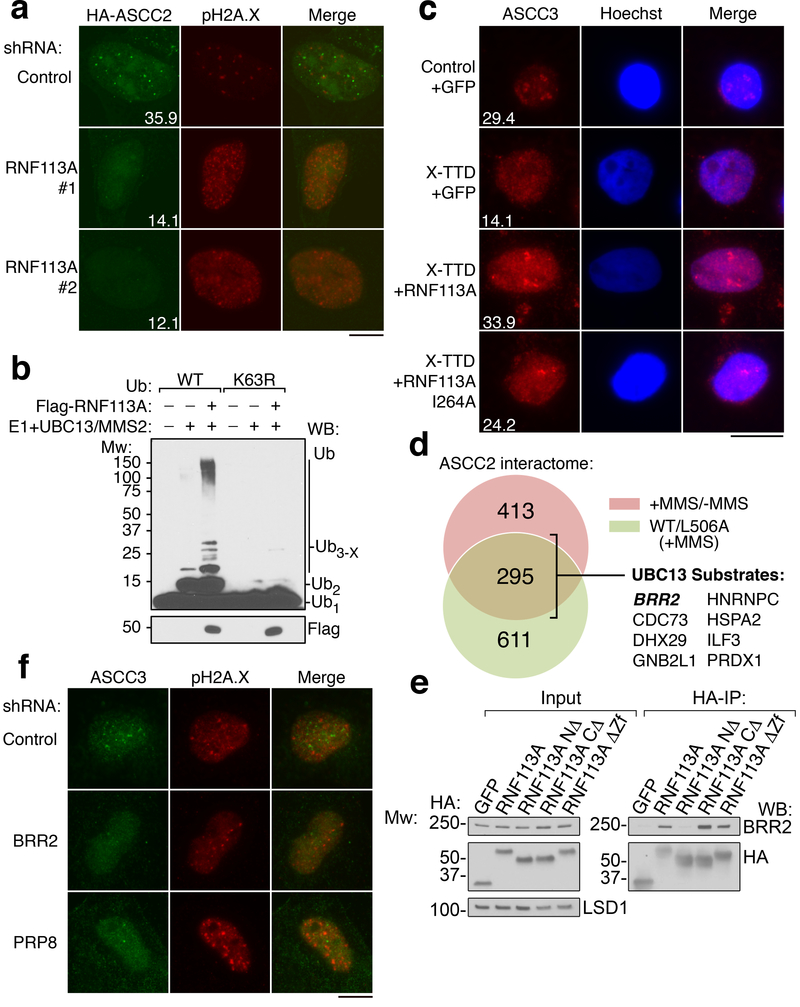
DNA repair is essential to prevent the cytotoxic or mutagenic effects of various types of DNA lesions, which are sensed by distinct pathways to recruit repair factors specific to the damage type. Although biochemical mechanisms for repairing several forms of genomic insults are well understood, the upstream signalling pathways that trigger repair are established for only certain types of damage, such as double-stranded breaks and interstrand crosslinks. Understanding the upstream signalling events that mediate recognition and repair of DNA alkylation damage is particularly important, since alkylation chemotherapy is one of the most widely used systemic modalities for cancer treatment and because environmental chemicals may trigger DNA alkylation. Here we demonstrate that human cells have a previously unrecognized signalling mechanism for sensing damage induced by alkylation. We find that the alkylation repair complex ASCC (activating signal cointegrator complex) relocalizes to distinct nuclear foci specifically upon exposure of cells to alkylating agents. These foci associate with alkylated nucleotides, and coincide spatially with elongating RNA polymerase II and splicing components. Proper recruitment of the repair complex requires recognition of K63-linked polyubiquitin by the CUE (coupling of ubiquitin conjugation to ER degradation) domain of the subunit ASCC2. Loss of this subunit impedes alkylation adduct repair kinetics and increases sensitivity to alkylating agents, but not other forms of DNA damage. We identify RING finger protein 113A (RNF113A) as the E3 ligase responsible for upstream ubiquitin signalling in the ASCC pathway. Cells from patients with X-linked trichothiodystrophy, which harbour a mutation in RNF113A, are defective in ASCC foci formation and are hypersensitive to alkylating agents. Together, our work reveals a previously unrecognized ubiquitin-dependent pathway induced specifically to repair alkylation damage, shedding light on the molecular mechanism of X-linked trichothiodystrophy.


Conflict of interest statement

The authors declare no competing financial interests.

Figures

Extended Data Figure 1.
Extended Data Figure 1.. The ASCC complex forms foci upon alkylation damage.
(a) ASCC3 KO cells were generated using CRISPR/Cas9 technology. Lysates were analyzed by Western blotting (n=2 independent experiments). Clone #10 was verified to be a knockout by deep sequencing. (b) Images of U2OS parental cells or ASCC3-KO cells after MMS (n=3 biological replicates). (c) Immunofluorescence of U2OS cells after exposure to γ-irradiation (IR; 5 Gy) or UV (25 J/m2) (n=3 biological replicates). (d) Images of U2OS cells after treatment with the alkylating agents busulfan (4 mM), 1-(2-chloroethyl)-3-cyclohexyl-1-nitrosourea (CCNU; 100 μM), or temozolomide (TMZ; 1.0 mM) (n=2 biological replicates). Numbers indicate the mean percent of cells expressing five or more foci. (e) Immunofluorescence of HA-ASCC2 expressing cells after exposure to the indicated damaging agents (n=3 biological replicates). Scale bars, 10 μm. For gel source data, see Supplementary Figure 1.
Extended Data Figure 2.
Extended Data Figure 2.. Subcellular localization of ASCC2 and other alkylation repair factors.
(a) Flow cytometry analysis of Flag-ASCC2 expressing cells after MMS treatment and Triton X-100 extraction. Numbers indicate the percent of total cells in each quadrant (n=2 independent experiments). (b) Images of cells expressing HA-ASCC2 or HA-ALKBH3 after MMS treatment (n=2 independent experiments). (c) PLA quantitation from Figure 1c (n=3 biological replicates; mean ± S.D.; two-tailed t-test, * = p < 0.005). (d) Immunofluorescence of cells expressing HA-ALKBH2, HA-MGMT, or HA-AAG upon MMS treatment. (e) Quantitation of ASCC3 co-localization from (d) (n=3 biological replicates; mean ± S.D.). Scale bars, 10 μm.
Extended Data Figure 3.
Extended Data Figure 3.. Localization and interactions of the ASCC complex.
(a) and (b) Images of U2OS or U2OS cells expressing the indicated vectors after MMS treatment (n=3 biological replicates). (c) Silver staining of the Flag-HA-ASCC2 complex purified from HeLa-S nuclear extract separated on 4%−12% SDS-PAGE gel (n=1 independent experiment). (d) Tagged ASCC2 was purified with or without MMS and analyzed by mass spectrometry. Peptide numbers for identified proteins were plotted for each condition. Expanded view is shown on the right (n=1 independent experiment). (e) and (f) Immunofluorescence analysis of U2OS or HA-ASCC2 expressing U2OS cells upon exposure to MMS (n=3 biological replicates). (g) U2OS cells were treated with MMS, and processed for immunofluorescence with or without initial incubation with RNase A (50 nM). Numbers indicate the percent of cells expressing five or more ASCC3 foci (n=3 biological replicates; mean ± S.D.). (h) Biotinylated RNAs (20mer, 35mer, or 50mer) were immobilized and tested for binding to recombinant His-NΔ-ASCC3 (n=2 independent experiments). Scale bars, 10 μm.
Extended Data Figure 4.
Extended Data Figure 4.. Functional interactions of the ASCC complex with other signaling pathways.
Immunofluorescence images of U2OS cells treated with MMS in the presence of spliceosomal inhibitor PLA-B (a) (100 nM; n=3 biological replicates; mean ± S.D.), the RNA Pol II inhibitor DRB (b) (100 μM; n=3 biological replicates; mean ± S.D.), or the indicated damage signaling kinase inhibitor (c) (n=2 biological replicates; mean). Numbers indicate the percent of cells expressing five or more ASCC3 foci. (d) Immunofluorescence of HA-ASCC2 and FK2 in cells after MMS (n=3 biological replicates; mean ± S.D.). (e) His-ASCC2 was purified on Ni-NTA, separated on a 10% SDS-PAGE gel, and analyzed by Coomassie blue staining (n=2 independent experiments). (f) Immunofluorescence of HA-ASCC2 cells and K63-ubiquitin (top) or K48-ubiquitin (bottom) after MMS treatment (n=2 independent experiments). Scale bars, 10 μm.
Extended Data Figure 5.
Extended Data Figure 5.. ASCC2 binds specifically to K63-linked ubiquitin chains.
(a) and (b) His-ASCC2 or the indicated His-ASCC2 deletions were immobilized on Ni-NTA and assessed for binding to K63-Ub2–7 (a) or K48-Ub2–7 (b) (n=3 independent experiments). (c) Schematic of ASCC2 or different ASCC2 deletions and their observed respective binding towards K63-Ub2–7 or K48-Ub2–7. N.D., not determined. (d) Sequence alignment and conservation of residues 373–415 of human ASCC2. (e) Interaction model between ubiquitin and the CUE domain of ASCC2 (PDB ID: 2DI0). The positions of four residues (L478, L479, P498, and L506) are shown. (f) Binding assays were performed with K63-Ub2–7 using WT or the mutants of His-ASCC2 (n=3 independent experiments).
Extended Data Figure 6.
Extended Data Figure 6.. Characterization of ASCC2 KO cells.
(a) ASCC2 gene knockouts in U2OS and PC-3 cells were generated using CRISPR/Cas9 technology and verified by deep sequencing. Whole cell lysates of the parental and KO cells were analyzed by Western blotting as shown (n=2 independent experiments). (b) Flow cytometry of WT and ASCC2-KO U2OS cells after MMS treatment to determine cell cycle distribution. (c) Immunofluorescence analysis of HA-ALKBH2 expressing cells after MMS. Numbers indicate the percent of cells expressing five or more HA-ALKBH2 foci (n=3 biological replicates; mean ± S.D.). (d) MMS sensitivity of WT or ASCC2 KO cells using MTS assay (mean ± S.D.; n=5 biological replicates). (e-f) Sensitivity of WT and ASCC2 KO cells to MMS (e) or camptothecin (f) was assessed by clonogenic survival assay (n=4 biological replicates; mean ± S.D.). (g-h) WT PC-3 and ASCC2-KO cell sensitivity to camptothecin (g) or bleomycin (h) using the MTS assay (n=5 biological replicates; mean ± S.D.). (i) Images of WT or ASCC2 KO cells expressing the indicated vectors after MMS exposure. (j) Quantitation of (i) (n=2 independent experiments; mean ± S.D.). (k) WT or ASCC2-KO cells expressing indicated vectors were assessed for sensitivity to MMS using the MTS assay (n=5 technical replicates; mean ±S.D.). Scale bar, 10 μm.
Extended Data Figure 7.
Extended Data Figure 7.. ASCC2 coordinates ASCC-ALKBH3 complex recruitment during alkylation damage.
(a) Whole cell lysates from Extended Data Figure 6i (left) Figure 3e (right) and (right) were collected and expression was analyzed by Western blotting (n=2 independent experiments). (b) Immunoprecipitation of HA-ASCC2 or HA-ASCC2 L506A was performed and analyzed by Western blot as shown (n=2 biological replicates). (c) Flag-ASCC2 or Flag-ALKBH3 were immobilized and tested for binding to full-length (FL) His-ASCC3. (d) Flag-ASCC2 or Flag-ALKBH3 were immobilized and tested for binding to N-terminally deleted His-ASCC3 (His-ASCC3-ΔN) (n=2 independent experiments). (e) Flag-ALKBH3 was immobilized and tested for binding to His-ASCC2, with His-ASCC3-C (C-terminus of ASCC3) serving as a positive control (n=2 independent experiments). (f) ASCC-ALKBH3 complex model.
Extended Data Figure 8.
Extended Data Figure 8.. Identification of the RNF113A E3 ligase.
(a) Whole cell lysates of U2OS cells infected with the indicated shRNAs were analyzed by Western blot. SHPRH was used as a loading control (n=1 independent experiment). (b) Immunofluorescence images of MMS-induced HA-ASCC2 foci in cells expressing the indicated shRNAs. (c) HA-ASCC2 foci quantitation from (b) (n=3 biological replicates; mean ± S.D.; two-tailed t-test, * = p < 0.001). (d) Compilation of E3 ligase shRNA screen results. For each candidate, U2OS cells were transduced with HA-ASCC2 and an E3 targeting shRNA. MMS-induced HA-ASCC2 foci formation was analyzed by immunofluorescence. Results were normalized to a scrambled shRNA (normalized score = 100). UBC13 denotes the positive control (purple). Results of three different shRNA to RNF113A are indicated in red (n=1 independent experiment for each shRNA). (e) Whole cell lysates of U2OS cells infected with the indicated shRNAs were analyzed by Western blot. Asterisk (*) indicates a non-specific band in the RNF113A blot (n=2 independent experiments). (f) Localization of Flag-ASCC2 and HA-RNF113A after MMS treatment (n=3 biological replicates). (g) Immunofluorescence of cells expressing Flag-RNF113A without MMS treatment (n=3 biological replicates).
Extended Data Figure 9.
Extended Data Figure 9.. Characterization of the E3 ubiquitin ligase activity of RNF113A and TTDN1.
(a) TAP-RNF113A and the I264A RING finger mutant were stably expressed in HeLa-S cells and purified using anti-Flag resin. The eluted proteins were then analyzed by silver staining after SDS-PAGE (n=3 independent experiments). (b) Ubiquitin ligase assays using E1, E2 (UbcH5c plus Ubc13/MMS2; 50 nM each), and wildtype or I264A RNF113A. Reactions were analyzed by Western blot (n=3 independent experiments). (c) MMS sensitivity of lymphoblasts from two X-TTD patients in comparison to an unaffected individual (n=5 biological replicates; mean ± S.D.). (d) U2OS cells expressing the indicated combination of shRNA and RNF113A rescue vector were assessed for MMS sensitivity using MTS assay (n=5 technical replicates; mean ± S.D.). (e) Whole cell lysates of control or X-TTD lymphoblasts expressing indicated vectors after selection (n=2 independent experiments). (f) Immunofluorescence analysis of U2OS cells expressing the indicated shRNAs after MMS treatment. Western blot (n=2 independent experiments) from the same cells is shown on the bottom, as is the quantification of ASCC3 foci (n=3 biological replicates; mean ± S.D.).
Extended Data Figure 10.
Extended Data Figure 10.. Functional characterization of RNF113A.
(a) Schematic of human RNF113A and its domain structure. The three deletion constructs used for localization analysis are also shown. (b) Images of cells expressing WT or the indicated HA-RNF113A deletion constructs. Scale bar, 10 μm. Quantitation of co-localization between each RNF113A construct and PRP8 is shown on the right (n=3 biological replicates; mean ± S.D.). (c) 293T cells expressing His-ubiquitin were transduced with control or RNF113A-targeting shRNAs and treated with MMS. Ubiquitinated proteins were isolated by Ni-NTA under denaturing conditions and Western blotted as shown. Input lysates were also analyzed as indicated. SF3B3, another ubiquitinated spliceosomal protein, was used as a control (n=3 independent experiments). (d) Cells expressing the indicated HA-vectors were treated with MMS as in (c). Lysates were then used for ubiquitin pulldown assays using GST-ASCC2, then blotted as shown. Input lysates were also analyzed as indicated (n=2 independent experiments). (e) His-NΔ-BRR2 was purified from Sf9 cells and analyzed by SDS-PAGE and Coomassie staining (left). This was then used as a substrate for ubiquitination assays using HA-Ub and wildtype (WT) or a RING-deletion (ΔRING) RNF113A (n=2 independent experiments). (f) Western blot analysis of U2OS cells expressing the indicated shRNAs used for immunofluorescence analysis in Figure 4F (n=2 independent experiments). (g) Quantitation of Figure 4F (n=3 biological replicates; mean ± S.D.; two-tailed t-test, # = p < 0.001). (h) MMS sensitivity of PC-3 cells expressing the indicated shRNAs was determined by MTS assay (n=5 technical replicates; mean ± S.D.).
Figure 1.
Figure 1.. The ASCC complex forms foci upon alkylation damage.
(a) Images of ASCC3 and pH2A.X immunofluorescence after treatment with damaging agents. (b) ASCC3 foci quantitation (n=3 biological replicates; mean ± S.D.; two-tailed t-test, * = p < 0.001). (c) PLA images in control or MMS-treated cells using 1meA and ASCC3 antibodies (n=3 biological replicates). (d) Immunofluorescence of HA-ASCC2 expressing cells treated with MMS. (e) Quantitation of MMS-induced co-localizations of HA-ASCC2 foci (n=3 biological replicates; mean ± S.D.). Scale bars, 10 μm.
Figure 2.
Figure 2.. ASCC2 binds to K63-linked ubiquitin chains via its CUE domain.
(a) ASCC2 sequence alignment. (b) Structure of the ASCC2 CUE domain (PDB ID: 2DI0; grey) overlayed with the Vps9 CUE:ubiquitin complex (PDB ID: 1P3Q). (c) His-ASCC2 was immobilized and assessed for binding to K48-Ub2–7 (left) or K63-Ub2–7. ALKBH3 and gp78-CUE served as controls. Bound material was analyzed by Western blot or Coomassie Blue (CBB) (n=3 independent experiments). (d) ITC was performed with K63-Ub2 and His-ASCC2 or the L506A mutant (n=1 independent experiment; mean ± S.E.). (g) Immunofluorescence images of MMS-induced foci in cells expressing various forms of HA-ASCC2. Numbers indicate the percentage of cells expressing ten or more HA-ASCC2 foci (n=3 biological replicates; mean ± S.D.). Scale bars, 10 μm.
Figure 3.
Figure 3.. ASCC2 is critical for ASCC3-ALKBH3 recruitment and alkylation resistance.
(a) MMS-induced ASCC3 foci were assessed in WT and ASCC2-KO cells. (b) Quantitation of (a) (n=3 biological replicates; mean ± S.D.; two-tailed t-test, * = p < 0.001). (c) HA-ALKBH3 foci were assessed as in (a). Numbers indicate the percentage of cells expressing five or more foci (n=2 biological replicates; mean). (d) 1meA quantitation in WT or ASCC2-KO cells after MMS treatment (n=3 biological replicates; mean ± S.D.). (e) Images of WT or ASCC2-KO cells expressing indicated vectors upon MMS. (f) Quantitation of (e) (n=3 biological replicates; mean ± S.D.; two-tailed t-test, * = p < 0.001, # = p < 0.05). Scale bars, 10 μm.
Figure 4.
Figure 4.. RNF113A ubiquitination recruits the ASCC complex.
(a) MMS-induced foci in U2OS cells expressing indicated shRNAs (n=3 technical replicates; mean). (b) Ubiquitin ligase assays using E1, E2 (UBC13/MMS2; 250 nM), and Flag-RNF113A. K63R ubiquitin was substituted as shown (n=2 independent experiments). (c) Images of X-TTD or control lymphoblasts expressing the indicated vectors after MMS (n=3 technical replicates; mean). (d). ASCC2 interactome analysis. UBC13 substrates were previously described. (e) HA-RNF113A deletions were immunoprecipitated to analyze BRR2 interaction. (n=3 independent experiments). (f) Images of U2OS cells expressing indicated shRNAs. Numbers indicate the percentage of cells expressing at least five (c) or ten (a) foci. Scale bars, 10 μm.

References

    1. Jackson SP & Durocher D Regulation of DNA damage responses by ubiquitin and SUMO. Mol Cell 49, 795–807, doi:10.1016/j.molcel.2013.01.017 (2013). - DOI - PubMed
    1. Sirbu BM & Cortez D DNA damage response: three levels of DNA repair regulation. Cold Spring Harbor perspectives in biology 5, a012724, doi:10.1101/cshperspect.a012724 (2013). - DOI - PMC - PubMed
    1. Zhao Y, Brickner JR, Majid MC & Mosammaparast N Crosstalk between ubiquitin and other post-translational modifications on chromatin during double-strand break repair. Trends Cell Biol, doi:10.1016/j.tcb.2014.01.005 (2014). - DOI - PMC - PubMed
    1. Drablos F et al. Alkylation damage in DNA and RNA--repair mechanisms and medical significance. DNA repair 3, 1389–1407, doi:10.1016/j.dnarep.2004.05.004 (2004). - DOI - PubMed
    1. Fu D, Calvo JA & Samson LD Balancing repair and tolerance of DNA damage caused by alkylating agents. Nat Rev Cancer 12, 104–120, doi:10.1038/nrc3185 (2012). - DOI - PMC - PubMed

Publication types

MeSH terms