. 2017 Nov 16;12(11):e0188204.
doi: 10.1371/journal.pone.0188204. eCollection 2017.

Circulating soluble endoglin modifies the inflammatory response in mice

Affiliations

Circulating soluble endoglin modifies the inflammatory response in mice

Laura Ruiz-Remolina et al. PLoS One. .

Abstract

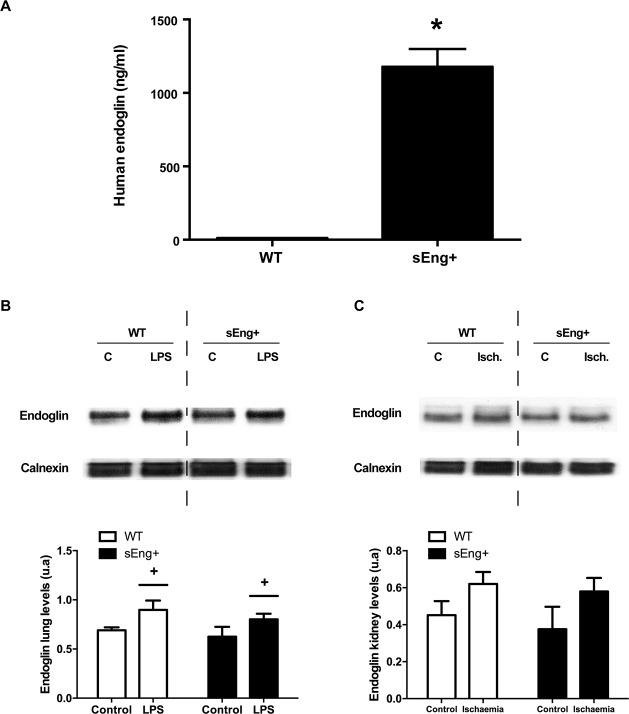
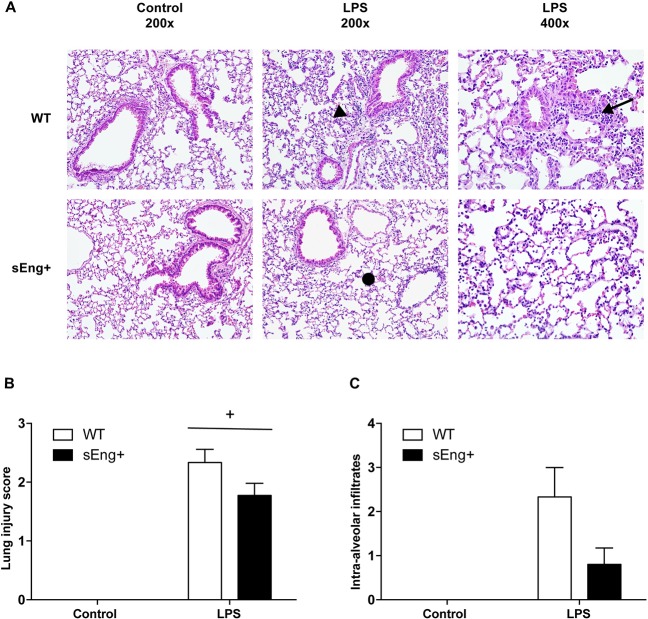
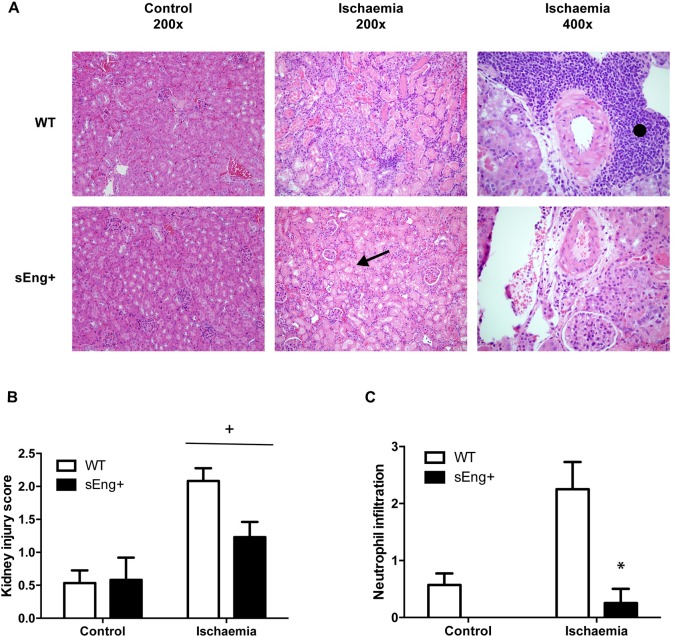
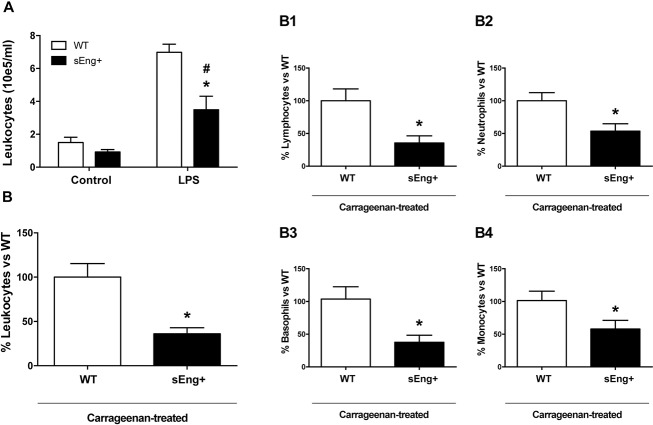
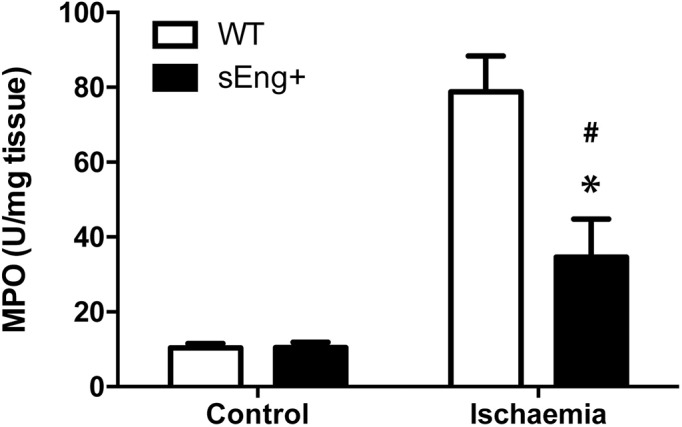
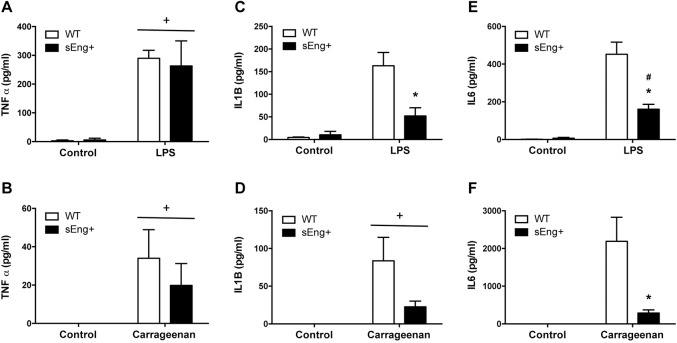
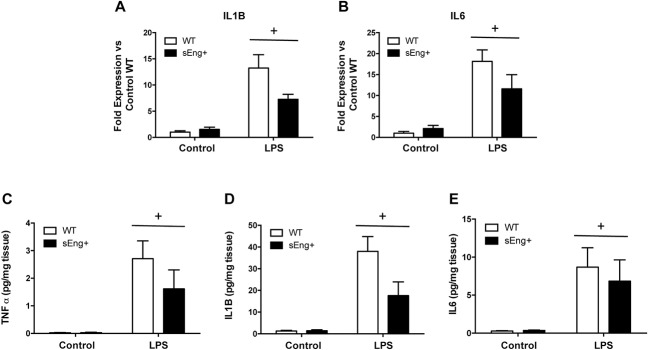
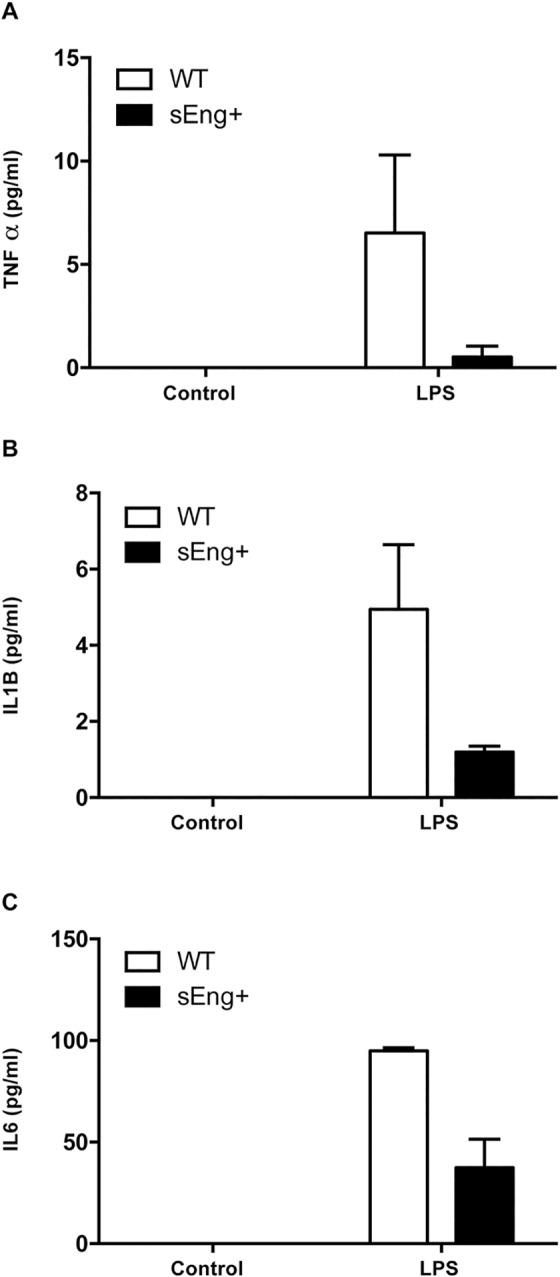
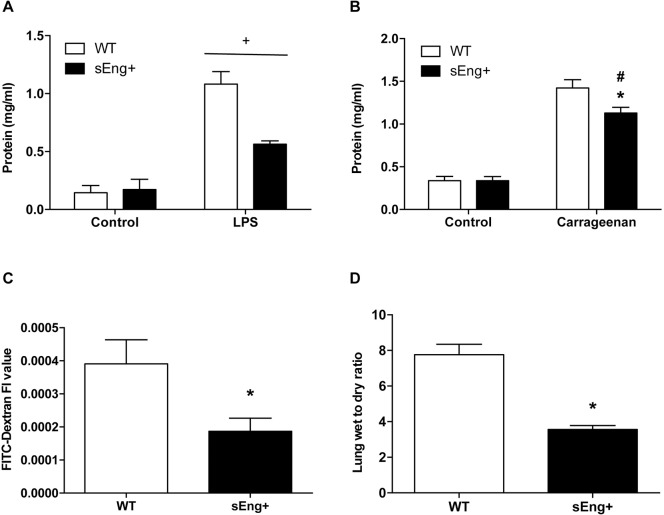
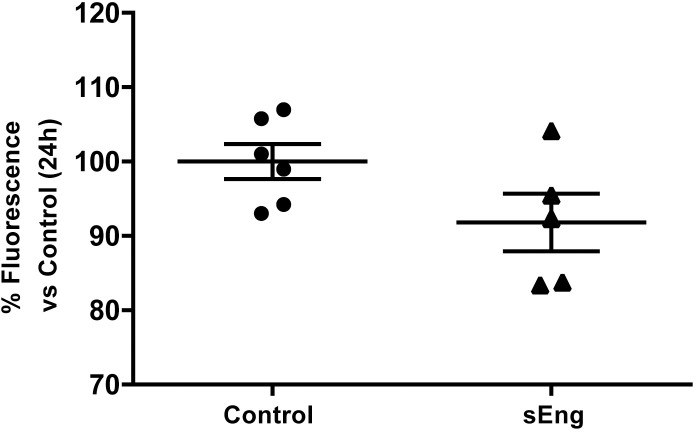
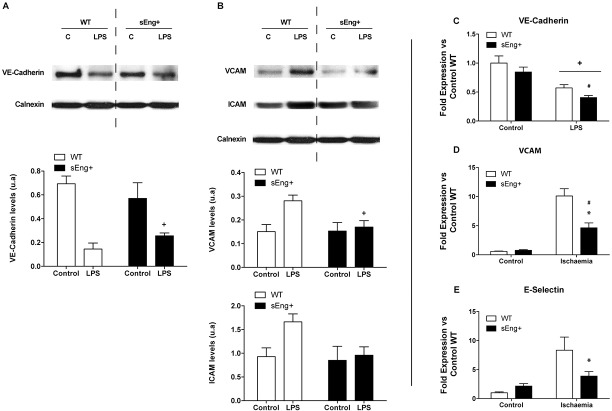
Inflammation is associated with every health condition, and is an important component of many pathologies such as cardiovascular diseases. Circulating levels of soluble endoglin have been shown to be higher in the serum of patients with cardiovascular diseases with a significant inflammatory component. The aim of this study was to evaluate the implication of circulating soluble endoglin in the inflammatory response. For this purpose, a transgenic mouse expressing human soluble endoglin (sEng+) was employed, and three different inflammatory approaches were used to mimic inflammatory conditions in different tissues. This study shows that control sEng+ mice have a normal inflammatory state. The lung and kidney injury induced by the inflammatory agents was reduced in sEng+ mice, especially the intra-alveolar and kidney infiltrates, suggesting a possible reduction in inflammation induced by soluble endoglin. To deepen into this possible effect, the leukocyte number in the bronchoalveolar lavage and air pouch lavage was evaluated and a significant reduction of neutrophil infiltration in LPS-treated lungs and ischemic kidneys from sEng+ with respect to WT mice was observed. Additionally, the mechanisms through which soluble endoglin prevents inflammation were studied. We found that in sEng+ animals the increment of proinflammatory cytokines, TNFα, IL1β and IL6, induced by the inflammatory stimulus was reduced. Soluble endoglin also prevents the augmented adhesion molecules, ICAM, VCAM and E-selectin induced by the inflammatory stimulus. In addition, vascular permeability increased by inflammatory agents was also reduced by soluble endoglin. These results suggest that soluble endoglin modulates inflammatory-related diseases and open new perspectives leading to the development of novel and targeted approaches for the prevention and treatment of cardiovascular diseases.


Conflict of interest statement

Competing Interests: The authors have declared that no competing interests exist.

Figures

Fig 1
Fig 1. Methods timeline.
(A) Aerosolized LPS (5mg/ml) was administered by inhalation to WT and sEng+ mice (Day 1). 48 h after LPS exposure, mice were euthanized and BAL was carried out by instilling sterile PBS into the lungs via tracheotomy (Day 3). BAL was used for the analysis of proinflammatory cytokines, leukocytes and protein determination. (B) An air pouch was created on the back of WT and sEng+ mice by subcutaneous injection of 3 ml filtered air (Day 1). The pouch was re-inflated with an additional 2 ml of filtered air (Day 4). Inflammation was induced by injecting 500 μl of 1% carrageenan in PBS into the air pouch of the anesthetized mice (Day 7). Mice were sacrificed and air pouch lavages were performed with 2 ml of PBS (Day 8). Air pouch lavage was used for analysis of proinflammatory cytokines, leukocytes and protein determination. (C) Aerosolized LPS (5mg/ml) was administered by inhalation to WT and sEng+ mice (Day 1). 24 h after LPS exposure, 40 kDa FITC-Dextran (25 mg/ml) was injected into the retroorbital venous sinus to WT and sEng+ mice. 30 min later, the mice were euthanized (Day 2), and BAL was collected by instilling PBS into the lungs via tracheotomy. (D) Male mice were anaesthetized by isoflurane inhalation. Following abdominal incision, left renal pedicle was bluntly dissected and a microvascular clamp was placed on the left renal pedicle for 30 min. After a 30-min ischemia, the clamps were removed and the wounds sutured. After closure, animals were subcutaneously injected with 0,5 ml of PBS (Day 1). 48 h later, the mice were euthanized and blood and the kidneys were collected (Day 3).
Fig 2
Fig 2. Soluble human endoglin and membrane mouse endoglin in WT and sEng+ mice.
(A) Soluble human endoglin was measured by ELISA from plasma of WT and sEng+ mice. Data are expressed as mean ± SEM. n = 20 in each group of mice. *p<0,001, T test. (B) Mouse membrane endoglin amount of protein in the lung was determined by western blot: +p<0,05 LPS vs control, two-way ANOVA. (C) Mouse membrane endoglin amount of protein in the kidney was determined by western blot. Equal loading of samples was confirmed by immunodetection of calnexin. Top: Representative immunoblots. Bottom: densitometric analysis. Data are expressed as mean ± SEM. n = 5 in each group of mice.
Fig 3
Fig 3. Morphological lung changes after LPS treatment.
(A) Representative images of hematoxylin and eosin stained lung sections of five animals from each experimental group. Lungs were fixed with 4% paraformaldehyde, embedded in paraffin, and cut into 5 μm thick sections before being stained. Photomicrographs were obtained with a Nikon Eclipse E800 microscope. Both WT and sEng+ mice lungs show marked inflammatory infiltrates (arrow) after LPS treatment, inter-alveolar septal thickening (arrow head), and interstitial edema (•). Magnification x200 and x400. (B) Severity of lung injury was scored by a pathologist using a semiquantitative histopathology score system which evaluates lung injury in four categories: alveolar septae, alveolar hemorrhage, intra-alveolar fibrin, and intra-alveolar infiltrates. Data are expressed as mean ± SEM. n = 5 in each group of mice, +p<0,0001 vs control, two-way ANOVA. (C) Evaluation score of intra-alveolar infiltrates. n = 5 in each group of mice.
Fig 4
Fig 4. Morphological kidney changes after ischemia-reperfusion.
(A) Representative images of hematoxylin and eosin-stained kidney sections from five animals in each experimental group. Kidneys were fixed with 4% paraformaldehyde, embedded in paraffin, and then cut into 5 μm thick sections before being stained. Photomicrographs were obtained with a Nikon Eclipse E800 microscope. Both WT and sEng+ mice kidneys show cortical and medullary hyperemia with areas of tubular necrosis found in the deep and superficial cortex, tubular cast and a significant expansion of the tubular structure with destruction of the epithelium (arrow) and inflammatory infiltrates (•). Magnification x200 and x400. (B) Severity of kidney injury was scored by a pathologist using a semiquantitative histopathology score system which evaluates kidney injury in three categories: glomerular fibrosis, tubular obstruction and dilation and neutrophil infiltration. Data are expressed as mean ± SEM. n = 5 in each group of mice, +p<0,0001 vs control, two-way ANOVA. (C) Evaluation score of neutrophil infiltration. n = 5 in each group of mice, *p<0,01 vs ischemic WT, T test.
Fig 5
Fig 5. Leukocyte recruitment.
(A) Leukocyte recruitment from control and LPS-treated WT and sEng+ mice. Total leukocyte count was measured in BAL. Data are expressed as mean ± SEM. n = 6 in each group of mice, #p<0,005 vs control sEng+, T test; *p<0,005 vs LPS WT, T test. (B) Leukocyte recruitment in the air pouch lavage from carrageenan-treated WT and sEng+ mice. Data are expressed as mean ± SEM. n = 20 in each group of mice. *p<0,001 vs carrageenan WT, T test. (B1) Subpopulations of recruited lymphocytes in air pouch lavage (64,38% inhibition, *p<0,005 vs carrageenan WT, T test); (B2) Neutrophils (46,3% inhibition, *p<0,01 vs carrageenan WT, T test); (B3) Basophils (66,04% inhibition, *p<0,005 vs carrageenan WT, T test); (B4) Monocytes (43,5% inhibition, *p<0,05 vs carrageenan WT, T test). n = 20 in each group of mice. Data are expressed as the percentage of sEng+ leukocytes with respect to the WT, mean ± SEM.
Fig 6
Fig 6. Myeloperoxidase activity.
MPO activity in kidneys from control and ischemia-treated WT and sEng+ mice. MPO concentration was measured in kidney tissue and presented as MPO units per milligram of tissue. n = 6 in each group of mice, *p<0,05 vs ischemic WT, #p<0,05 vs control sEng+, T test.
Fig 7
Fig 7. Inflammatory cytokines in BAL and air-pouch lavage.
Quantitative analysis of proinflammatory cytokines (TNFα, IL1β and IL6) in BAL and air pouch lavage was performed by ELISA and presented as picograms per milliliter of lavage. Data are expressed as mean ± SEM. n = 5 in each group of mice. (A) TNFα concentration in BAL, +p<0,0001 LPS vs control, two-way ANOVA; (B) TNFα concentration in air pouch lavage, +p<0,05 carrageenan vs control, two-way ANOVA; (C) IL1β concentration in BAL, *p<0,05 vs LPS WT, T test; (D) IL1β concentration in air pouch lavage, +p<0,01 carrageenan vs control, two-way ANOVA; (E) IL6 concentration in BAL, #p<0,001 vs control sEng+, T test; *p<0,05 vs LPS, T test; (F) IL6 concentration in air pouch lavage, *p<0,05 vs carrageenan WT, T test.
Fig 8
Fig 8. Inflammatory cytokines in lung tissue.
Quantitative analysis of inflammatory cytokines (TNFα, IL1β and IL6) in lung tissue was performed by RT-PCR (A-B) and ELISA (C-E). Data are expressed as mean ± SEM. n = 5 in each group of mice. (A) IL1β, +p<0,0005 LPS vs control, two-way ANOVA; (B) IL6, +p<0,0001 LPS vs control, two-way ANOVA; (C) TNFα, +p<0,005 LPS vs control, two-way ANOVA; (D) IL1β, +p<0,005 LPS vs control, two-way ANOVA; (E) IL6, +p<0,05 LPS vs control, two-way ANOVA.
Fig 9
Fig 9. Inflammatory cytokines in plasma.
Quantitative analysis of inflammatory cytokines (TNFα, IL1β and IL6) in plasma was performed by ELISA. Data are expressed as mean ± SEM. n = 5 in each group of mice.
Fig 10
Fig 10. Vascular permeability.
(A) Protein concentration in BAL. Data are expressed as mean ± SEM. n = 5 in each group of mice. +p<0,0001 LPS vs control, two-way ANOVA; (B) Protein concentration in air pouch lavage. Data are expressed as mean ± SEM. n = 5 in control mice and n = 20 in carrageenan-treated. #p<0,0001 vs control sEng+, T test; *p<0,01 vs carrageenan WT, T test; (C) Fluorescence in BAL from LPS-treated WT and sEng+ mice. 24 h after LPS exposure, 100 μl of 40kDa FITC-Dextran (25mg/ml) was injected into the retroorbital venous sinus, 30 min before the mice were euthanized. BAL was collected. Data are expressed as mean ± SEM. n = 5 in each group of mice. *p<0,05, T test; (D) Lung wet/dry weight ratios. Data are expressed as mean ± SEM. n = 5 in each group of mice. *p<0,001, T test.
Fig 11
Fig 11. Effect of circulating soluble endoglin on cell permeability.
The permeability was determined in endothelial EA.hy926 cells cultured in transwell plates until they reached confluence. Upper chamber media, containing LPS (1 μg/ml) and soluble endoglin (500 ng/ml) for their respective treatments, were replaced with FITC-Dextran (40 kDa) at 1 mg/ml in DMEM. After 24 h at 37°C, the inserts were removed, and the amount of fluorescence in the bottom chambers was measured using a fluorescence plate reader. Data are presented as percentage of fluorescence versus Control. Data are expressed as mean ± SEM. n = 6 in each group of mice. T test, p = 0,09.
Fig 12
Fig 12. Effect of circulating soluble endoglin on endothelial adhesion molecules.
(A) VE-Cadherin amount of protein and mRNA expression were determined by western blot: +p<0,0001 LPS vs control, two-way ANOVA; and RT-PCR (C): +p<0,0001 LPS vs control, #p<0,05 vs control sEng+; two-way ANOVA. (B) VCAM and ICAM amount of protein was determined by western blot, +p<0,05 LPS vs control, two-way ANOVA. (D)VCAM mRNA expression was also determined by RT-PCR in kidney tissue: *p<0,01 vs ischemic WT, #p<0,005 vs control sEng+, T test. Equal loading of samples was confirmed by immunodetection of calnexin. Top: Representative immunoblots. Bottom: densitometric analysis. Data are expressed as mean ± SEM. n = 5 in each group of mice. (E) E-Selectin mRNA expression was determined by RT-PCR. E-Selectin, *p<0,05 vs ischemia WT, T test.

Similar articles

Cited by

References

    1. Butchar JP, Parsa KVL, Marsh CB, Tridandapani S. Negative regulators of toll-like receptor 4-mediated macrophage inflammatory response. Curr Pharm Des. 2006;12[32]:4143–53. - PubMed
    1. Tracey KJ. The inflammatory reflex. Nature. 2002. December 19;420[6917]:853–9. doi: 10.1038/nature01321 - DOI - PubMed
    1. Schmid-Schönbein GW. Analysis of inflammation. Annu Rev Biomed Eng. 2006;8:93–131. doi: 10.1146/annurev.bioeng.8.061505.095708 - DOI - PubMed
    1. Yoshimura A. Signal transduction of inflammatory cytokines and tumor development. Cancer Sci. 2006. June;97[6]:439–47. doi: 10.1111/j.1349-7006.2006.00197.x - DOI - PMC - PubMed
    1. Venkatesha S, Toporsian M, Lam C, Hanai J, Mammoto T, Kim YM, et al. Soluble endoglin contributes to the pathogenesis of preeclampsia. Nat Med. 2006. June;12[6]:642–9. doi: 10.1038/nm1429 - DOI - PubMed

LinkOut - more resources