Clinical Trial
. 2017 Nov 16;13(11):e1006687.
doi: 10.1371/journal.ppat.1006687. eCollection 2017 Nov.

Sequential inflammatory processes define human progression from M. tuberculosis infection to tuberculosis disease

Affiliations
Clinical Trial

Sequential inflammatory processes define human progression from M. tuberculosis infection to tuberculosis disease

Thomas J Scriba et al. PLoS Pathog. .

Abstract

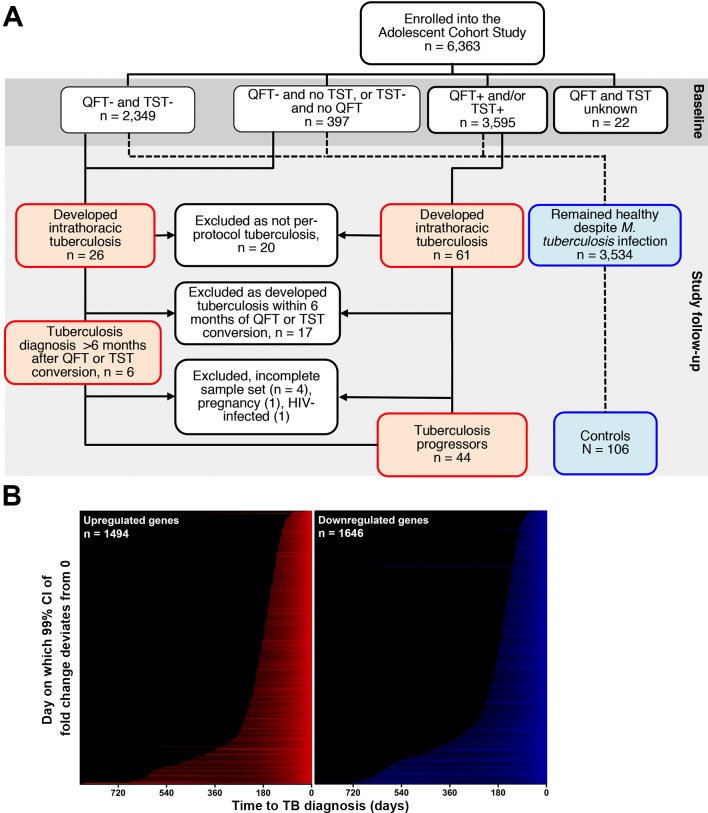
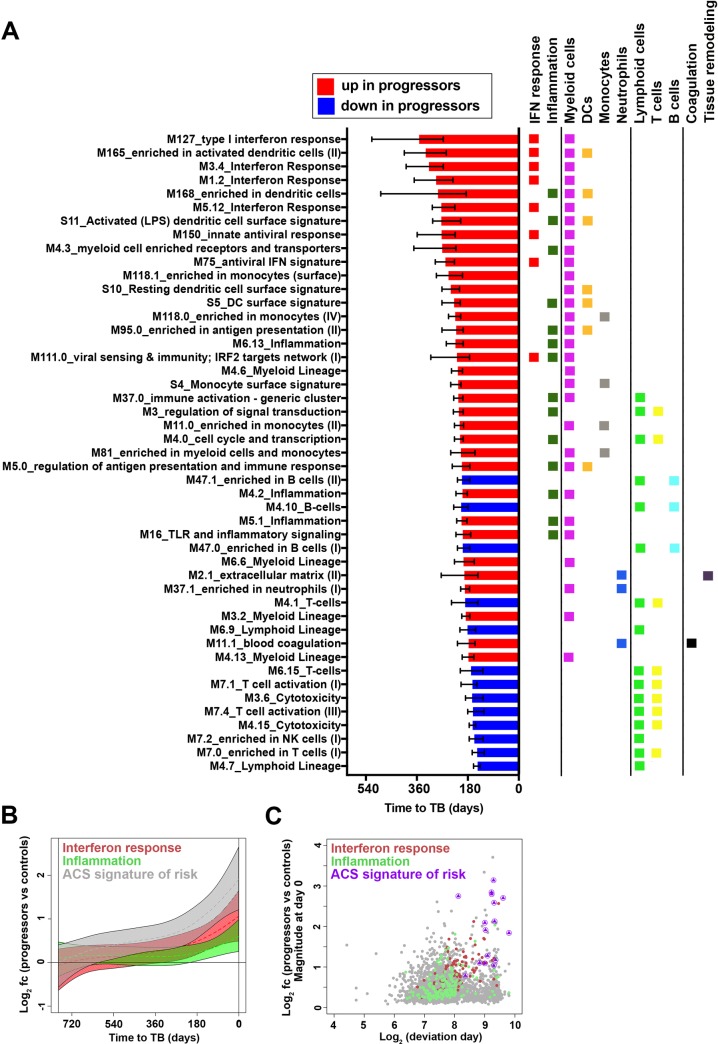
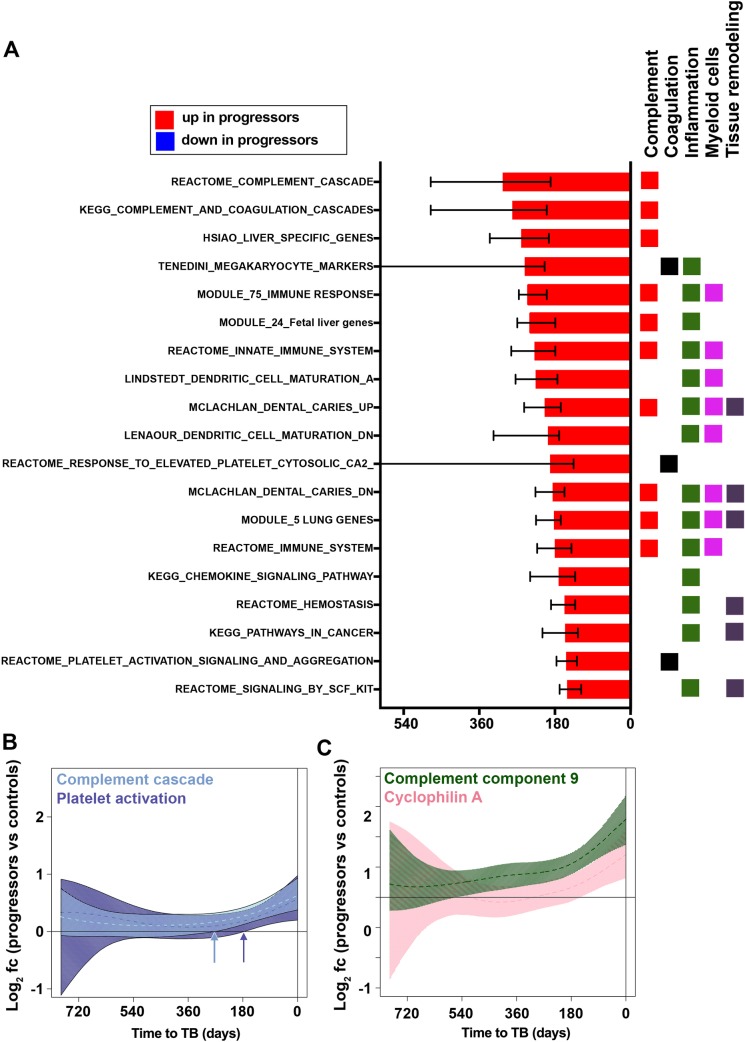
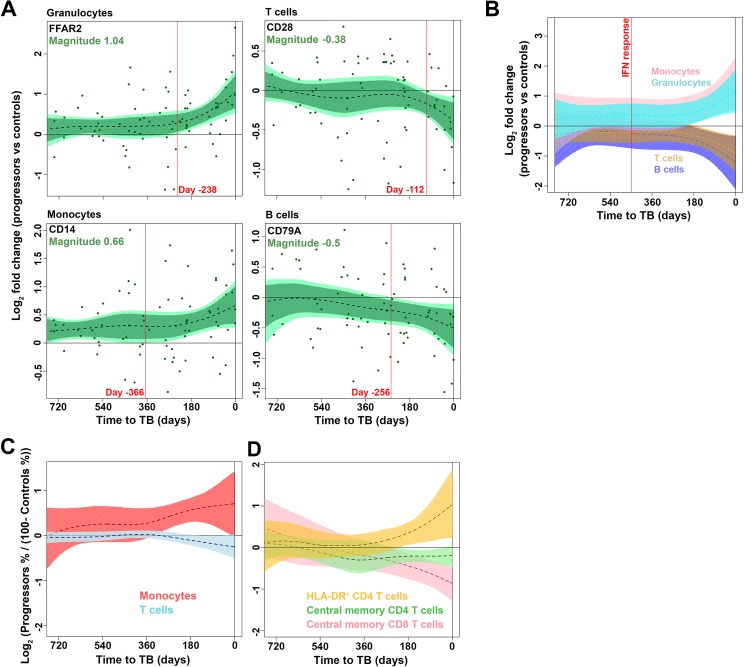
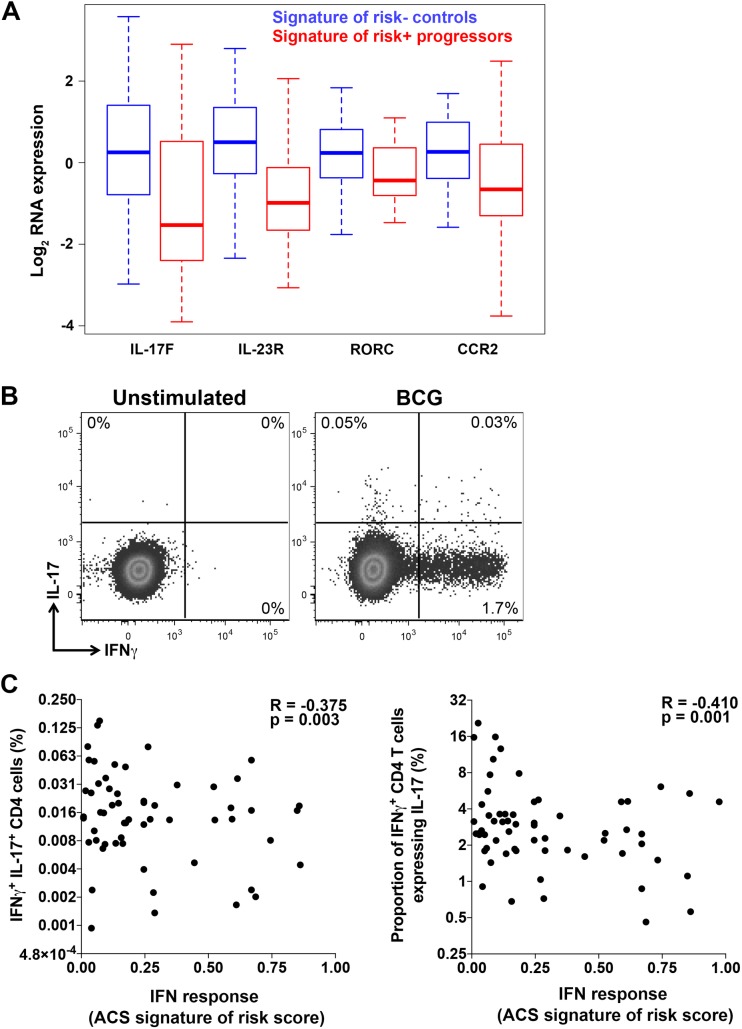
Our understanding of mechanisms underlying progression from Mycobacterium tuberculosis infection to pulmonary tuberculosis disease in humans remains limited. To define such mechanisms, we followed M. tuberculosis-infected adolescents longitudinally. Blood samples from forty-four adolescents who ultimately developed tuberculosis disease (“progressors”) were compared with those from 106 matched controls, who remained healthy during two years of follow up. We performed longitudinal whole blood transcriptomic analyses by RNA sequencing and plasma proteome analyses using multiplexed slow off-rate modified DNA aptamers. Tuberculosis progression was associated with sequential modulation of immunological processes. Type I/II interferon signalling and complement cascade were elevated 18 months before tuberculosis disease diagnosis, while changes in myeloid inflammation, lymphoid, monocyte and neutrophil gene modules occurred more proximally to tuberculosis disease. Analysis of gene expression in purified T cells also revealed early suppression of Th17 responses in progressors, relative to M. tuberculosis-infected controls. This was confirmed in an independent adult cohort who received BCG re-vaccination; transcript expression of interferon response genes in blood prior to BCG administration was associated with suppression of IL-17 expression by BCG-specific CD4 T cells 3 weeks post-vaccination. Our findings provide a timeline to the different immunological stages of disease progression which comprise sequential inflammatory dynamics and immune alterations that precede disease manifestations and diagnosis of tuberculosis disease. These findings have important implications for developing diagnostics, vaccination and host-directed therapies for tuberculosis.

Trial registration: Clincialtrials.gov, NCT01119521.


Conflict of interest statement

TJS, APN, EGT, AA, WAH, and DEZ are co-inventors on a patent of the 16-gene transcriptomic correlate of risk of TB. DS, MAdG, TH and UAO are current or former employees of or hold stock options in SomaLogic, Inc. and received funding from the Bill & Melinda Gates Foundation (OPP1091720). This does not alter our adherence to all PLOS Pathogens policies on sharing data and materials. All other authors have declared that no competing interests exist.

Figures

Fig 1
Fig 1. Kinetics of whole blood transcriptional responses during progression from infection to TB disease.
(A) Consort diagram showing participant selection of the progressor and control substudy from the Adolescent Cohort Study (ACS). A total of 6,363 adolescents (12–18 years of age) were enrolled into the ACS. Participants were stratified according to their baseline M.tb-infection status according to either QFT-positive (≥0.35 IU/ml) and/or TST induration ≥ 10mm. Individuals with unknown QFT and TST test results were excluded. Participants with baseline M.tb-infection or who were QFT-negative and TST-negative at baseline but converted their tests at a later time point were eligible for inclusion as progressors or controls. Progressors developed intrathoracic TB disease, defined as TB diagnosis by at least two consecutive sputum smear positive tests, or at least one microbiologically confirmed culture positive test, at least 6 months after detection of M.tb-infection. Progressors were matched to healthy M.tb-infected “controls” based on age, gender, ethnicity, school, and any prior history of TB disease at a ~1:2 ratio. (B) Genes found to be significantly up (red) or down (blue) regulated in progressors relative to controls, ranked according to the time to TB disease at which expression in progressors (n = 38) is significantly different to controls (n = 104) (see S1 Fig). The full list of significantly regulated genes is in S2 Table.
Fig 2
Fig 2. Sequential changes in distinct transcriptional modules during progression from M.tb infection to TB disease.
(A) Gene modules, pre-defined by Chaussabel and BTM, found to be significantly enriched in progressors, compared with controls, and ranked in descending order according to median deviation time points (indicated by bars) of genes differentially expressed between progressors and controls. Data from 38 progressors and 104 controls were included in the analysis. Error bars denote IQR of median deviation time points of differentially expressed genes within each module. Assignment of each module to known immunological responses or processes or cellular subsets, according to differentially expressed genes, is indicated by the colored squares. The full list of significantly enriched modules is in S4 Table. (B) Kinetics of type I/II interferon response or inflammation transcriptional gene modules, as well as the 16 genes in the ACS signature of risk of TB. For interferon responses we included genes with significant kinetic response from modules: M127_type I interferon response, M5.12_Interferon Response, M3.4_Interferon Response and M1.2_Interferon Response. For inflammation we included genes with significant kinetic response from modules: M6.13_Inflammation, M4.2_Inflammation, M5.1_Inflammation, M16_TLR and inflammatory signaling, M33_inflammatory response and M53_inflammasome receptors and signaling. Module kinetics during progression were modeled as non-linear splines and 99% CI (shaded areas) were computed by performing 2000 spline fitting iterations after bootstrap resampling from the full dataset. (C) Scatter plot showing fold change (log2 FC) plotted versus the time point at which the 99% CI deviates from a log2 fold change of 0 (log2 days before TB diagnosis) for genes in the IFN response and inflammation modules and the 16 genes in the ACS signature of risk of TB.
Fig 3
Fig 3. Sequential changes in plasma proteins during progression from M.tb infection to TB disease.
(A) Gene modules, pre-defined by Reactome, KEGG and MSIGDB, and matched to the corresponding protein found to be significantly enriched in plasma from progressors, compared with controls, and ranked in descending order according to median deviation time points (indicated by bars) of proteins differentially abundant between progressors and controls. Data from 36 progressors and 104 controls were included in the analysis. Error bars denote IQR of median deviation time points of differentially abundant plasma proteins within each gene module. Assignment of each module to known immunological responses or processes or cellular subsets, according to differentially abundant proteins, is indicated by the colored squares. The full list of significantly enriched modules is in S5 Table. (B) Kinetics of complement cascade and platelet activation protein modules. Module kinetics during progression were modeled as non-linear splines (dashed lines) and 99% CI (shaded areas) were computed by performing 2000 spline fitting iterations after bootstrap resampling from the full dataset. Arrows indicate the time before TB diagnosis at which the 99% CI deviates from zero for the two modules. (C) Kinetics of individual proteins representing the complement cascade (complement component 9) and platelet activation (cyclophilin A) protein modules, modeled as non-linear splines and 99% CI.
Fig 4
Fig 4. Changes in proportions of peripheral blood cell subsets during progression from infection to TB disease.
(A) Kinetics of mRNA expression, expressed as log2 fold change between bin-matched progressors and controls and modeled as non-linear splines (dotted lines) for genes representing granulocytes, monocytes, T cells and B cells. Light green shading represents 99% CI and dark green shading 95% CI for the temporal trends, computed by performing 2000 spline fitting iterations after bootstrap resampling from the full dataset. The magnitude for each gene, representing the log2 fold change at TB diagnosis, is shown in green text. The deviation time, calculated as the time point at which the 99% CI deviates from a log2 fold change of 0, is indicated in red text. Data from 38 progressors and 104 controls were included in the analysis. (B) Temporal trends of gene modules representing granulocytes (genes with significant kinetic response from BIOCARTA_GRANULOCYTES_PATHWAY), monocytes (genes from M11.0_enriched in monocytes (II)), T cells (genes from M4.1_T-cells, M6.15_T-cells, M7.1_T cell activation (I) and M7.4_T cell activation (III)) and B cells (genes from M4.10_B-cells, M47.0_enriched in B cells (I), M47.1_enriched in B cells (II) and M69_enriched in B cells (VI)), modeled as non-linear splines during progression. The deviation time for the interferon module shown in Fig 3B is denoted by the vertical red line. (C) Temporal trends of relative mean (dotted lines) proportions of monocytes and T cells (D) or activated HLA-DR+ CD4 T cells, CCR7+CD45RA- central memory CD4 or CD8 T cells, measured by flow cytometry from cryopreserved PBMC and modeled as non-linear splines during progression. Shown are log2 cell proportions for progressors relative to bin-matched controls. Data from 33 progressors and 71 controls were included in the analysis. Shading denotes 99% CI computed by performing 2000 spline fitting iterations after bootstrap resampling from the full dataset.
Fig 5
Fig 5. Changes in T cell function associated with whole blood IFN responses in progressors.
(A) Differentially expressed Th17-associated mRNA transcripts in sorted T cells from progressors with positive ACS signature of risk of TB compared with controls with negative signature of risk of TB. T cells were sorted after stimulation of PBMC with medium alone or peptide pools and data from these stimulation conditions were combined for analysis (see methods). Data from 31 progressors (138 progressor samples were signature-positive, 67 were negative) and 90 controls (299 control samples were signature-negative, 40 were positive) were included in the analysis and time to TB was not considered. Representative genes significantly enriched in the Th17 module by modular analysis, at a p-value < 0.05 and an FDR <0.2, are shown. The full set of differentially expressed T cell genes is in S6 Table and gene modules enriched in genes differentially expressed between progressors with positive ACS signature of risk of TB and controls with negative ACS signature of risk of TB are listed in S7 Table. (B) Flow cytometry plots depicting CD4 T cells co-expressing IFNγ and IL-17 after stimulation of whole blood with BCG or medium (unstimulated) from an adult in the BCG revaccination study. Shown is a representative sample taken 3 weeks after BCG-revaccination. (C) Associations between cytokine expressing CD4 T cells after stimulation of whole blood with BCG or medium (unstimulated) and the ACS signature of risk of TB (COR score), in adults from the BCG revaccination study. Type I/II IFN response was measured by the ACS signature of risk of TB. Shown are frequencies of BCG-specific CD4 T cells co-expressing IFNγ and IL-17 and relative proportions of BCG-specific IFNγ+ CD4 T cells co-expressing IL-17. Spearman R and p-values are shown in each plot.

References

    1. Houben RMGJ, Dodd PJ. The Global Burden of Latent Tuberculosis Infection: A Re-estimation Using Mathematical Modelling. PLoS Med. 2016;13: e1002152 doi: 10.1371/journal.pmed.1002152 - DOI - PMC - PubMed
    1. Thwaites GE, Nguyen DB, Nguyen HD, Hoang TQ, Do TTO, Nguyen TCT, et al. Dexamethasone for the treatment of tuberculous meningitis in adolescents and adults. N Engl J Med. 2004;351: 1741–1751. doi: 10.1056/NEJMoa040573 - DOI - PubMed
    1. Tobin DM, Roca FJ, Oh SF, McFarland R, Vickery TW, Ray JP, et al. Host genotype-specific therapies can optimize the inflammatory response to mycobacterial infections. Cell. 2012;148: 434–446. doi: 10.1016/j.cell.2011.12.023 - DOI - PMC - PubMed
    1. Barnes PF, Lu S, Abrams JS, Wang E, Yamamura M, Modlin RL. Cytokine production at the site of disease in human tuberculosis. Infection and immunity. 1993;61: 3482–3489. - PMC - PubMed
    1. Wilkinson KA, Wilkinson RJ, Pathan A, Ewer K, Prakash M, Klenerman P, et al. Ex vivo characterization of early secretory antigenic target 6-specific T cells at sites of active disease in pleural tuberculosis. Clinical infectious diseases: an official publication of the Infectious Diseases Society of America. 2005;40: 184–187. doi: 10.1086/426139 - DOI - PubMed

Publication types

Associated data