. 2017 Nov 16;12(11):e0188267.
doi: 10.1371/journal.pone.0188267. eCollection 2017.

Antigenicity of the 2015-2016 seasonal H1N1 human influenza virus HA and NA proteins

Affiliations

Antigenicity of the 2015-2016 seasonal H1N1 human influenza virus HA and NA proteins

Amelia M Clark et al. PLoS One. .

Abstract

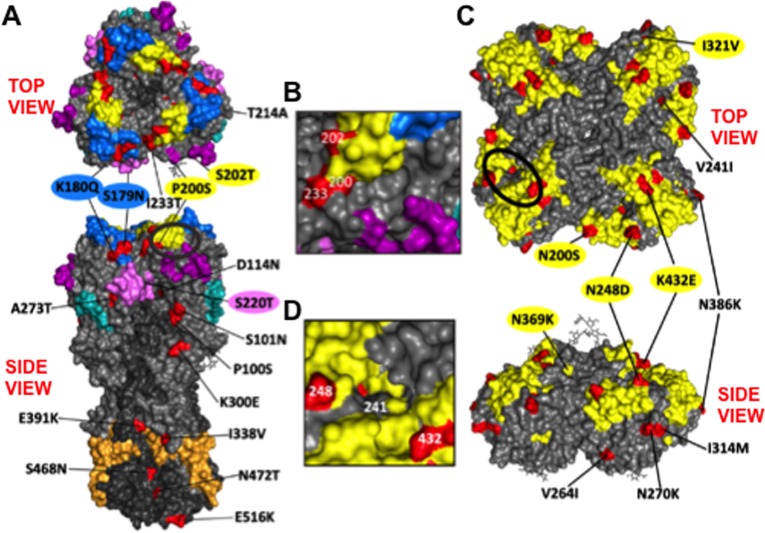
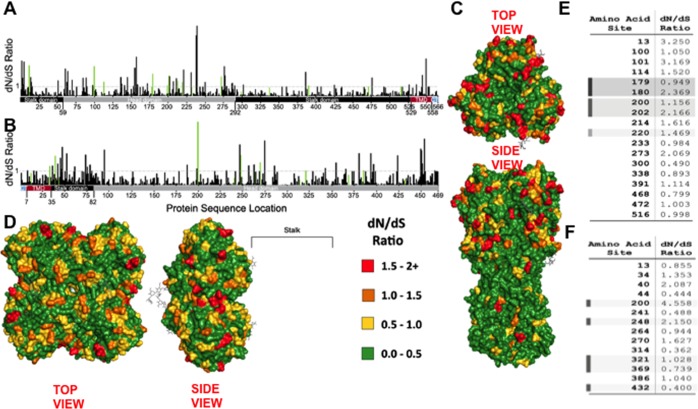
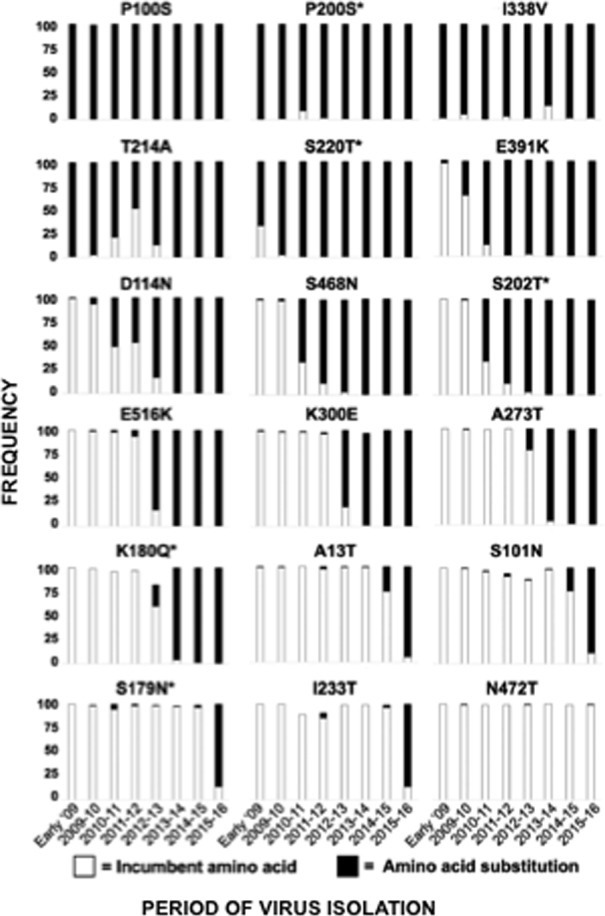
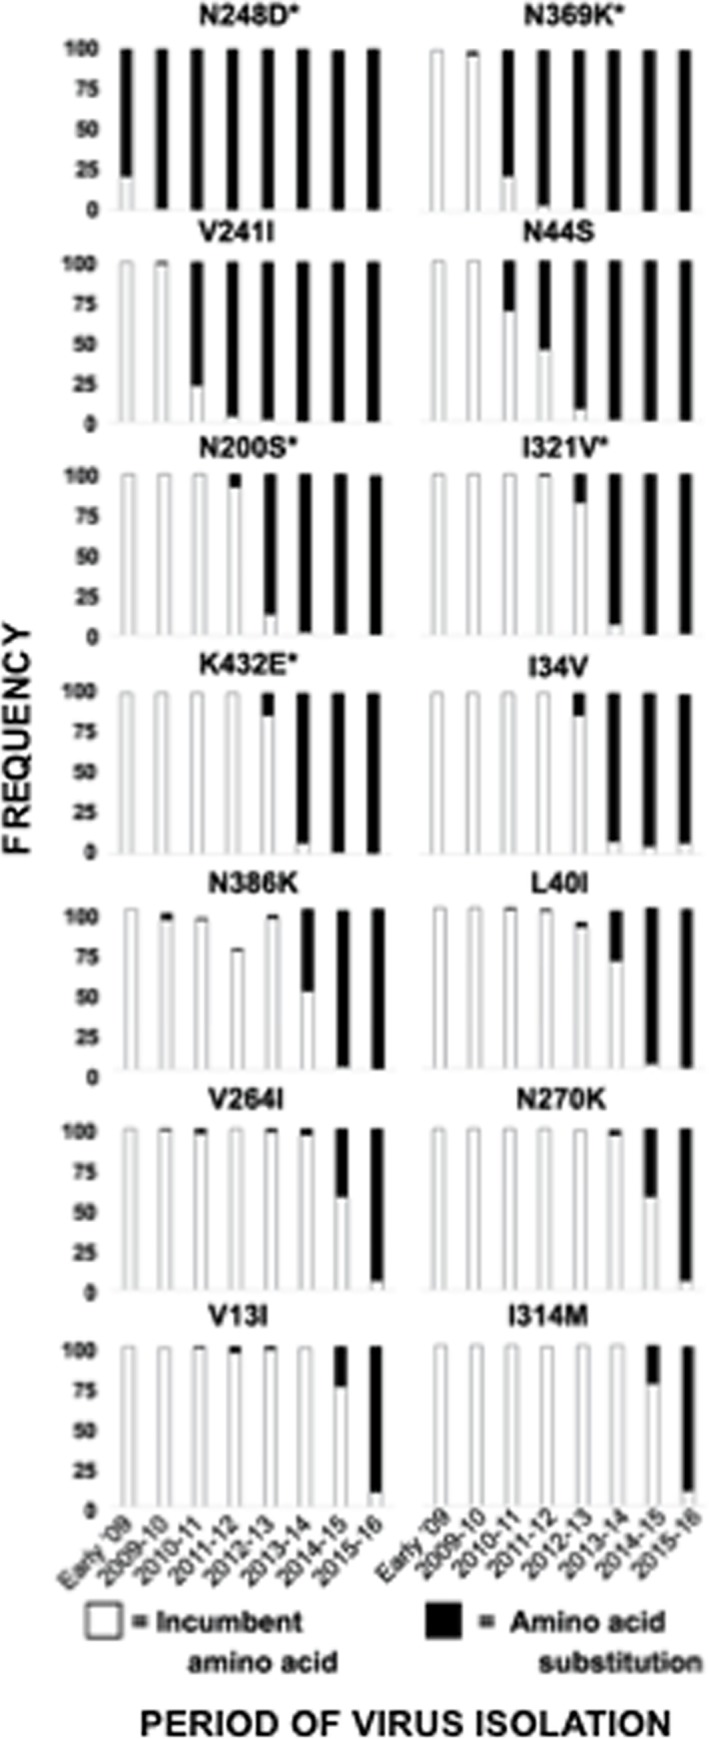
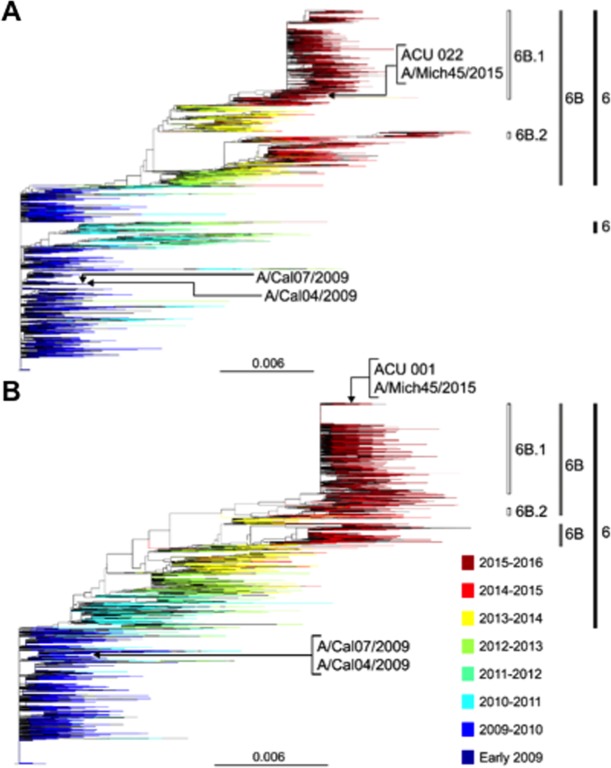
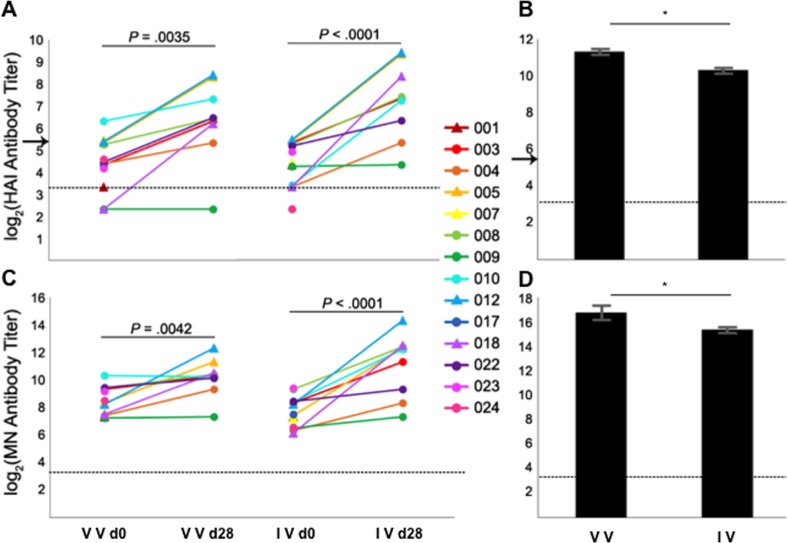
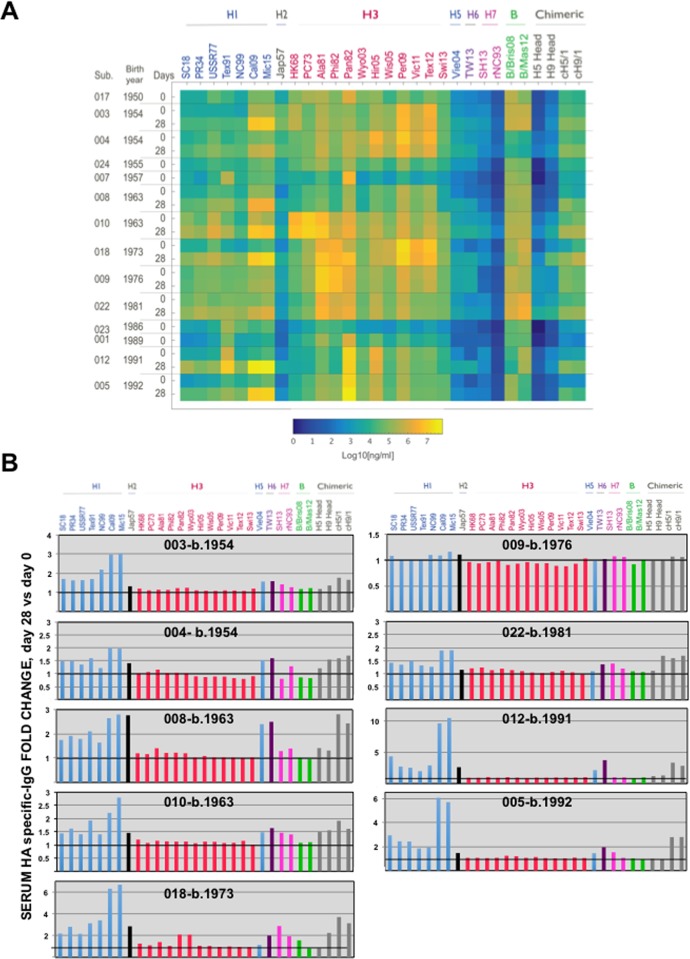
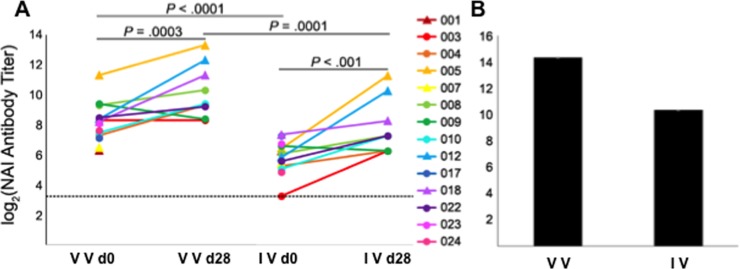
Antigenic drift of the hemagglutinin (HA) and neuraminidase (NA) influenza virus proteins contributes to reduced vaccine efficacy. To analyze antigenic drift in human seasonal H1N1 viruses derived from the 2009 pandemic H1N1 virus (pH1N1-like viruses) accounts for the limited effectiveness (around 40%) of vaccination against pH1N1-like viruses during the 2015-2016 season, nasal washes/swabs collected from adult subjects in the Rochester, NY area, were used to sequence and isolate the circulating viruses. The HA and NA proteins from viruses circulating during the 2015-2016 season encoded eighteen and fourteen amino acid differences, respectively, when compared to A/California/04/2009, a strain circulating at the origin of the 2009 pandemic. The circulating strains belonged to subclade 6B.1, defined by HA amino acid substitutions S101N, S179N, and I233T. Hemagglutination-inhibiting (HAI) and HA-specific neutralizing serum antibody (Ab) titers from around 50% of pH1N1-like virus-infected subjects and immune ferrets were 2-4 fold lower for the 2015-2016 circulating strains compared to the vaccine strain. In addition, using a luminex-based mPlex HA assay, the binding of human sera from subjects infected with pH1N1-like viruses to the HA proteins from circulating and vaccine strains was not identical, strongly suggesting antigenic differences in the HA protein. Additionally, NA inhibition (NAI) Ab titers in human sera from pH1N1-like virus-infected subjects increased after the infection and there were measurable antigenic differences between the NA protein of circulating strains and the vaccine strain using both ferret and human antisera. Despite having been vaccinated, infected subjects exhibited low HAI Ab titers against the vaccine and circulating strains. This suggests that poor responses to the H1N1 component of the vaccine as well as antigenic differences in the HA and NA proteins of currently circulating pH1N1-like viruses could be contributing to risk of infection even after vaccination.


Conflict of interest statement

Competing Interests: The authors have declared that no competing interests exist.

Figures

Fig 1
Fig 1. Mutations present in the HA or NA proteins of 2015–2016 circulating pH1N1-like strains compared to the vaccine strain.
Three-dimensional models of the A/Cal/04/09 HA (A and B) or NA (C and D) proteins (PDB ID: 3LZG and 3NSS, respectively), showing the mutations of circulating pH1N1-like viruses compared to that of the vaccine strain. A top and views of the HA or NA protein quaternary structures are shown. The HA antigenic sites Sa (dark blue), Sb (yellow), Ca1 (light purple), Ca2 (dark purple), and Cb (light blue) are indicated. The HA fusion domain is represented in orange [52,53]. A bracket (not to scale) indicates the location of the NA stalk had it been resolved in the crystal structure. Known antigenic sites on the NA protein are represented in yellow. The mutations present in the HA or NA of pH1N1-like circulating strains compared to that of the H1N1 vaccine strain are shown in red. The approximate location of HA mutation S220T, situated in the Ca1 antigenic site at the subunit interface, is indicated. The ellipse indicates the receptor-binding site (RBS) of the HA (B) or the catalytic site of the NA (D), shown at a higher magnification. 3D model was customized using PyMOL.
Fig 2
Fig 2. dN/dS selection analysis for pH1N1-like HA or NA proteins.
A selection analysis (dN/dS ratio) was performed on 16,990 HA (A and C) or 15,805 NA (B and D) DNA sequences of pH1N1-like strains isolated from humans since 2009, and the dN/dS ratio at each codon along the HA (A) or NA (B) DNA sequence was plotted. The dN/dS ratio for codons at which mutations were found in 2015–2016 isolates are shown in green. The lower bar represents amino acid residues along the HA or NA proteins corresponding to the head domain (gray), the stalk domain (black), the transmembrane domain (TMD) (red), and the cytoplasmic tail (CT) (blue). Three-dimensional model of the HA (PDB ID: 3LZG) (C) or the NA (PDB ID: 3NSS) (D) proteins, with amino acid residues colored according to the dN/dS ratio at the corresponding codon using PyMOL. A bracket (not to scale) indicates the location of the NA stalk had it been resolved in the crystal structure. (E and F) Tables showing the dN/dS ratio for the codons at which amino acid substitutions were present in the HA (E) or NA (F) of pH1N1-like viruses circulating during 2015–2016. Gray shadows indicate codons at positions within known Ab-binding sites.
Fig 3
Fig 3. Frequency of HA amino acid changes found in pH1N1-like viruses over time.
Publicly available sequences of the HA protein of pH1N1-like strains isolated since 2009 (n = 16,990) were analyzed, and were plotted according to the percentage of sequences containing the original (incumbent) amino acid present in the H1N1 vaccine strain (white) or the substitute amino acid (black) in pH1N1-like isolates at positions 100, 200, 338, 214, 220, 391, 114, 468, 202, 516, 300, 273, 180, 13, 101, 179, 233, 472 from each season since early 2009. An (*) next to the amino acid location indicates that the position is in a previously described antigenic site.
Fig 4
Fig 4. Frequency of NA amino acid changes found in pH1N1-like viruses over time.
Publicly available sequences of the NA protein of pH1N1-like strains isolated since 2009 (n = 15,805) were analyzed, and were plotted according to the percentage of sequences containing the original (incumbent) amino acid present in the H1N1 vaccine strain (white) or the substitute amino acid (black) in pH1N1-like isolates at positions 13, 34, 40, 44, 200, 241, 248, 264, 270, 314, 321, 369, 386, and 432 from each season since early 2009. An (*) next to the amino acid location indicates that the position is in a previously described antigenic site.
Fig 5
Fig 5. The genetic relatedness of the HA and NA proteins encoded by pH1N1-like viruses circulating since 2009.
Phylogenetic reconstruction of HA (A, n = 16,990) and NA (B, n = 15,805) proteins encoded by pH1N1-like viruses. Clades are indicated to the left; branches are colored according to season of isolation.
Fig 6
Fig 6. Effect of mutations present in the HA ofin 2015–2016 isolates on the antigenicity of the viral protein.
HAI (A and B) and MN (C and D) assays using human (A and C) and ferret (B and D) antisera. Standardized antisera from ferrets infected with the vaccine virus, and human sera collected from infected subjects at the acute (day 0) and post-acute visits 28 days later (day 28), were measured using HAI or MN assays for antibodies specific for the H1N1 vaccine strain (VV) and the virus isolated from patient 022 (IV). The HA protein of the virus isolated from patient 022 encodes mutations found in the majority of 2015–2016 isolates circulating worldwide (S2 Table and Table 1). Individual subject numbers from which the viruses were isolated are shown in the legend. Subjects whose titers are represented with circles received the 2015–2016 flu vaccine, while those represented with triangles were not vaccinated (see S1 Table). Experiments were repeated three times, showing reproducible data. *, indicates p-values <0.05 using a Student’s t-test in B and D. IV, isolated virus. VV, vaccine virus. HAI Ab titer of 40, commonly associated with protection, is indicated by an arrow in (A) and (B) [62,63]. The dotted line indicates the limit of detection (LoD), at an Ab titer of 10. A titer of 5 was considered for titers that fell below the (LoD).
Fig 7
Fig 7. Binding of serum from pH1N1-infected subjects to HA proteins from different strains.
(A) Concentrations of sera IgG antibodies cross-reacting to each HA protein were measured by multiplex assay against the indicated IAV and IBV HA proteins. Heatmap showing the average Ab concentrations using two human sera dilutions (1:5,000 and 1:10,000) in duplicates. Subject number, subject year of birth and visit of sera extraction (d0 or d28) are indicated on the left. (B) Graphs representing the fold-change in binding to HA proteins using the sera from day 0, compared to the sera from day 28. Each graph represents one subject. For the HA protein strains: Blue colors represent H1N1 strains (A/South Carolina/1/1918, SC18; A/Puerto Rico/8/1934, PR8; A/USSR/90/1977, USSR77; A/Texas/36/1991, Tex91; A/New Caledonia/20/1999, NewCal99; A/California/04/2009, Cal09; A/Michigan/45/2015, Mic15), black color represents an H2N2 strain (A/Japan/305/1957, Jap57), pink colors represent H3N2 strains (A/HongKong/1/1968, HK68; A/Port Chalmers/1/1973, PC73; A/Alabama/1/1981, Ala81; A/Philippines/2/1982, Phi82; A/Panama/7/1999, Pan99; A/Wyoming/2003, Wyo03; A/Hiroshima/52/2005, Hir05; A/Wisconsin/67/2005, Wis05; A/Perth/16/2009, Perth09; A/Victoria/361/2011, Vic11, A/Texas50/2012, Tex12, A/Switzerland/2013, Swit/2013), blue color represents H5N1 (A/Vietnam/1204/2004, Viet04), purple color represents H6N1 (A/Taiwan/2/2013, TW13), fucsia colors represent H7N9 (A/Shanghai/2/2013, SH13 and H7N1 (A/rhea/North Carolina/39842/93, rhea/NC93), green color represent B (B/Brisbane/60//2008, Bris08; B/Phuket/2013, Phu13), and gray colors represent H5, and H9 head, and chimeric proteins cH5/1 and cH9/1.
Fig 8
Fig 8. Effect of mutations present in the NA of 2015–2016 isolates on the antigenicity of the protein.
ELLA assays using human (A) and ferret antisera (B). Standardized antisera from ferrets infected with the vaccine virus, and human sera collected from infected subjects at the acute (day 0) and post-acute visits 28 days later (day 28), were measured using ELLA for NAI antibodies specific for the NA protein of the vaccine strain and the virus isolated from patient 001, which encodes mutations found in the majority of 2015–2016 isolates circulating worldwide. Individual subject numbers from which the viruses were isolated are shown in the legend. Subjects whose titers are represented with circles received the 2015–2016 flu vaccine, while those represented with triangles were not vaccinated. Experiments were repeated three times, showing reproducible data. IV, isolated virus. VV, vaccine virus. The LoD is indicated by the dotted line. Experiments were repeated 3 times, showing reproducible data.

Similar articles

Cited by

References

    1. Webster RG, Bean WJ Jr. (1978) Genetics of influenza virus. Annu Rev Genet 12: 415–431. doi: 10.1146/annurev.ge.12.120178.002215 - DOI - PubMed
    1. Klenk HD, Garten W (1994) Host cell proteases controlling virus pathogenicity. Trends Microbiol 2: 39–43. - PubMed
    1. Wilson IA, Skehel JJ, Wiley DC (1981) Structure of the haemagglutinin membrane glycoprotein of influenza virus at 3 A resolution. Nature 289: 366–373. - PubMed
    1. Caton AJ, Brownlee GG, Yewdell JW, Gerhard W (1982) The antigenic structure of the influenza virus A/PR/8/34 hemagglutinin (H1 subtype). Cell 31: 417–427. - PubMed
    1. Weis W, Brown JH, Cusack S, Paulson JC, Skehel JJ, Wiley DC (1988) Structure of the influenza virus haemagglutinin complexed with its receptor, sialic acid. Nature 333: 426–431. doi: 10.1038/333426a0 - DOI - PubMed

Substances