Comparative Analysis of the Growth Pattern of Thyroid Cancer in Young Patients Screened by Ultrasonography in Japan After a Nuclear Accident: The Fukushima Health Management Survey
- PMID: 29145557
- PMCID: PMC5833594
- DOI: 10.1001/jamaoto.2017.2133
Comparative Analysis of the Growth Pattern of Thyroid Cancer in Young Patients Screened by Ultrasonography in Japan After a Nuclear Accident: The Fukushima Health Management Survey
Abstract
Importance: Thyroid cancer generally grows at a very slow rate in adults, and overdiagnosis is a global issue. However, the detection of early-stage thyroid cancer by screening is not well described in young patients. To prevent overdiagnosis, it is essential to understand the natural course of thyroid cancer growth detection by ultrasonography screening in young patients.
Objective: To evaluate the natural progression of thyroid cancer in young patients.
Design, setting, and participants: An observational study evaluated changes in the diameter of malignant or suspected malignant thyroid tumors on 2 occasions. Changes in malignant thyroid tumor diameter were estimated during the observation period between the screening and confirmatory examinations in the first-round thyroid ultrasonography examination of the Fukushima Health Management Survey in patients younger than 21 years after a nuclear accident at a power plant in Fukushima, Japan. In total, 116 patients cytologically diagnosed with or suspected to have thyroid cancer were classified into 3 groups based on a greater than 10% reduction, a change of -10% to +10% in diameter, and a greater than 10% increase in tumor diameter. The association between tumor growth rate and tumor diameter was analyzed. The study was conducted from March 1, 2016, to August 6, 2017.
Main outcomes and measures: Tumor volume changes, the coefficient of growth of thyroid cancer in young patients, and the association between the observation period or tumor diameter and them.
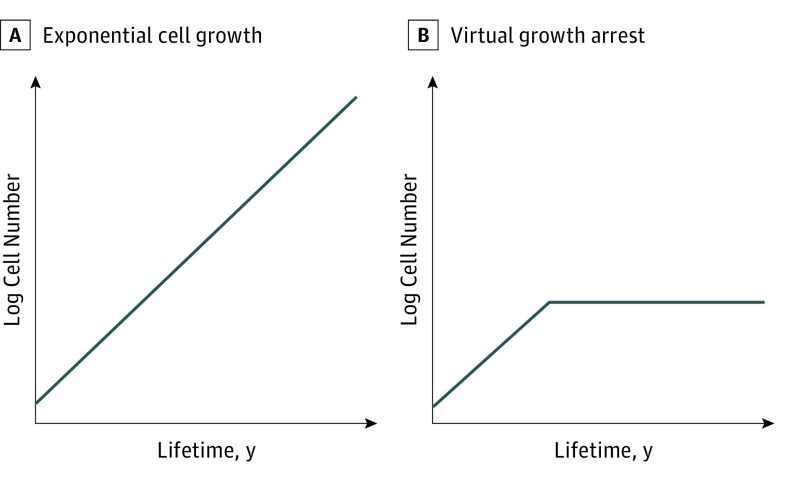
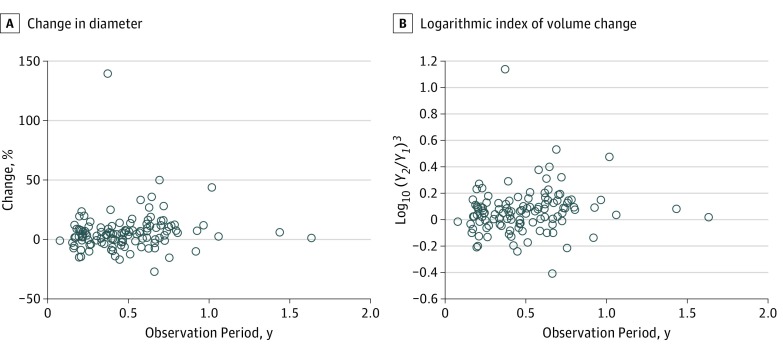
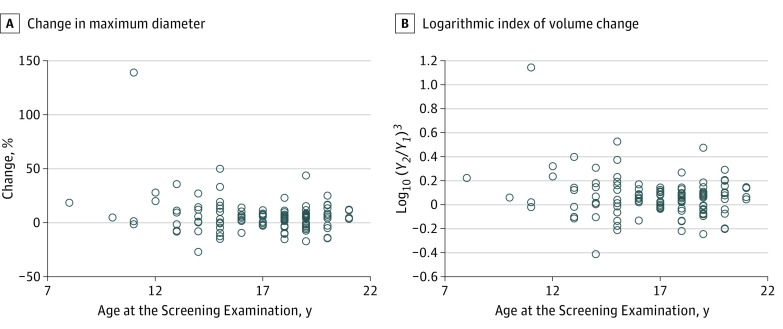
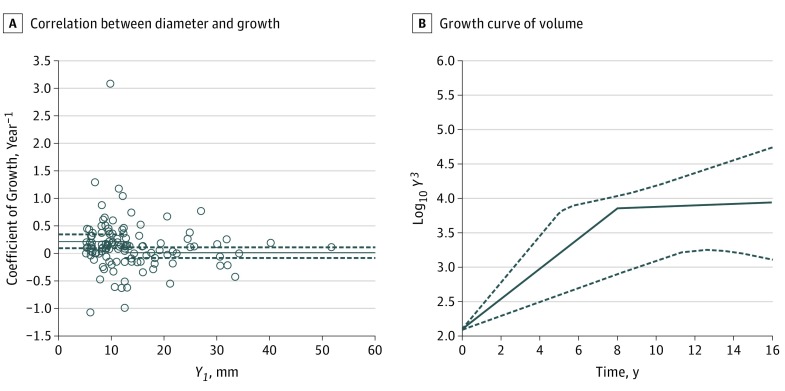
Results: Of 116 patients, 77 were female; the mean age was 16.9 years (median, 17.5 years). The mean observation period was 0.488 (range, 0.077-1.632) years. No significant differences in age, sex, tumor diameter, observation period, or serum levels of thyrotropin and thyroglobulin were observed among the groups. Whereas tumor volume changes were not linearly correlated with the observation period (Pearson R = 0.121; 95% CI, -0.062 to 0.297), the coefficient of growth was significantly and negatively correlated with the tumor diameter in the screening examination (Spearman ρ = -0.183; 95% CI, -0.354 to -0.001), suggesting growth arrest after the initial proliferation phase.
Conclusions and relevance: Ultrasonography screening could reveal asymptomatic thyroid cancer that is falling into a growth arrest pattern in many young patients. Considering the long life expectancy, prevention of overdiagnosis necessitates careful long-term monitoring without immediate diagnosis for suspected noninvasive thyroid cancer.
Conflict of interest statement
Figures
Comment in
- doi: 10.1001/jamaoto.2017.2157
Similar articles
-
A Comprehensive Review of the Progress and Evaluation of the Thyroid Ultrasound Examination Program, the Fukushima Health Management Survey.J Epidemiol. 2022;32(Suppl_XII):S23-S35. doi: 10.2188/jea.JE20210271. J Epidemiol. 2022. PMID: 36464297 Free PMC article. Review.
-
Incidence of Thyroid Cancer Among Children and Young Adults in Fukushima, Japan, Screened With 2 Rounds of Ultrasonography Within 5 Years of the 2011 Fukushima Daiichi Nuclear Power Station Accident.JAMA Otolaryngol Head Neck Surg. 2019 Jan 1;145(1):4-11. doi: 10.1001/jamaoto.2018.3121. JAMA Otolaryngol Head Neck Surg. 2019. PMID: 30489622 Free PMC article.
-
Young people's perspectives of thyroid cancer screening and its harms after the nuclear accident in Fukushima Prefecture: a questionnaire survey indicating opt-out screening strategy of the thyroid examination as an ethical issue.BMC Cancer. 2022 Mar 3;22(1):235. doi: 10.1186/s12885-022-09341-6. BMC Cancer. 2022. PMID: 35241012 Free PMC article.
-
Findings of Thyroid Ultrasound Examination Within 3 Years After the Fukushima Nuclear Power Plant Accident: The Fukushima Health Management Survey.J Clin Endocrinol Metab. 2018 Mar 1;103(3):861-869. doi: 10.1210/jc.2017-01603. J Clin Endocrinol Metab. 2018. PMID: 29253182
-
Demonstrating the undermining of science and health policy after the Fukushima nuclear accident by applying the Toolkit for detecting misused epidemiological methods.Environ Health. 2022 Aug 24;21(1):77. doi: 10.1186/s12940-022-00884-6. Environ Health. 2022. PMID: 36002833 Free PMC article. Review.
Cited by
-
Overdiagnosis of Juvenile Thyroid Cancer.Eur Thyroid J. 2020 May;9(3):124-131. doi: 10.1159/000503323. Epub 2019 Oct 16. Eur Thyroid J. 2020. PMID: 32518765 Free PMC article. Review.
-
Communicating with residents about 10 years of scientific progress in understanding thyroid cancer risk in children after the Fukushima Dai-ichi Nuclear Power Station accident.J Radiat Res. 2021 May 5;62(Supplement_1):i7-i14. doi: 10.1093/jrr/rraa097. J Radiat Res. 2021. PMID: 33978170 Free PMC article.
-
No increase in translocated chromosomal aberrations, an indicator of ionizing radiation exposure, in childhood thyroid cancer in Fukushima Prefecture.Sci Rep. 2023 Aug 31;13(1):14254. doi: 10.1038/s41598-023-41501-x. Sci Rep. 2023. PMID: 37652956 Free PMC article.
-
A Comprehensive Review of the Progress and Evaluation of the Thyroid Ultrasound Examination Program, the Fukushima Health Management Survey.J Epidemiol. 2022;32(Suppl_XII):S23-S35. doi: 10.2188/jea.JE20210271. J Epidemiol. 2022. PMID: 36464297 Free PMC article. Review.
-
Factors Influencing the Proportion of Non-examinees in the Fukushima Health Management Survey for Childhood and Adolescent Thyroid Cancer: Results From the Baseline Survey.J Epidemiol. 2020 Jul 7;30(7):301-308. doi: 10.2188/jea.JE20180247. Epub 2019 Jun 15. J Epidemiol. 2020. PMID: 31204362 Free PMC article.
References
-
- Welch HG, Black WC. Overdiagnosis in cancer. J Natl Cancer Inst. 2010;102(9):605-613. - PubMed
-
- Bibbins-Domingo K, Grossman DC, Curry SJ, et al. ; US Preventive Services Task Force . Screening for thyroid cancer: US Preventive Services Task Force Recommendation statement. JAMA. 2017;317(18):1882-1887. - PubMed
-
- Lin JS, Bowles EJA, Williams SB, Morrison CC. Screening for thyroid cancer: updated evidence report and systematic review for the US Preventive Services Task Force. JAMA. 2017;317(18):1888-1903. - PubMed
-
- Vaccarella S, Franceschi S, Bray F, Wild CP, Plummer M, Dal Maso L. Worldwide thyroid-cancer epidemic? the increasing impact of overdiagnosis. N Engl J Med. 2016;375(7):614-617. - PubMed
-
- Furuya-Kanamori L, Bell KJ, Clark J, Glasziou P, Doi SA. Prevalence of differentiated thyroid cancer in autopsy studies over six decades: a meta-analysis. J Clin Oncol. 2016;34(30):3672-3679. - PubMed
LinkOut - more resources
Full Text Sources
Other Literature Sources