Cortical and Subcortical Brain Morphometry Differences Between Patients With Autism Spectrum Disorder and Healthy Individuals Across the Lifespan: Results From the ENIGMA ASD Working Group
- PMID: 29145754
- PMCID: PMC6546164
- DOI: 10.1176/appi.ajp.2017.17010100
Cortical and Subcortical Brain Morphometry Differences Between Patients With Autism Spectrum Disorder and Healthy Individuals Across the Lifespan: Results From the ENIGMA ASD Working Group
Abstract
Objective: Neuroimaging studies show structural differences in both cortical and subcortical brain regions in children and adults with autism spectrum disorder (ASD) compared with healthy subjects. Findings are inconsistent, however, and it is unclear how differences develop across the lifespan. The authors investigated brain morphometry differences between individuals with ASD and healthy subjects, cross-sectionally across the lifespan, in a large multinational sample from the Enhancing Neuroimaging Genetics Through Meta-Analysis (ENIGMA) ASD working group.
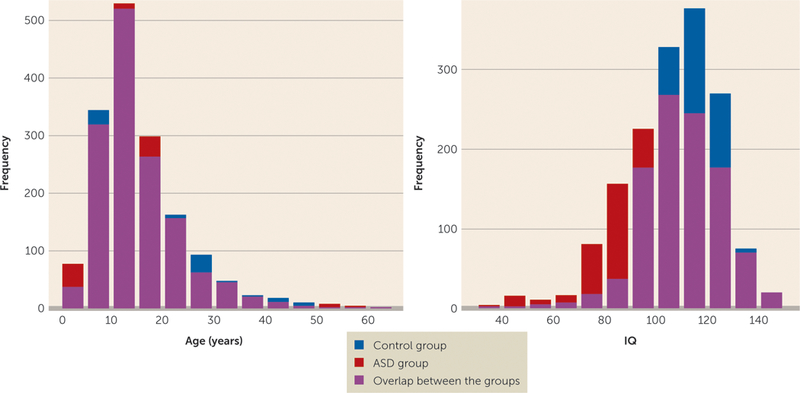
Method: The sample comprised 1,571 patients with ASD and 1,651 healthy control subjects (age range, 2-64 years) from 49 participating sites. MRI scans were preprocessed at individual sites with a harmonized protocol based on a validated automated-segmentation software program. Mega-analyses were used to test for case-control differences in subcortical volumes, cortical thickness, and surface area. Development of brain morphometry over the lifespan was modeled using a fractional polynomial approach.
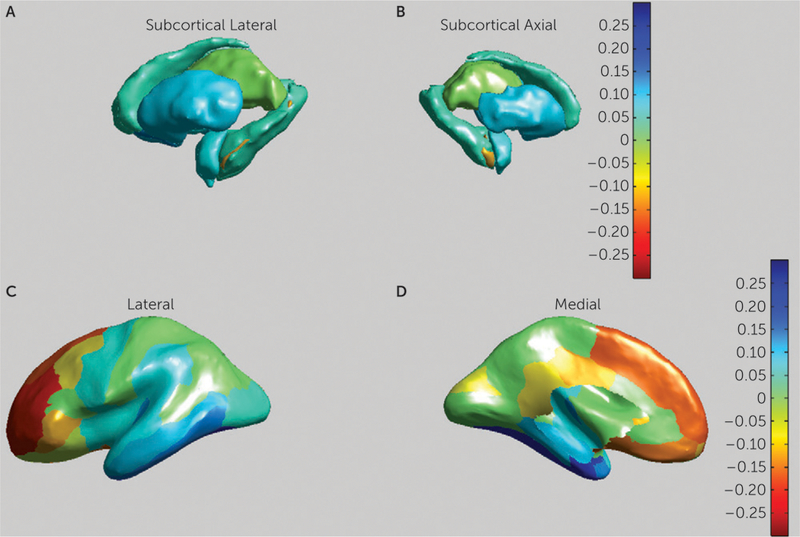
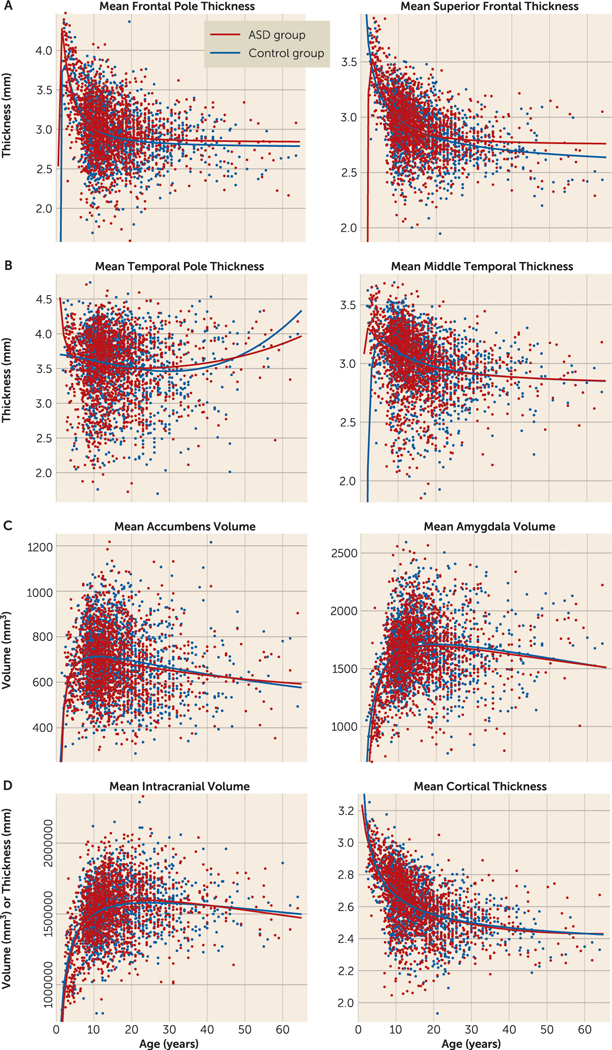
Results: The case-control mega-analysis demonstrated that ASD was associated with smaller subcortical volumes of the pallidum, putamen, amygdala, and nucleus accumbens (effect sizes [Cohen's d], 0.13 to -0.13), as well as increased cortical thickness in the frontal cortex and decreased thickness in the temporal cortex (effect sizes, -0.21 to 0.20). Analyses of age effects indicate that the development of cortical thickness is altered in ASD, with the largest differences occurring around adolescence. No age-by-ASD interactions were observed in the subcortical partitions.
Conclusions: The ENIGMA ASD working group provides the largest study of brain morphometry differences in ASD to date, using a well-established, validated, publicly available analysis pipeline. ASD patients showed altered morphometry in the cognitive and affective parts of the striatum, frontal cortex, and temporal cortex. Complex developmental trajectories were observed for the different regions, with a developmental peak around adolescence. These findings suggest an interplay in the abnormal development of the striatal, frontal, and temporal regions in ASD across the lifespan.
Keywords: Autism; Brain Morphology; ENIGMA; Lifespan.
Figures
References
-
- Baird G, Simonoff E, Pickles A, et al. : Prevalence of disorders of the autism spectrum in a population cohort of children in South Thames: the Special Needs and Autism Project (SNAP). Lancet 2006; 368: 210–215 - PubMed
-
- American Psychiatric Association: Diagnostic and Statistical Manual of Mental Disorders, Fifth Edition (DSM-5). Washington, DC, American Psychiatric Association; 2013
-
- Amaral DG, Schumann CM, Nordahl CW: Neuroanatomy of autism. Trends Neurosci 2008; 31:137–145 - PubMed
-
- Courchesne E, Pierce K, Schumann CM, et al. : Mapping early brain development in autism. Neuron 2007; 56:399–413 - PubMed
Publication types
MeSH terms
Grants and funding
LinkOut - more resources
Full Text Sources
Other Literature Sources
Medical
Miscellaneous