. 2017 Nov 16;7(1):26.
doi: 10.1186/s13395-017-0143-9.

Are mice good models for human neuromuscular disease? Comparing muscle excursions in walking between mice and humans

Affiliations

Are mice good models for human neuromuscular disease? Comparing muscle excursions in walking between mice and humans

Xiao Hu et al. Skelet Muscle. .

Abstract

Background: The mouse is one of the most widely used animal models to study neuromuscular diseases and test new therapeutic strategies. However, findings from successful pre-clinical studies using mouse models frequently fail to translate to humans due to various factors. Differences in muscle function between the two species could be crucial but often have been overlooked. The purpose of this study was to evaluate and compare muscle excursions in walking between mice and humans.

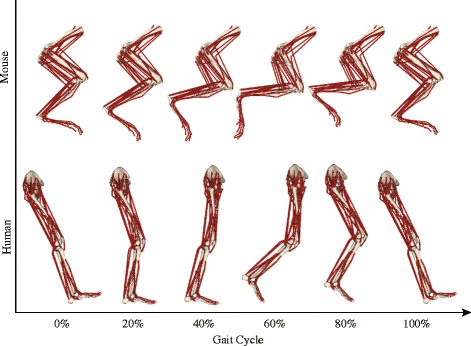
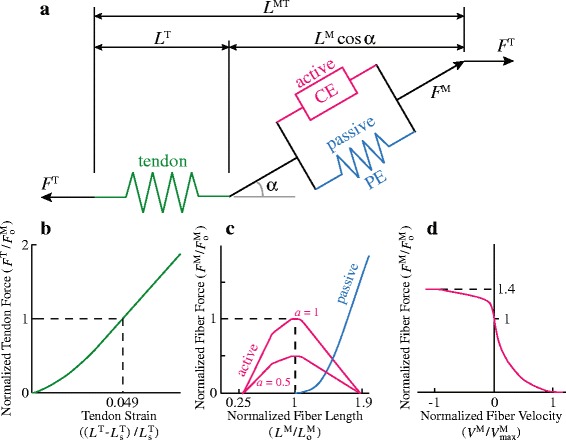
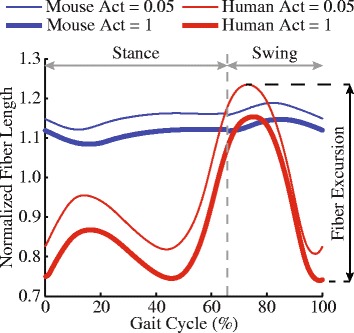
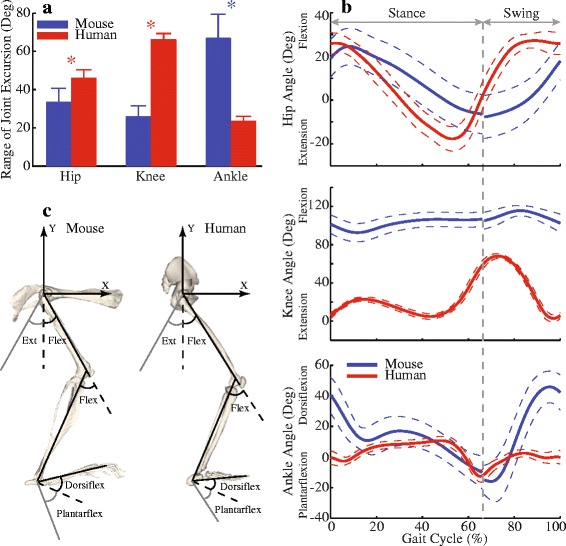
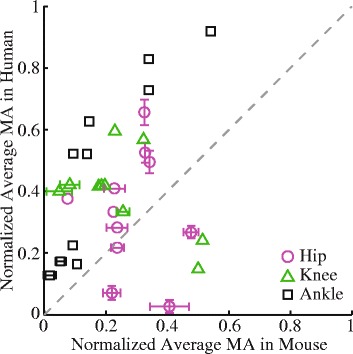
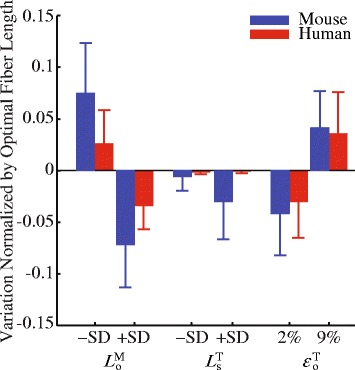
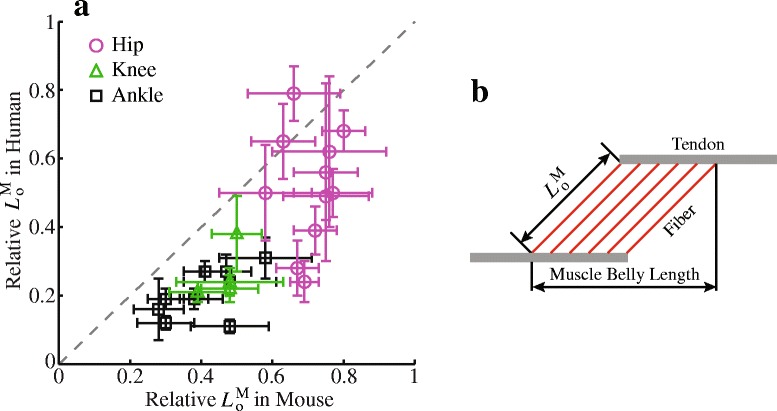
Methods: Recently published musculoskeletal models of the mouse hindlimb and human lower limb were used to simulate muscle-tendon dynamics during mouse and human walking, a key daily activity. Muscle fiber length changes (fiber excursions) of 25 muscle homologs in the two species were calculated from these simulations and then compared. To understand potential causes of differences in fiber excursions in walking, joint excursions and muscle moment arms were also compared across one gait cycle.

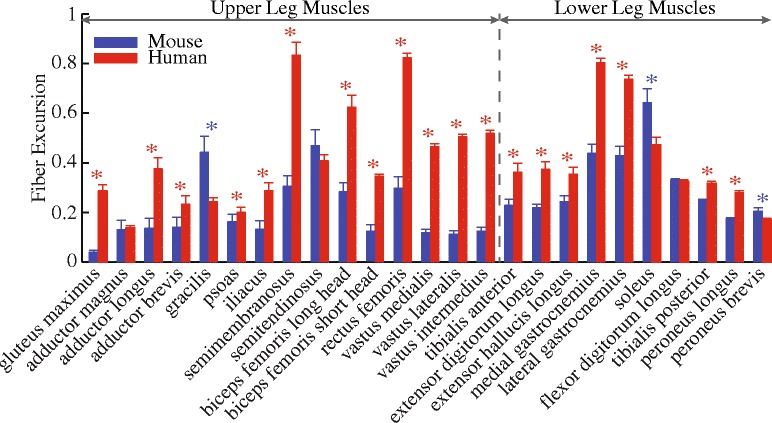
Results: Most muscles (19 out of 25 muscles) of the mouse hindlimb had much smaller fiber excursions as compared to human lower limb muscles during walking. For these muscles, fiber excursions in mice were only 48 ± 19% of those in humans. The differences in fiber excursion between the two species were primarily due to the reduced joint excursions and smaller muscle moment arms in mice as compared to humans.

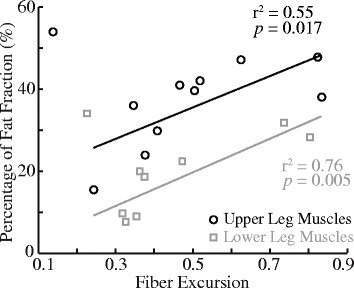
Conclusions: Since progressive neuromuscular diseases, such as Duchenne muscular dystrophy, are known to be accelerated by damage accumulated from active muscle lengthening, these results suggest that biomechanical differences in muscle function during walking between mice and humans may impede the translations of knowledge gained from mouse models to humans. This knowledge would add a fresh perspective on how pre-clinical studies on mice might be better designed to improve translation to human clinical trials.

Keywords: Biomechanics; Duchenne muscular dystrophy; Mice; Muscle fiber excursion; Musculoskeletal simulation; Neuromuscular diseases; Walking gait.


Conflict of interest statement

Ethics approval and consent to participate

Not applicable

Consent for publication

Not applicable.

Competing interests

The authors declare that they have no competing interests.

Publisher’s Note

Springer Nature remains neutral with regard to jurisdictional claims in published maps and institutional affiliations.

Figures

Fig. 1
Fig. 1
Musculoskeletal models (right side; lateral view) of the mouse hindlimb and human lower limb during one gait cycle. Each muscle was represented by one or multiple line-segment muscle-tendon units. The mechanical properties of each muscle-tendon unit were characterized by a Hill-type muscle model [35], which used separate elements to represent tendon and muscle fiber (Fig. 2)
Fig. 2
Fig. 2
The contraction dynamics and force-generating capacity of each muscle-tendon unit was represented by a Hill-type muscle model [35]. (a) The total muscle-tendon length (L MT) was a function of the geometric pose of the musculoskeletal models of mouse hindlimb and human lower limb. The muscle model computes muscle fiber length (L M), muscle pennation angle (α), tendon length (L T), muscle fiber force (F M), and tendon force (F T) based on L MT, muscle activation (a), and the force equilibrium constraints between F M and F T. (b) Tendon was modeled as a non-linear, passive series elastic element, whose mechanical property was defined by the tendon force-strain curve. In this curve, it was assumed that tendon strain (ε T) is 4.9% when muscle fiber developed maximum isometric force (FoM). Tendon strain was calculated from the muscle-specific tendon slack length (LsT). (c) Muscle fiber was modeled as an active contractile element (CE) in parallel with a passive elastic element (PE). The active force-length curve was scaled by muscle-specific optimal fiber length (LoM) and then used to compute active isometric fiber force based on L M and activation (a). The passive force-length curve was also scaled by LoM and then used to compute passive fiber force based on L M. (d) The active isometric fiber force was scaled based on fiber velocity (V M) normalized by maximum shortening velocity (VmaxM) of the muscle. Total muscle force was calculated as the sum of active and passive fiber force
Fig. 3
Fig. 3
Simulated fiber length changes of the vastus lateralis muscle in dynamic models of mouse and human during one gait cycle. Fiber excursion in walking was defined as the difference between the maximum fiber length when activation (Act) was 0.05 and the minimum fiber length when activation was 1
Fig. 4
Fig. 4
Comparison of the fiber excursions (mean and standard deviation) during walking between mice and humans. Blue stars indicate mice have larger excursions, while red stars indicate humans have larger excursions (p < 0.05)
Fig. 5
Fig. 5
Comparison of the joint angles during one gait cycle between mice and humans. (a) Comparison of ranges of joint excursions (mean and standard deviation) at the hip, knee, and ankle joints between mice and humans. Blue stars indicate mice have larger ranges, while red stars indicate humans have larger ranges (p < 0.05). (b) Average of joint angles during one gait cycle (solid curves), from heel strike to heel strike. Dashed curves indicate ± standard deviation. Original gait data for mice started with toe-off. To be consistent with general gait data representation, the swing phase data from mice were manually moved to be after the stance phase. Vertical dashed line indicates toe-off at about 65% of a gait cycle for mice and humans. (c) Definition of the flexions and extensions at the hip, knee, and ankle joints. The flexion of the hip joint was defined relative to the coordinates of the pelvis (shown). Flex flexion, Ext extension, Dorsiflex dorsiflexion, Plantarflex plantarflexion
Fig. 6
Fig. 6
Comparison of average normalized moment arms (MA) of muscles crossing the hip, knee, and ankle joints in one gait cycle between mice and humans. Each symbol is one muscle. The dashed line is the unity line representing equal moment arms between mice and humans. Standard deviations that are smaller than the symbol are not shown
Fig. 7
Fig. 7
Muscle excursion was highly correlated with fat fraction for both upper leg and lower leg muscles, respectively, in patients with DMD. Fiber excursion was from Fig. 4 (red bars), and fat fraction, a metric of the extent of muscle degeneration, was measured from patients with DMD in a previous magnetic resonance imaging study (see Fig. 2 in [53]). Each circle and square represents one upper leg and lower leg muscle
Fig. 8
Fig. 8
Sensitivity analyses on the parameters (mean and standard deviation) of the Hill-type muscle model, including optimal fiber length (LoM), tendon slack length (LsT), and tendon strain (εoT). The LoM and LsT values were both altered by ±1 standard deviation. The εoT value was altered based on plausible ranges reported in the literature from 2 to 9% (see Sensitivity analyses)
Fig. 9
Fig. 9
Relative optimal fiber length LoM in mice and humans. (a) Comparison of relative LoM of muscles crossing the hip, knee, and ankle joints between mice and humans. Mean and standard deviation of relative LoM plotted in (a) were taken directly from Tables 3 and 4 in [41] and Table 3 in [46] for the muscles of mouse hindlimb and human lower limb, respectively. Each symbol is one muscle. The dashed line is the unity line representing the equal relative LoM between mice and humans. (b) Relative LoM was defined as LoM normalized by muscle belly length, which was the distance from the origin of the most proximal fibers to insertion of the most distal fibers

References

    1. Partridge TA. The mdx mouse model as a surrogate for Duchenne muscular dystrophy. FEBS J. 2013;280:4177–4186. doi: 10.1111/febs.12267. - DOI - PMC - PubMed
    1. Sicinski P, Geng Y, Ryder-Cook AS, Barnard EA, Darlison MG, Barnard PJ. The molecular basis of muscular dystrophy in the mdx mouse: a point mutation. Science. 1989;244:1578–1580. doi: 10.1126/science.2662404. - DOI - PubMed
    1. Gurney ME, Pu H, Chiu AY, Dal Canto MC, Polchow CY, Alexander DD, Caliendo J, Hentati A, Kwon YW, Deng HX, et al. Motor neuron degeneration in mice that express a human Cu, Zn superoxide dismutase mutation. Science. 1994;264:1772–1775. doi: 10.1126/science.8209258. - DOI - PubMed
    1. Burgess RW, Cox GA, Seburn KL. Neuromuscular disease models and analysis. Methods Mol Biol. 2016;1438:349–394. doi: 10.1007/978-1-4939-3661-8_19. - DOI - PubMed
    1. Hsieh-Li HM, Chang J-G, Jong Y-J, M-H W, Wang NM, Tsai CH, Li H. A mouse model for spinal muscular atrophy. Nat Genet. 2000;24:66–70. doi: 10.1038/71709. - DOI - PubMed