

Normalization of the microbiota in patients after treatment for colonic lesions
- PMID: 29145893
- PMCID: PMC5689185
- DOI: 10.1186/s40168-017-0366-3
Normalization of the microbiota in patients after treatment for colonic lesions
Abstract
Background: Colorectal cancer is a worldwide health problem. Despite growing evidence that members of the gut microbiota can drive tumorigenesis, little is known about what happens to it after treatment for an adenoma or carcinoma. This study tested the hypothesis that treatment for adenoma or carcinoma alters the abundance of bacterial populations associated with disease to those associated with a normal colon. We tested this hypothesis by sequencing the 16S rRNA genes in the feces of 67 individuals before and after treatment for adenoma (N = 22), advanced adenoma (N = 19), and carcinoma (N = 26).
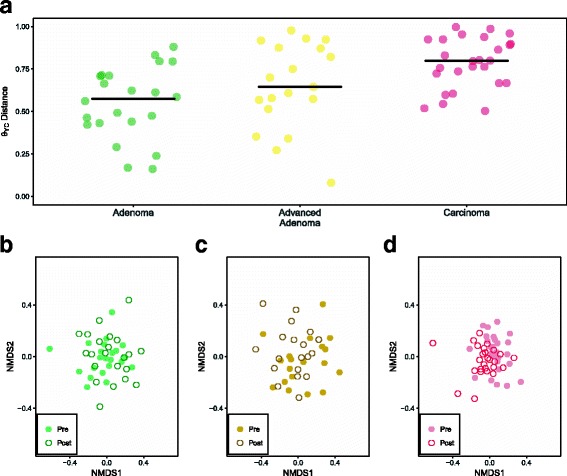
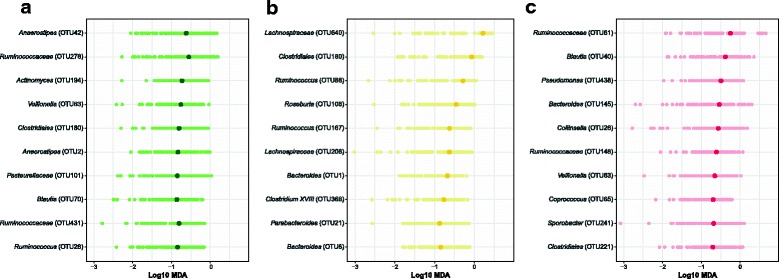
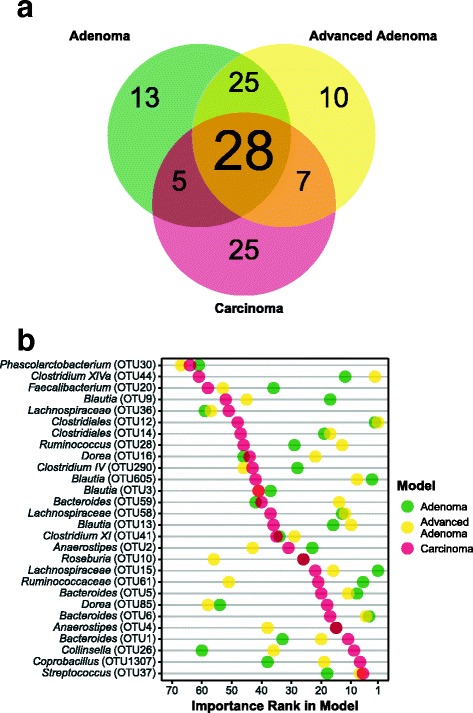
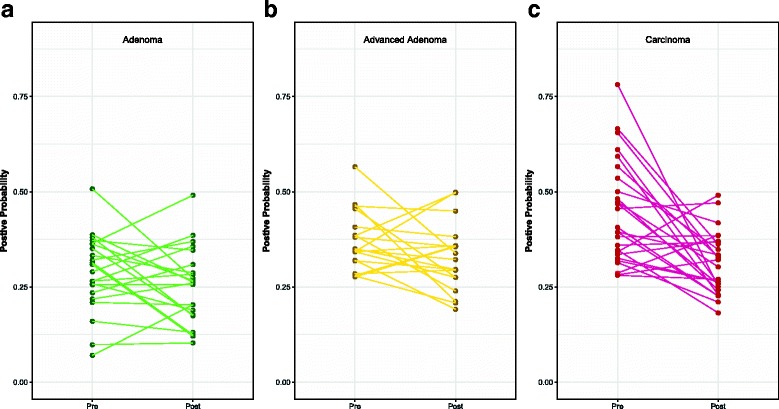
Results: There were small changes to the bacterial community associated with adenoma or advanced adenoma and large changes associated with carcinoma. The communities from patients with carcinomas changed significantly more than those with adenoma following treatment (P value < 0.001). Although treatment was associated with intrapersonal changes, the change in the abundance of individual OTUs in response to treatment was not consistent within diagnosis groups (P value > 0.05). Because the distribution of OTUs across patients and diagnosis groups was irregular, we used the random forest machine learning algorithm to identify groups of OTUs that could be used to classify pre and post-treatment samples for each of the diagnosis groups. Although the adenoma and carcinoma models could reliably differentiate between the pre- and post-treatment samples (P value < 0.001), the advanced-adenoma model could not (P value = 0.61). Furthermore, there was little overlap between the OTUs that were indicative of each treatment. To determine whether individuals who underwent treatment were more likely to have OTUs associated with normal colons we used a larger cohort that contained individuals with normal colons and those with adenomas, advanced adenomas, and carcinomas. We again built random forest models and measured the change in the positive probability of having one of the three diagnoses to assess whether the post-treatment samples received the same classification as the pre-treatment samples. Samples from patients who had carcinomas changed toward a microbial milieu that resembles the normal colon after treatment (P value < 0.001). Finally, we were unable to detect any significant differences in the microbiota of individuals treated with surgery alone and those treated with chemotherapy or chemotherapy and radiation (P value > 0.05).
Conclusions: By better understanding the response of the microbiota to treatment for adenomas and carcinomas, it is likely that biomarkers will eventually be validated that can be used to quantify the risk of recurrence and the likelihood of survival. Although it was difficult to identify significant differences between pre- and post-treatment samples from patients with adenoma and advanced adenoma, this was not the case for carcinomas. Not only were there large changes in pre- versus post-treatment samples for those with carcinoma, but also these changes were toward a more normal microbiota.
Keywords: Colorectal cancer; Microbiota; Polyps; Risk factor; Treatment.
Conflict of interest statement
Ethics approval and consent to participate
The University of Michigan Institutional Review Board approved this study, and all subjects provided informed consent. This study conformed to the guidelines of the Helsinki Declaration.
Consent for publication
Not applicable.
Competing interests
The authors declare that they have no competing interests.
Publisher’s Note
Springer Nature remains neutral with regard to jurisdictional claims in published maps and institutional affiliations.
Figures
Similar articles
-
Leveraging Existing 16S rRNA Gene Surveys To Identify Reproducible Biomarkers in Individuals with Colorectal Tumors.mBio. 2018 Jun 5;9(3):e00630-18. doi: 10.1128/mBio.00630-18. mBio. 2018. PMID: 29871916 Free PMC article.
-
The gut microbiota in conventional and serrated precursors of colorectal cancer.Microbiome. 2016 Dec 30;4(1):69. doi: 10.1186/s40168-016-0218-6. Microbiome. 2016. PMID: 28038683 Free PMC article.
-
Moderate alteration to gut microbiota brought by colorectal adenoma resection.J Gastroenterol Hepatol. 2019 Oct;34(10):1758-1765. doi: 10.1111/jgh.14735. Epub 2019 Jun 18. J Gastroenterol Hepatol. 2019. PMID: 31115072
-
Gut microbiota alterations in colorectal adenoma-carcinoma sequence based on 16S rRNA gene sequencing: A systematic review and meta-analysis.Microb Pathog. 2024 Oct;195:106889. doi: 10.1016/j.micpath.2024.106889. Epub 2024 Aug 26. Microb Pathog. 2024. PMID: 39197689
-
Systematic review: Gut microbiota in fecal samples and detection of colorectal neoplasms.Gut Microbes. 2018 Jul 4;9(4):293-307. doi: 10.1080/19490976.2018.1445957. Epub 2018 May 15. Gut Microbes. 2018. PMID: 29543545 Free PMC article.
Cited by
-
The potential of fecal microbiota and amino acids to detect and monitor patients with adenoma.Gut Microbes. 2022 Jan-Dec;14(1):2038863. doi: 10.1080/19490976.2022.2038863. Gut Microbes. 2022. PMID: 35188868 Free PMC article.
-
Role of gut microbiota-immunity axis in patients undergoing surgery for colorectal cancer: Focus on short and long-term outcomes.World J Gastroenterol. 2020 May 28;26(20):2498-2513. doi: 10.3748/wjg.v26.i20.2498. World J Gastroenterol. 2020. PMID: 32523307 Free PMC article. Review.
-
Gut Microbiota Analysis in Postoperative Lynch Syndrome Patients.Front Microbiol. 2019 Jul 30;10:1746. doi: 10.3389/fmicb.2019.01746. eCollection 2019. Front Microbiol. 2019. PMID: 31417532 Free PMC article.
-
Microbiota Effect on Trimethylamine N-Oxide Production: From Cancer to Fitness-A Practical Preventing Recommendation and Therapies.Nutrients. 2023 Jan 21;15(3):563. doi: 10.3390/nu15030563. Nutrients. 2023. PMID: 36771270 Free PMC article. Review.
-
Surgical Treatment for Colorectal Cancer Partially Restores Gut Microbiome and Metabolome Traits.mSystems. 2022 Apr 26;7(2):e0001822. doi: 10.1128/msystems.00018-22. Epub 2022 Mar 21. mSystems. 2022. PMID: 35311577 Free PMC article.
References
-
- Siegel RL, Miller KD, Jemal A. Cancer statistics, 2016. CA: Cancer J Clin. 2016;66:7–30. - PubMed
-
- Howlader N, Noone AM, Krapcho M, Miller D, Bishop K, Kosary CL, Yu M, Ruhl J, Tatalovich Z, Mariotto A, Lewis DR, Chen HS, Feuer EJ, Cronin KA, (eds).SEER Cancer Statistics Review, 1975-2014, National Cancer Institute. Bethesda, MD. https://seer.cancer.gov/csr/1975_2014/.
MeSH terms
Substances
Grants and funding
LinkOut - more resources
Full Text Sources
Other Literature Sources
Medical
