. 2018 Jan;39(1):138-144.
doi: 10.3174/ajnr.A5440. Epub 2017 Nov 16.

Dynamic Contrast-Enhanced MRI-Derived Intracellular Water Lifetime (τ i ): A Prognostic Marker for Patients with Head and Neck Squamous Cell Carcinomas

Affiliations

Dynamic Contrast-Enhanced MRI-Derived Intracellular Water Lifetime (τ i ): A Prognostic Marker for Patients with Head and Neck Squamous Cell Carcinomas

S Chawla et al. AJNR Am J Neuroradiol. 2018 Jan.

Abstract

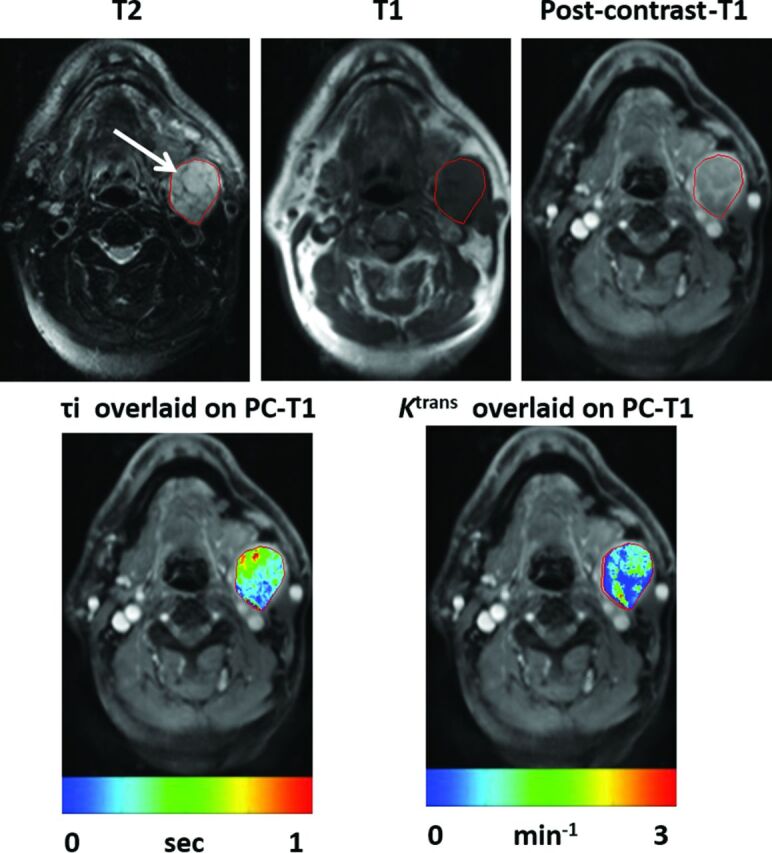
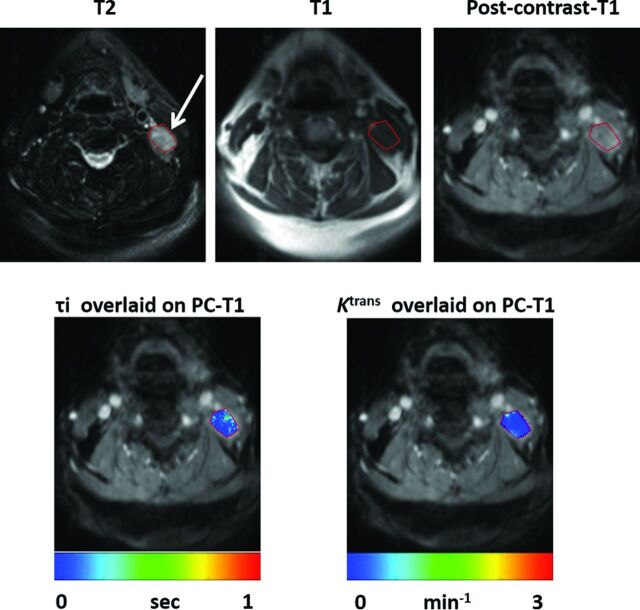
Background and purpose: Shutter-speed model analysis of dynamic contrast-enhanced MR imaging allows estimation of mean intracellular water molecule lifetime (a measure of cellular energy metabolism) and volume transfer constant (a measure of hemodynamics). The purpose of this study was to investigate the prognostic utility of pretreatment mean intracellular water molecule lifetime and volume transfer constant in predicting overall survival in patients with squamous cell carcinomas of the head and neck and to stratify p16-positive patients based upon survival outcome.

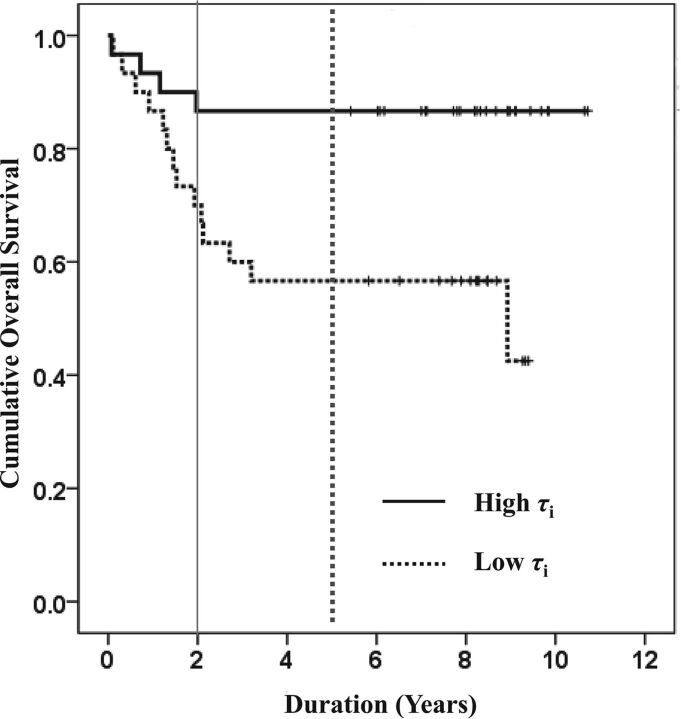
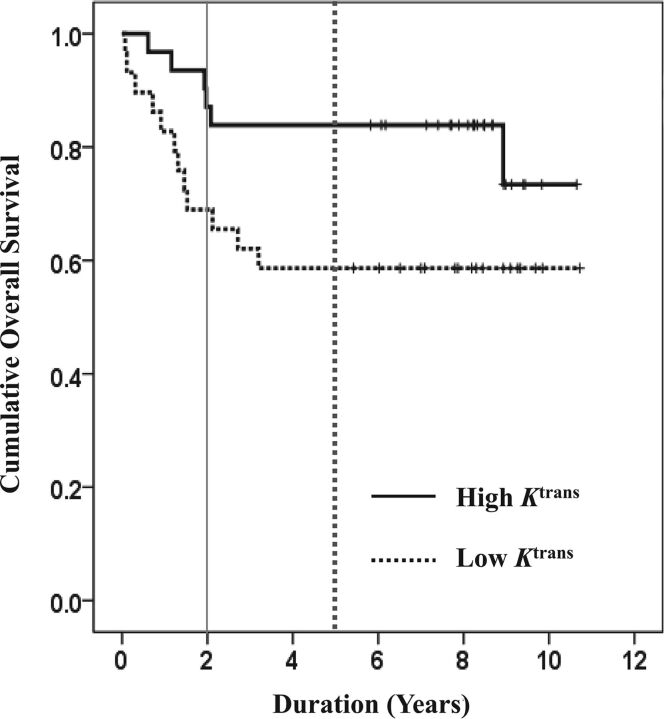
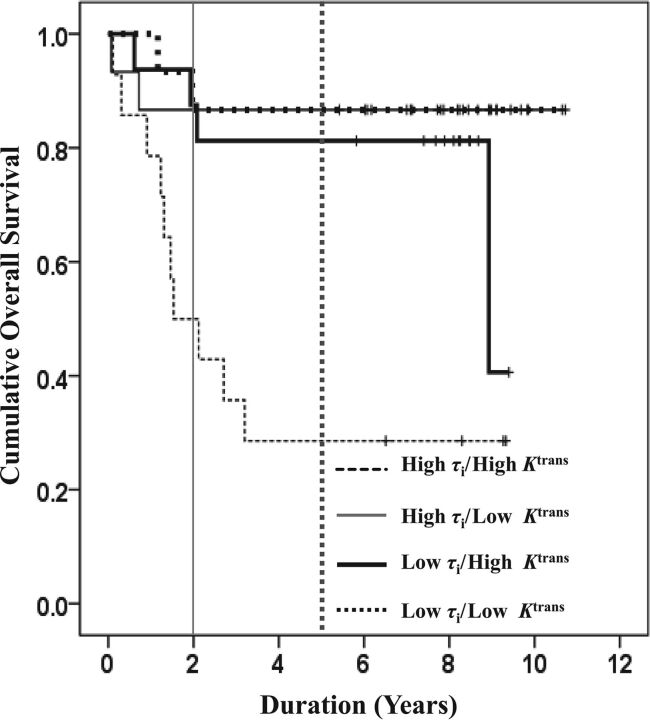
Materials and methods: A cohort of 60 patients underwent dynamic contrast-enhanced MR imaging before treatment. Median, mean intracellular water molecule lifetime and volume transfer constant values from metastatic nodes were computed from each patient. Kaplan-Meier analyses were performed to associate mean intracellular water molecule lifetime and volume transfer constant and their combination with overall survival for the first 2 years, 5 years, and beyond (median duration, >7 years).

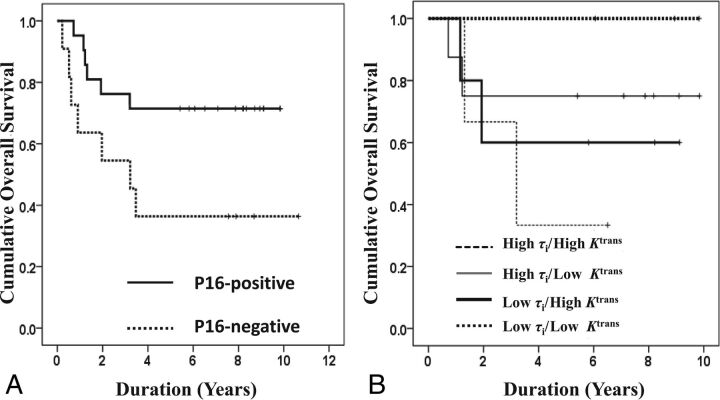
Results: By the last date of observation, 18 patients had died, and median follow-up for surviving patients (n = 42) was 8.32 years. Patients with high mean intracellular water molecule lifetime (4 deaths) had significantly (P = .01) prolonged overall survival by 5 years compared with those with low mean intracellular water molecule lifetime (13 deaths). Similarly, patients with high mean intracellular water molecule lifetime (4 deaths) had significantly (P = .006) longer overall survival at long-term duration than those with low mean intracellular water molecule lifetime (14 deaths). However, volume transfer constant was a significant predictor for only the 5-year follow-up period. There was some evidence (P < .10) to suggest that mean intracellular water molecule lifetime and volume transfer constant were associated with overall survival for the first 2 years. Patients with high mean intracellular water molecule lifetime and high volume transfer constant were associated with significantly (P < .01) longer overall survival compared with other groups for all follow-up periods. In addition, p16-positive patients with high mean intracellular water molecule lifetime and high volume transfer constant demonstrated a trend toward the longest overall survival.

Conclusions: A combined analysis of mean intracellular water molecule lifetime and volume transfer constant provided the best model to predict overall survival in patients with squamous cell carcinomas of the head and neck.


Figures

Fig 1.
Fig 1.
Representative images from a patient exhibiting long survival (follow-up duration of 8.19 years). Axial T2-weighted image (A) demonstrates an enlarged heterogeneous hyperintense metastatic left level IIa lymph node (arrow). This appears hypointense on a coregistered T1-weighted image (B), with heterogeneous enhancement on the corresponding postcontrast T1-weighted image (C). DCE-MRI–derived τi (0.136 seconds [D]) and Ktrans (0.882 minutes−1 [E]) maps are shown as color images overlaid on postcontrast T1-weighted images.
Fig 2.
Fig 2.
Representative images from a patient who died 2.12 years after the end of CRT. Axial T2-weighted image (A) demonstrates a heterogeneous hyperintense metastatic left level IIb lymph node (arrow). It appears hypointense on a coregistered T1-weighted image (B) with heterogeneous enhancement on postcontrast T1-weighted image (C). DCE-MRI–derived τi (0.031 seconds; [D]) and Ktrans (0.135 minutes−1 [E]) maps overlaid on postcontrast T1-weighted images demonstrating lower τi and Ktrans values from the node compared with the patient with longer survival as shown in Fig 1.
Fig 3.
Fig 3.
Kaplan-Meier plot for τi. Patients with higher pretreatment τi (solid curves) demonstrate longer OS compared with patients with lower τi (broken curves) for first 2-year (solid vertical line, P = .09), 5-year (dotted vertical line, P = .01), and long-term (median duration, >7 years; P = .006) follow-up periods.
Fig 4.
Fig 4.
Kaplan-Meier plots for Ktrans. Patients with higher pretreatment Ktrans (solid curves) demonstrate longer OS compared with patients with lower Ktrans (broken curves) at the 2-year (solid vertical line; P = .07), 5-year (dotted vertical line; P = .028), and long-term (median duration, >7 years; P = .06) follow-up periods.
Fig 5.
Fig 5.
Kaplan-Meier plots for combinations of τi and Ktrans. Patients with high τi/Ktrans (thick broken curve) had the longest OS, and patients with low τi/Ktrans (thin broken curve) had the shortest OS for the first 2-year (solid vertical line; P = .02), 5-year (dotted vertical line; P < .0001), and long-term (median duration, >7 years; P < .0001) follow-up periods. In addition, patients with high τi/low Ktrans (thick solid curve) exhibited longer OS than patients with low τi/high Ktrans (thin solid curve) at all clinical end points.
Fig 6.
Fig 6.
Kaplan-Meier plots for p16 expression. (A) Patients with p16-positive expression (solid curve) exhibited significantly longer long-term (median duration, >7 years) OS (P < .05) than patients with p16-negative expression (broken curve) (B). Patients with positive p16 expression and high τi/high Ktrans (thick broken curve) had longer OS than p16-positive patients with low τi/low Ktrans (thin broken curve). In addition, patients with high τi/low Ktrans (gray solid curve) exhibited longer OS than patients with low τi/high Ktrans (black solid curve) at all clinical end points. However, these differences were not significant (P > .05).

Similar articles

Cited by

References

    1. Chen CC, Lin JC, Chen KW. Lymph node ratio as a prognostic factor in head and neck cancer patients. Radiat Oncol 2015;10:181 10.1186/s13014-015-0490-9 - DOI - PMC - PubMed
    1. Tofts PS, Kermode AG. Measurement of the blood-brain barrier permeability and leakage space using dynamic MR imaging. 1. Fundamental concepts. Magn Reson Med 1991;17:357–67 10.1002/mrm.1910170208 - DOI - PubMed
    1. Tofts PS, Brix G, Buckley DL, et al. . Estimating kinetic parameters from dynamic contrast-enhanced T(1)-weighted MRI of a diffusable tracer: standardized quantities and symbols. J Magn Reson Imaging 1999;10:223–32 10.1002/(SICI)1522-2586(199909)10:3<223::AID-JMRI2>3.0.CO;2-S - DOI - PubMed
    1. Chawla S, Kim S, Dougherty L, et al. . Pretreatment diffusion-weighted and dynamic contrast-enhanced MRI for prediction of local treatment response in squamous cell carcinomas of the head and neck. AJR Am J Roentgenol 2013;200:35–43 10.2214/AJR.12.9432 - DOI - PMC - PubMed
    1. Kim S, Loevner LA, Quon H, et al. . Prediction of response to chemoradiation therapy in squamous cell carcinomas of the head and neck using dynamic contrast-enhanced MR imaging. AJNR Am J Neuroradiol 2010;31:262–68 10.3174/ajnr.A1817 - DOI - PMC - PubMed

Publication types

MeSH terms

LinkOut - more resources