. 2018 Jan;38(1):195-205.
doi: 10.1161/ATVBAHA.117.310372. Epub 2017 Nov 16.

Transforming Growth Factor-β1 Inhibits Pseudoaneurysm Formation After Aortic Patch Angioplasty

Affiliations

Transforming Growth Factor-β1 Inhibits Pseudoaneurysm Formation After Aortic Patch Angioplasty

Hualong Bai et al. Arterioscler Thromb Vasc Biol. 2018 Jan.

Abstract

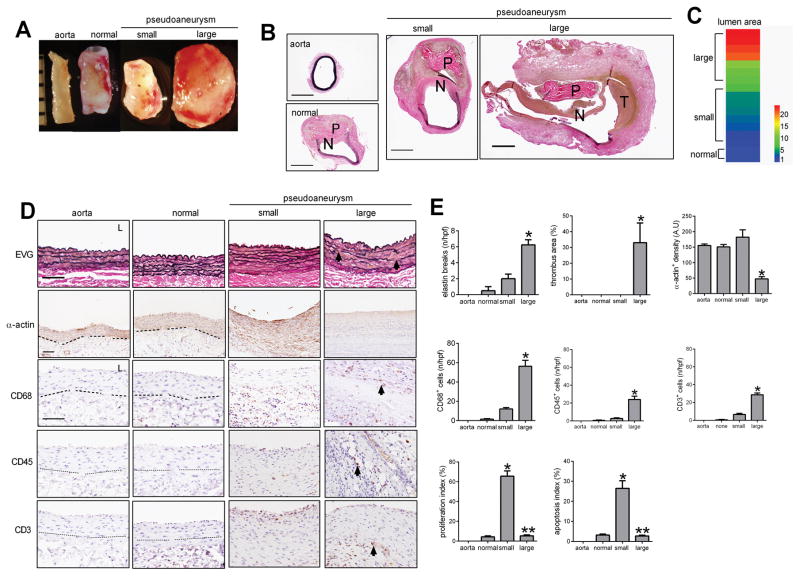
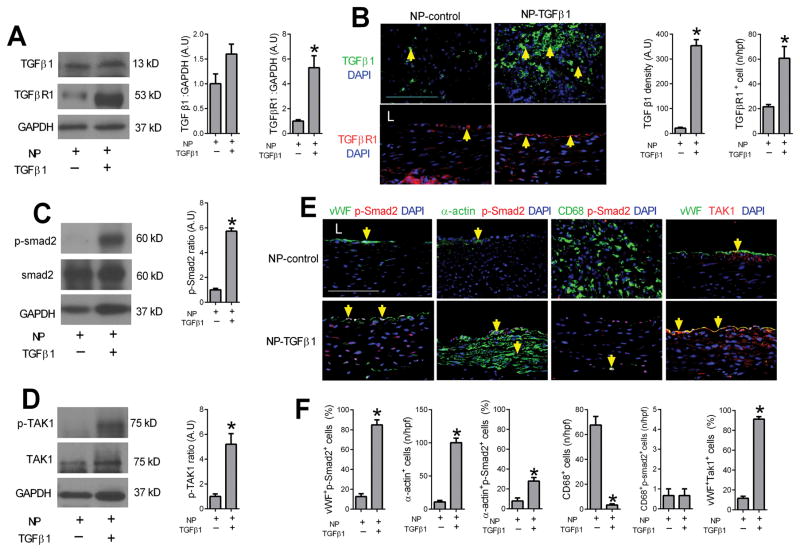
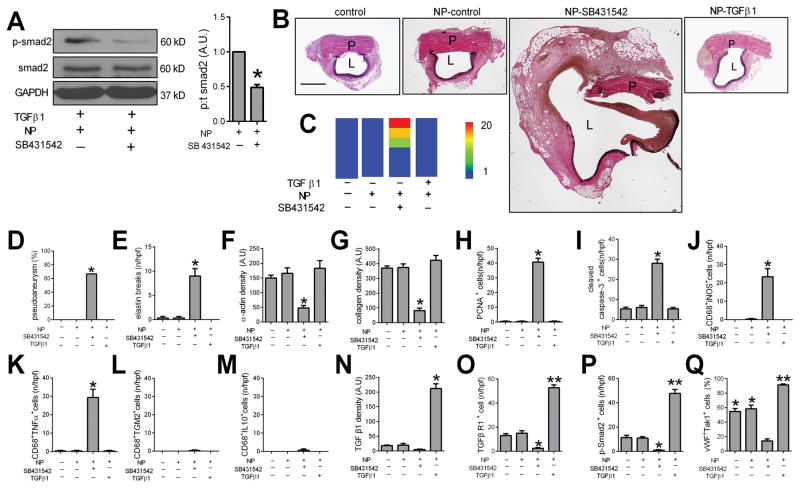
Objective: Pseudoaneurysms remain a significant complication after vascular procedures. We hypothesized that TGF-β (transforming growth factor-β) signaling plays a mechanistic role in the development of pseudoaneurysms.

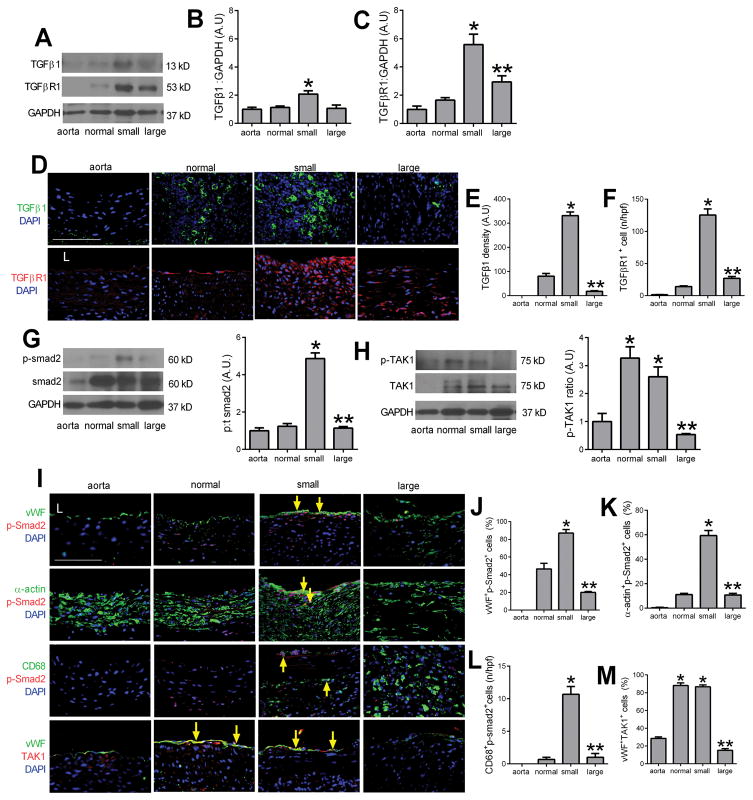
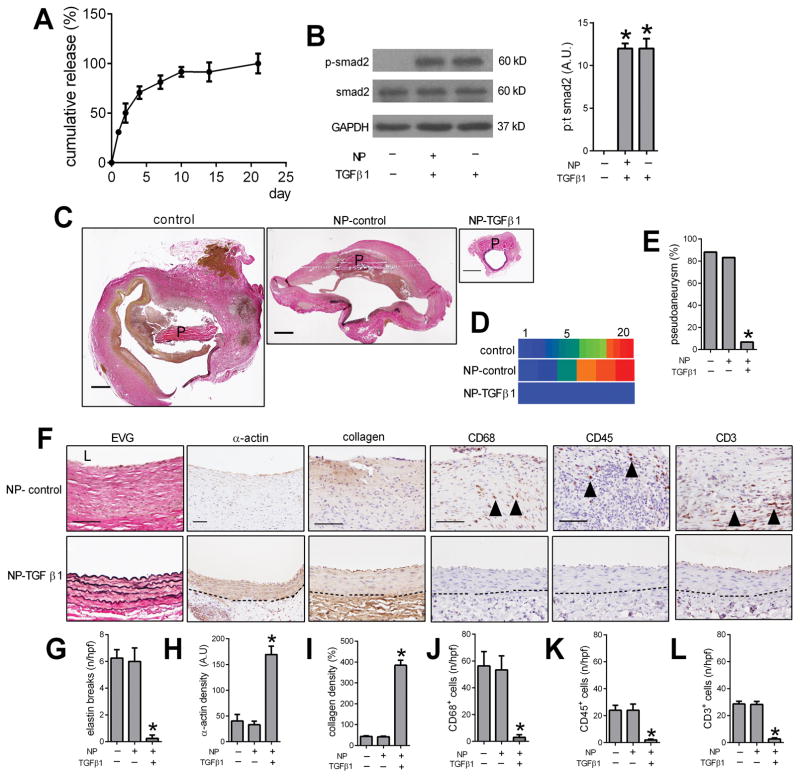
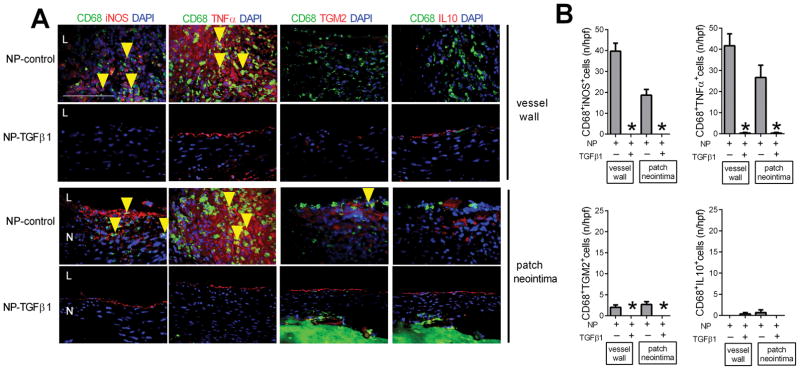
Approach and results: Rat aortic pericardial patch angioplasty was associated with a high incidence (88%) of pseudoaneurysms at 30 days, with increased smad2 phosphorylation in small pseudoaneurysms but not in large pseudoaneurysms; TGF-β1 receptors were increased in small pseudoaneurysms and preserved in large pseudoaneurysms. Delivery of TGF-β1 via nanoparticles covalently bonded to the patch stimulated smad2 phosphorylation both in vitro and in vivo and significantly decreased pseudoaneurysm formation (6.7%). Inhibition of TGF-β1 signaling with SB431542 decreased smad2 phosphorylation both in vitro and in vivo and significantly induced pseudoaneurysm formation by day 7 (66.7%).

Conclusions: Normal healing after aortic patch angioplasty is associated with increased TGF-β1 signaling, and recruitment of smad2 signaling may limit pseudoaneurysm formation; loss of TGF-β1 signaling is associated with the formation of large pseudoaneurysms. Enhancement of TGF-β1 signaling may be a potential mechanism to limit pseudoaneurysm formation after vascular intervention.

Keywords: TGF beta; animal model; nanoparticle; pseudoaneurysm; smad2.


Figures

Figure 1
Figure 1. Pseudoaneurysm formation after rat aortic pericardial patch angioplasty
A) Representative photographs of macroscopic features of pseudoaneurysms after rat aorta patch angioplasty at day 30; ruler marker, 1mm. B) Verhoeff–Van Gieson (VVG) staining of rat native aorta, patch angioplasty with normal healing and without pseudoaneurysm formation, small pseudoaneurysm formation and large pseudoaneurysm formation at day 30; P, pericardial patch; scale bar, 1mm. C) Heat map of the luminal area distribution after 17 rat aorta patch angioplasties (ratio, normalized to native aorta). Aorta, n=3; normal healing, n=2; small pseudoaneurysm, n=5; large pseudoaneurysm, n=10. D) Photomicrographs of the aorta, day 30 after patch angioplasty. First row, VVG staining of the residual aortic wall; second row, immunohistochemistry of the normally healing aortic wall or pseudoaneurysm wall stained for α-actin; third row, immunohistochemistry stained for CD68; fourth row, immunohistochemistry stained for CD45; fifth row, immunohistochemistry stained for CD3; arrow shows elastin breaks or positive cells; dashed line shows the demarcation of the media and adventitia; scale bar, 100 μm; L, lumen. E) Bar graphs showing elastin breaks per high power field (p=0.0004, ANOVA; *, p=0.005, vs. small; Tukey’s multiple comparisons test). Thrombus area (p=0.0247, ANOVA; *, p=0.0394, vs. small; Tukey’s multiple comparisons test). α-actin positive cell density (p=0.0004, ANOVA; *, p<0.003, vs. normal and small; Tukey’s multiple comparisons test). Number of CD68 positive cells (p=0.0001, ANOVA; *, p=0.0006, vs. small; Tukey’s multiple comparisons test). Number of CD45 positive cells (p=0.001, ANOVA; *, p=0.0022, vs. small; Tukey’s multiple comparisons test). Number of CD3 positive cells (p<0.0001, ANOVA; *, p=0.0001, vs. small; Tukey’s multiple comparisons test). Proliferation index in the pseudoaneurysm wall (p<0.0001, ANOVA; *, p<0.0001, vs. normal; **, p<0.0001, vs. normal and small; Tukey’s multiple comparisons test). Apoptosis index in the pseudoaneurysm wall (p=0.0001, ANOVA; *, p=0.0003, vs. normal; **, p=0.0003, vs. small; Tukey’s multiple comparisons test). n=2–5.
Figure 2
Figure 2. TGFβ pathway signaling during pseudoaneurysm formation
A) Immunoblot of TGFβ1 and TGFβ receptor 1 (TGFβR1) in the native aorta, normal healing without pseudoaneurysm, small pseudoaneurysms and large pseudoaneurysms. n=3. B) Bar graph shows the ratio TGFβ1: GAPDH (p=0.0096, ANOVA; *, p<0.02, vs. aorta, normal and large; Tukey’s multiple comparisons test) n=3. C) Bar graph shows the ratio TGFβR1:GAPDH (p=0.0004, ANOVA; *, p<0.02, vs. aorta, normal; **, p=0.0132, vs. small; Tukey’s multiple comparisons test); n=3. D) Immunofluorescence showing TGFβ1 (green) and DAPI (blue); merged pictures of TGFβR1 (red) and DAPI (blue) in aortae and tissue with normal healing, small and large pseudoaneurysms; scale bar, 100 μm; n=2–5. E) Bar graph shows density of TGFβ1 (p<0.0001, ANOVA; *, p<0.0001, vs. normal and small; **, p<0.0001, vs. small; Tukey’s multiple comparisons test). F) Bar graph showing number of TGFBR1 positive cells in the vessel wall (p<0.0001, ANOVA; *, p<0.0001, vs. normal and small; **, p<0.0001, vs. small; Tukey’s multiple comparisons test); n=2–5. G) Immunoblot of phosphorylated and total smad2 in the native aorta, normal healing without pseudoaneurysm, small pseudoaneurysms and large pseudoaneurysms. Bar graph shows the ratio of phospho:total smad2 (p<0.0001, ANOVA; *, p<0.0001, vs. aorta and normal; **, p<0.0001, vs. small; Tukey’s multiple comparisons test) n=3. H) Immunoblot of phosphorylated and total TAK1 in the native aorta, normal healing without pseudoaneurysm, small pseudoaneurysms and large pseudoaneurysms. Bar graph showing the ratio of phospho:total TAK1 (p<0.0001, ANOVA; *, p<0.0025, vs. aorta; **, p=0.006, vs. normal and small, Tukey’s multiple comparisons test) n=3. I) Merged immunofluorescence of the vessel wall in aorta, normal healing without pseudoaneurysm, small pseudoaneurysms and large pseudoaneurysms, day 30. First row, merge of vWF (green), p-Smad2 (red) and DAPI (blue); second row, merge of α-actin (green), p-Smad2 (red) and DAPI (blue); third row, merge of CD68 (green), p-Smad2 (red) and DAPI (blue); forth row, merge of vWF (green), TAK1 (red) and DAPI (blue); yellow arrows show dual positive cells; scale bar, 100 μm. n=2–5. J) Bar graph showing vWF and p-Smad2 dual positive cells in the aorta wall (p=0.004, ANOVA; *, p=0.0036, vs. normal; **, p=0.0009, vs. small; Tukey’s multiple comparisons test); n=2–5. K) Bar graph showing α-actin and p-smad2 dual positive cells in the wall (p<0.0001, ANOVA; *, p<0.0001, vs. normal; **, p<0.0001, vs. small; Tukey’s multiple comparisons test); n=2–5. L) Bar graph showing CD68 and p-smad2 dual positive cells in the wall (p<0.0001, ANOVA; *, p<0.0001, vs. normal; p<0.0001, vs. small; Tukey’s multiple comparisons test); n=2–5. M) Bar graph showing vWF and TAK1 dual positive cells in the aorta wall (p<0.0001, ANOVA; *, p<0.0001, vs. aorta; **, p<0.0001, vs. normal and small; Tukey’s multiple comparisons test); n=2–5.
Figure 3
Figure 3. Delivery of TGFβ1 decreases pseudoaneurysm formation
A) In vitro elution curve showing TGFβ1 release from NP-TGFβ1 over 21 days. B) Immunoblot of phosphorylated and total smad2 in endothelial cells treated with control, NP-TGFβ1 and TGFβ1; n=3. Bar graph shows the ratio of phospho:total smad2 (p<0.0001, ANOVA; *, p<0.0001, vs. control; Tukey’s multiple comparisons test). C) Verhoeff–Van Gieson (VVG) staining after aortic patch angioplasty (day 30) using patches treated with control, NP-control or NP-TGFβ1; P, pericardial patch; scale bar, 1 mm; n=6–15. D) Heat map of the luminal area distribution (ratio, normalized to native aorta) after aortic patch angioplasty (day 30) using patches treated with control, NP-control or NP-TGFβ1. E) Bar graph showing pseudoaneurysm formation in control, NP-control and NP-TGFβ1 patches, day 30.*, p=0.0161, Chi-square. F) VVG staining of the residual aortic wall and immunohistochemistry showing the pseudoaneurysm or aorta wall of the NP-control and NP-TGFβ1 patches, day 30; first column, EVG staining; second column, immunohistochemistry stained for α-actin; third column, immunohistochemistry stained for collagen; fourth column, immunohistochemistry stained for CD68; fifth column, immunohistochemistry stained for CD45; sixth column, immunohistochemistry stained for CD3; dashed line shows the demarcation of the media and adventitia; scale bar, 100 μm; n=4–15. G) Bar graph showing number of elastin breaks per high power field in control, NP-control and NP-TGFβ1 patches, day 30 (p=0.0005, ANOVA; *, p<0.001, Tukey’s multiple comparisons test); n=4–6. H) Bar graph showing α-actin positive cell density; p=0.0004, ANOVA; *, p<0.0008, Tukey’s multiple comparisons test; n=4–6. I) Bar graph showing collagen density (p<0.0001, ANOVA; *, p<0.0001, Tukey’s multiple comparisons test); n=4–6. J) Bar graph showing numbers of CD68 positive cells (p=0.0002, ANOVA; *, p<0.001, Tukey’s multiple comparisons test); n=4–6. K) Bar graph showing the CD45 positive cells (p=0.0059, ANOVA; *, p=0.0096, Tukey’s multiple comparisons test); n=4–6. L) Bar graph showing the CD3 positive cells (p<0.0001, ANOVA; *, p=0.0001, Tukey’s multiple comparisons test); n=4–6.
Figure 4
Figure 4. Delivery of TGFβ1 diminishes M1 type macrophages
A) Immunofluorescence analysis of the vessel wall and patch neointima after rat aorta patch angioplasty, day 30; upper row, NP-control; lower row, NP-TGFβ1. Merge of CD68 (green), iNOS (red) and DAPI (blue); CD68 (green), TNFα (red) and DAPI (blue); merge of CD68 (green), TGM2 (red) and DAPI (blue); merge of CD68 (green), IL10 (red) and DAPI (blue); N, patch neointima; L, lumen; yellow arrows showing the dual positive cells; scale bar, 100 μm; n=3. B) Bar graphs showing CD68 and iNOS dual positive cells in the vessel wall (*, p=0.0005; t-test) and patch neointima (*, p=0.0024; t-test); CD68 and TNFα dual positive cells in the vessel wall (*, p=0.0019; t-test) and patch neointima (*, p=0.0104; t-test); CD68 and TGM2 dual positive cells in the vessel wall (*, p=0.0257; t-test) and patch neointima (*, p=0.0161; t-test); CD68 and IL10 dual positive cells in the vessel wall (p=0.3739; t-test) and patch neointima (p=0.3739; t-test); n=3.
Figure 5
Figure 5. Delivery of TGFβ1 increases Smad2 and TAK1 phosphorylation in vivo
A) Immunoblot of TGFβ1 and TGFβR1 in the NP-control and NP-TGFβ1 patches. n=3. Bar graphs show the ratio of TGFβ1 (p=0.1679, t-test) or TGFβR1 (p=0.0114, t-test) to GAPDH; n=3. B) Immunofluorescence of NP-control and NP-TGFβ1 patches showing TGFβ1 (green) and DAPI (blue); merged pictures of TGFβR1 (red) and DAPI (blue) in tissue in the NP-control and NP-TGFβ1 patches; scale bar, 100 μm; yellow arrows showing the positive cells. n=3. Bar graphs show density of TGFβ1 (*, p<0.0001, t-test); TGFβR1 positive cells (*, p=0.0002, t-test); n=3. C) Immunoblot of phosphorylated and total smad2 after aorta patch angioplasty using NP-control or NP-TGFβ1 patches, day 30; n=3. Bar graph shows the ratio of phospho:total smad2 (*, p<0.0001, t-test); n=3. D) Immunoblot of phosphorylated and total TAK1 after aorta patch angioplasty using NP-control or NP-TGFβ1 patches, day 30; n=3. Bar graph showing the ratio of phospho:total TAK1 (*, p=0.0087, t-test); n=3. E) Immunofluorescence showing the vessel wall after aorta patch angioplasty using NP-control or NP-TGFβ1 patches, day 30; First column, merge of vWF (green), p-Smad2 (red) and DAPI (blue); second column, merge of α-actin (green), p-Smad2 (red) and DAPI (blue); third column, merge of CD68 (green), p-Smad2 (red) and DAPI (blue); fourth column, merge of vWF (green), TAK1 (red) and DAPI (blue); L, lumen; yellow arrows show dual positive cells; scale bar, 100 μm; n=3. F) Bar graphs showing vWF-pSmad2 dual positive cells in the wall (*, p=0.0002, t-test); α-actin positive cells in the wall (*, p=0.0002, t-test); α-actin-pSmad2 dual positive cells in the wall (*, p=0.0127, t-test); CD68 positive cells in the wall (*, p=0.0008, t-test); CD68-pSmad2 dual positive cells in the wall ( p>0.9, t-test); vWF-TAK1 dual positive cells (*, p<0.0001, t-test).
Figure 6
Figure 6. Reduced TGFβ1 signaling increases pseudoaneurysm formation
A) Immunoblot of phosphorylated and total smad2 in endothelial cells treated with TGFβ1 (5μmol/ml) as well as NP-control or NP-SB431542 (5 μmol/ml). Bar graph shows the ratio of phospho:total smad2 (*, p=0.0061, t-test); n=3. B) Verhoeff–Van Gieson (VVG) staining after aortic patch angioplasty (day 7) using patches treated with control, NP-control, NP-SB431542, or NP-TGFβ1; P, pericardial patch; L, lumen; scale bar, 1 mm; n=6. C) Heat map of the aorta luminal area after patch angioplasty using control, NP-control, NP-SB431542 and NP-TGFβ1 patches (day 7). D) Bar graph showing the pseudoaneurysm rate at day 7 (*, p=0.0196, Chi-square); n=6. E) Bar graph showing the elastin breaks of the residual aortic wall (p<0.0001, ANOVA; *, p<0.0004, vs. control, NP-control and NP-TGFβ1 patches; Tukey’s multiple comparisons test). F) Bar graph showing the α-actin density (p=0.0175, ANOVA; *, p<0.047, vs. control, NP-control and NP-TGFβ1 patches; Tukey’s multiple comparisons test). G) Bar graph showing the collagen density (p=0.0016, ANOVA; *, p<0.0035, vs. control, NP-control and NP-TGFβ1 patches; Tukey’s multiple comparisons test). n=3. H) Bar graph showing the PCNA positive cells (p<0.0001, ANOVA; *, p<0.0001, vs. control, NP-SB431542 and NP-TGFβ1 patches; Tukey’s multiple comparisons test). n=3. I) Bar graph showing the cleaved caspase-3 positive cells (p<0.0001, ANOVA; *, p<0.0001, vs. control, NP-SB431542 and NP-TGFβ1 patches; Tukey’s multiple comparisons test); n=3. J) Bar graph showing CD68 and iNOS dual positive cells (p=0.0002, ANOVA; *, p<0.0004, Tukey’s multiple comparisons test), n=3. K) Bar graph showing CD68 and TNFα dual positive cells (p<0.0001, ANOVA; *, p<0.0001, Tukey’s multiple comparisons test); n=3. L) Bar graph showing CD68 and TGM2 dual positive cells (p=0.4411, ANOVA); n=3. M) Bar graph showing CD68 and IL10 dual positive cells (p=0.4411, ANOVA); n=3. N) Bar graph showing TGFβ1 density in control, NP-control, NP-SB431542 and NP-TGFβ1 patches, day 7 (p<0.0001, ANOVA; *, p<0.035, vs. control, NP-control, NP-SB431542 patch; Tukey’s multiple comparisons test); n=3. O) Bar graph showing number of TGFBR1 positive cells in control, NP-control, NP-SB431542 and NP-TGFβ1 patches, day 7 (p<0.0001, ANOVA; *, p<0.001, vs. control, NP-control patches; **, p<0.0001, VS. control, NP-control, NP-SB431542 patches; Tukey’s multiple comparisons test); n=3. P) Bar graph showing number of p-smad2 positive cells in control, NP-control, NP-SB431542 and NP-TGFβ1 patches, day 7 (p<0.0001, ANOVA; *, p<0.035, vs. control, NP-control patches; **, p<0.0001, VS. control, NP-control patches; Tukey’s multiple comparisons test), n=3. Q) Bar graph showing number of vWF and TAK1 dual positive cells in control, NP-control, NP-SB431542 and NP-TGFβ1 patches, day 7 (p<0.0001, ANOVA; *, p<0.0002, vs. NP-SB431542 patches; **, p<0.0004, VS. control, NP-control patches; Tukey’s multiple comparisons test), n=3.

Similar articles

Cited by

References

    1. Webber GW, Jang J, Gustavson S, Olin JW. Contemporary management of postcatheterization pseudoaneurysms. Circulation. 2007;115:2666–2674. - PubMed
    1. Klonaris C, Katsargyris A, Papapetrou A, Vourliotakis G, Tsiodras S, Georgopoulos S, Giannopoulos A, Bastounis E. Infected femoral artery pseudoaneurysm in drug addicts: The beneficial use of the internal iliac artery for arterial reconstruction. J Vasc Surg. 2007;45:498–504. - PubMed
    1. Ryugo M, Yasugi T, Nagashima M, Izutani H, Okamura T, Shikata F, Kawamura M, Kawachi K. Pseudoaneurysm in the left groin due to ruptured knitted dacron graft. Ann Vasc Dis. 2011;4:154–156. - PMC - PubMed
    1. Belardi P, Noce R. pseudoaneurysm of the right femoral anastomosis from an aorto-femoral dacron bypass. Removal and reconstruction of the artery. Minerva Chir. 1968;23:1066–1074. - PubMed
    1. Krishnan S, Clowes AW. Dacron patch infection after carotid endarterectomy: Case report and review of the literature. Ann Vasc Surg. 2006;20:672–677. - PubMed

Publication types

MeSH terms