

Lipid droplet biogenesis is spatially coordinated at ER-vacuole contacts under nutritional stress
- PMID: 29146766
- PMCID: PMC5757283
- DOI: 10.15252/embr.201744815
Lipid droplet biogenesis is spatially coordinated at ER-vacuole contacts under nutritional stress
Abstract
Eukaryotic cells store lipids in cytosolic organelles known as lipid droplets (LDs). Lipid droplet bud from the endoplasmic reticulum (ER), and may be harvested by the vacuole for energy during prolonged periods of starvation. How cells spatially coordinate LD production is poorly understood. Here, we demonstrate that yeast ER-vacuole contact sites (NVJs) physically expand in response to metabolic stress, and serve as sites for LD production. NVJ tether Mdm1 demarcates sites of LD budding, and interacts with fatty acyl-CoA synthases at the NVJ periphery. Artificially expanding the NVJ through over-expressing Mdm1 is sufficient to drive NVJ-associated LD production, whereas ablating the NVJ induces defects in fatty acid-to-triglyceride production. Collectively, our data suggest a tight metabolic link between nutritional stress and LD biogenesis that is spatially coordinated at ER-vacuole contact sites.
Keywords: endoplasmic reticulum; lipid droplet; membrane contact site; nuclear ER–vacuole junction; nutritional stress.
© 2017 The Authors.
Figures
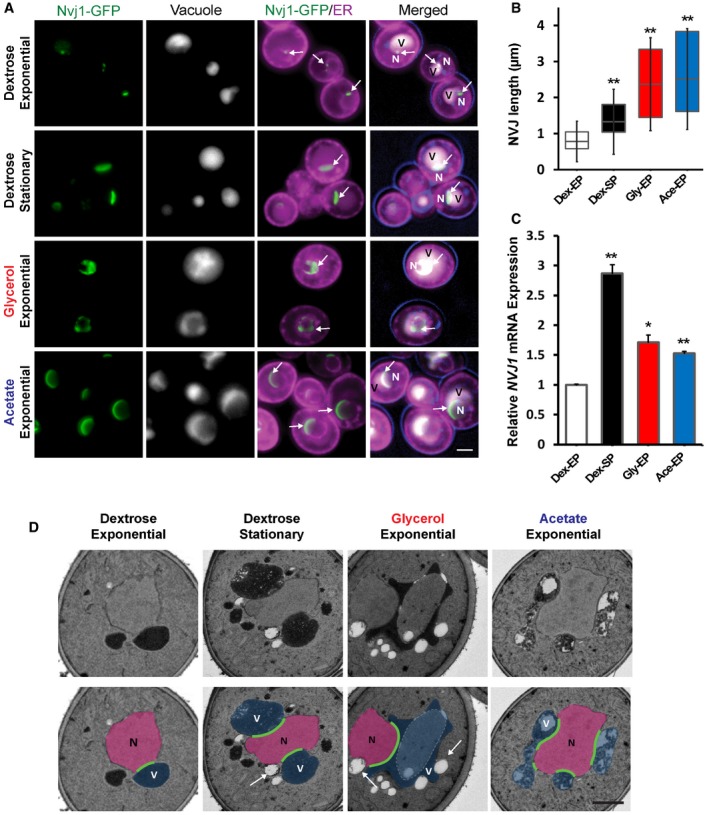
Light microscopy for yeast expressing chromosomally tagged Nvj1‐GFP (arrows), ER marker DsRed‐HDEL, and vacuole stained by CMAC. Scale bar, 2 μm. N, nucleus; V, vacuole.
Quantification of the NVJ length (μm) in (A) (box plots of median and range, n > 50 cells, **P < 0.005, Student's t‐test).
qRT–PCR showing NVJ1 expression levels in different growth conditions. Dex, dextrose; Gly, glycerol; Ace, acetate; EP, exponential phase; SP, stationary phase (mean ± SEM, n = 3 independent cultures per condition, **P < 0.005 and *P < 0.05, Student's t‐test).
Electron micrographs of yeast grown in different conditions. Arrows indicate lipid droplets. Scale bar, 0.5 μm. N, nucleus; V, vacuole.
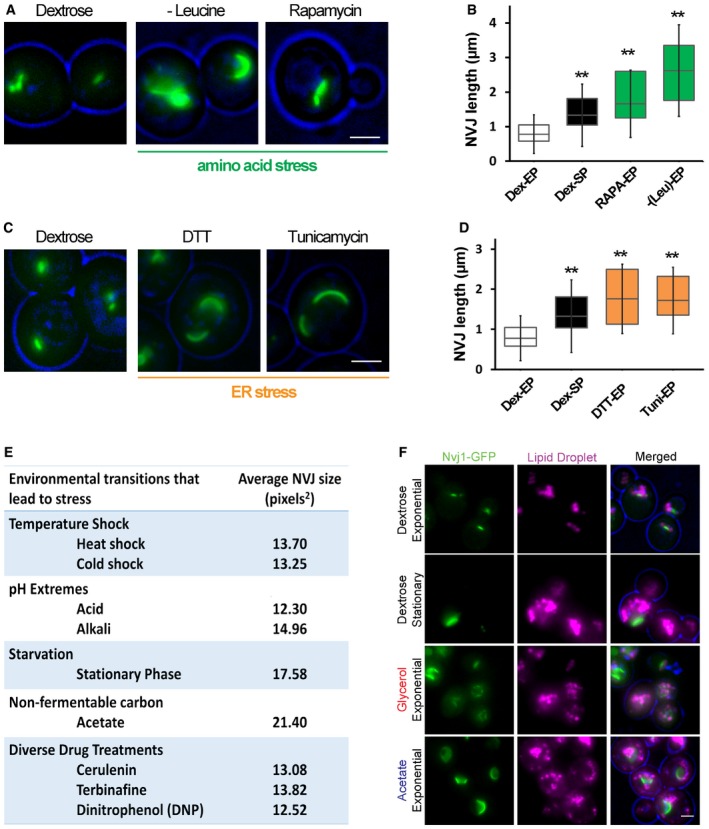
Light microscopy for cells expressing chromosomally tagged Nvj1‐GFP imaged in amino acid stress. Scale bar, 2 μm.
Quantification of the NVJ length (μm) in (A) (box plots of median and range, n > 50 cells, **P < 0.005, Student's t‐test).
Light microscopy for cells expressing chromosomally tagged Nvj1‐GFP imaged in DTT and tunicamycin. Scale bar, 2 μm.
Quantification of the NVJ length (μm) in (C) (box plots of median and range, n > 50 cells, **P < 0.005, Student's t‐test).
Summary table for different stress conditions and their effect on NVJ size based on visual screening. Values are in pixels2.
Light microscopy of LDs in yeast expressing chromosomally tagged Nvj1‐GFP grown in different conditions. Scale bar, 2 μm.
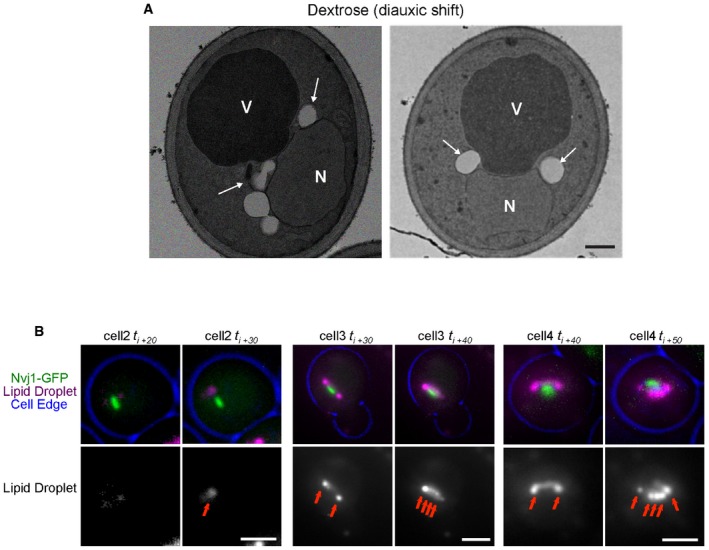
TEM of WT yeast grown at diauxic shift. Arrows indicate LDs. Scale bar, 0.5 μm. N, nucleus; V, vacuole.
Single cells (cell 1, 2, and 3) imaged at different times after cerulenin washout (t i). LDs (arrows) visualized by AutoDOT staining and NVJ visualized by Nvj1‐GFP. Scale bar, 2 μm.
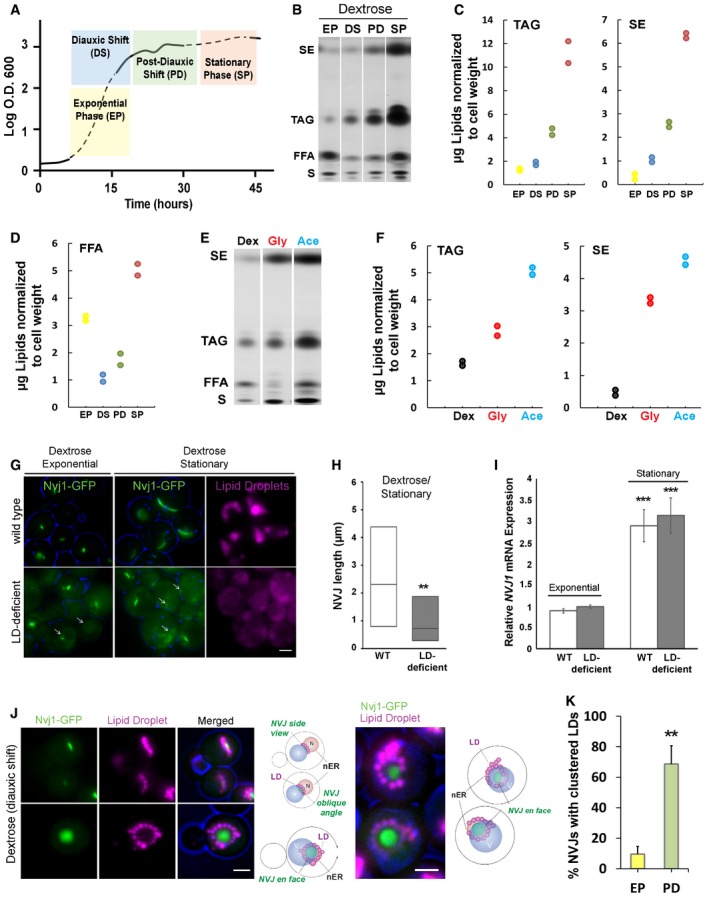
Growth curve representing the number of cells (OD600) versus time (in hours) of WT yeast grown in dextrose.
TLC of neutral lipids from WT yeast grown in dextrose and collected at different growth stages. EP, exponential phase; DS, diauxic shift; PD, post‐diauxic shift; SP, stationary phase; SE, sterol esters; TAG, triacylglycerides; FFA, free fatty acids; S, sterols.
Quantification of TAG and SE (μg; normalized to cell pellet weight) of TLC from (B).
Quantification of free fatty acids (FFA) (normalized to cell pellet weight) of TLC from (B).
TLC of neutral lipids from yeast grown in Dex, Gly, and Ace collected at DS. SE, sterol esters; TAG, triacylglycerides; FFA, free fatty acids; S, sterols.
Quantification of TAG and SE (μg; normalized to cell pellet weight) of TLC from (E).
Light microscopy of Nvj1‐GFP in WT and mutant yeast (LD‐deficient) lacking enzymes needed to make LDs. Arrows indicate unextended NVJ. Scale bar, 2 μm.
Quantification of images in (G) (box plots of median and range, n > 50 cells, **P < 0.005, Student's t‐test).
qRT–PCR showing NVJ1 expression levels in WT and LD‐deficient yeast (mean ± SEM, n = 3 independent cultures per condition, ***P < 0.001, Student's t‐test).
Light microscopy of LDs stained with AutoDOT in cells expressing chromosomally tagged Nvj1‐GFP at DS with illustration of the spatial distribution of LDs around the NVJ. Scale bar, 2 μm.
Quantification of LD clustering around the NVJ from cells imaged in (J) (percentage of cells with clustered LDs around the NVJ over total number of cells counted, mean ± SD, n > 50 cells, **P < 0.005, Student's t‐test).
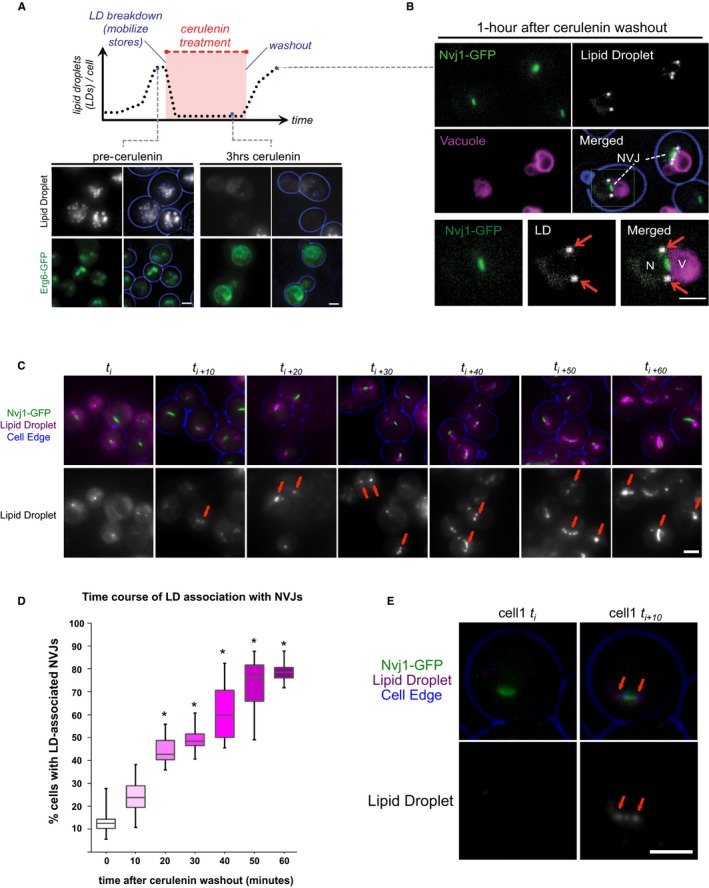
Top: Graph depiction of changes in lipid droplet content per cell in the presence of cerulenin. Bottom: Light microscopy for LDs visualized by AutoDOT staining and Erg6‐GFP before and during cerulenin treatment. Scale bar, 2 μm.
Light microscopy performed 1 h post‐cerulenin washout. LDs (arrows) visualized by AutoDOT staining, NVJ visualized by Nvj1‐GFP, and vacuole stained using CMAC. Scale bar, 2 μm.
Light microscopy of Nvj1‐GFP‐tagged yeast performed at 10‐min increments following initial cerulenin washout (t i). LDs (arrows) visualized by AutoDOT staining. Scale bar, 2 μm.
Quantification of LD‐NVJ association from images obtained in (C) (percentage of cells with LD‐NVJ association over total number of cells counted, box plots of median and range, n > 50 cells per time point, *P < 0.05, Student's t‐test).
Single cell imaged at initial and 10 min following cerulenin washout. LDs (arrows) visualized by AutoDOT staining and NVJ visualized by Nvj1‐GFP. Scale bar, 2 μm.
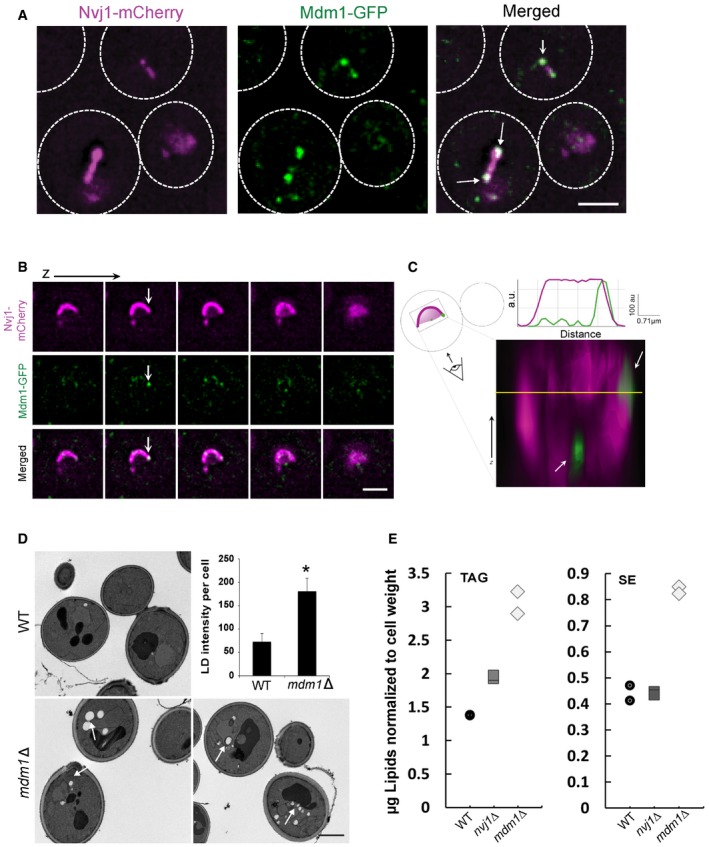
Single optical sections of chromosomally tagged Mdm1‐GFP (green) and Nvj1‐mCherry (magenta) imaged using 3D‐SIM. Arrows indicate Mdm1‐GFP enrichment sites. Scale bar, 2 μm.
Sequential optical sections of yeast with Mdm1‐GFP and Nvj1‐mCherry. Arrows indicate Mdm1‐GFP enrichment sites. Scale bar, 2 μm.
3D stacking of optical sections with line traces. Arrows indicate Mdm1‐GFP enrichment sites.
TEM of WT and mdm1Δ yeast in exponential growth. Arrows depict lipid droplets. Scale bar, 2 μm. Top right: Quantification using ImageJ of LD intensity per cell from light microscopy imaging (mean ± SD, n > 50 cells, *P < 0.05, Student's t‐test).
Quantification of TAG and SE (μg; normalized to cell pellet weight) from TLC in Fig EV3D.
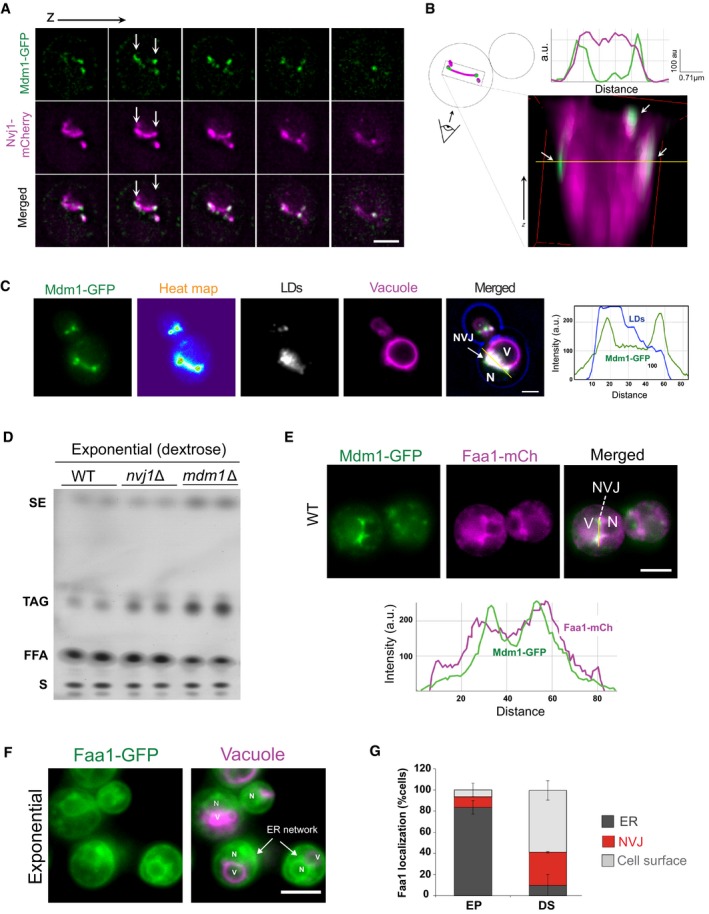
Sequential optical sections of yeast with Mdm1‐GFP and Nvj1‐mCherry. Arrows indicate sites for Mdm1‐GFP enrichment. Scale bar, 2 μm.
3D stacking of optical sections and line trace plot. Arrows indicate sites for Mdm1‐GFP enrichment.
Light microscopy of yeast mildly over‐expressing Mdm1‐GFP, with LDs and vacuole labeled using AutoDOT and FM4‐64 dye, respectively. Right: Line trace for light microscopy image (yellow line). Scale bar, 2 μm. N, nucleus; V, vacuole.
Neutral lipids TLC for WT, nvj1Δ, and mdm1Δ yeast quantified in Fig 4E. SE, sterol esters; TAG, triacylglycerides; FFA, free fatty acids; S, sterols.
Top: Dual‐labeling imaging for Mdm1‐GFP and Faa1‐mCherry. Scale bar, 2 μm. Bottom: Line trace for light microscopy (top, yellow line). N, nucleus; V, vacuole.
Light microscopy for chromosomally tagged Faa1‐GFP in exponential phase. Arrows indicate the ER network. Scale bar, 2 μm. N, nucleus; V, vacuole.
Quantification of Faa1‐GFP localization in different growth conditions. EP, exponential phase; DS, diauxic shift.
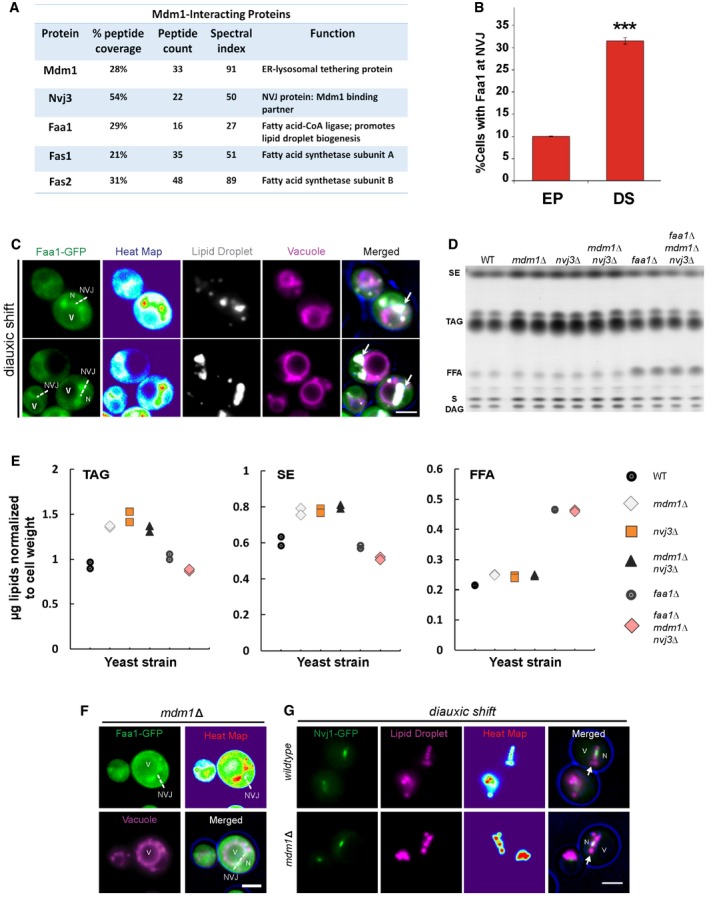
Major protein interactions with Mdm1‐GFP detected by mass spectrometry proteomics.
Quantification of cells with Faa1 localized to the NVJ in different growth stages from light microscopy (percentage of cells with Faa1‐GFP at the NVJ over total number of cells counted, mean ± SD, n > 50 cells, ***P < 0.001, Student's t‐test). EP, exponential phase; DS, diauxic shift.
Light microscopy of Faa1‐GFP showing co‐localization with LDs. Vacuole is labeled with FM4‐64 dye. Dashed lines indicate the NVJ. Arrows indicate LDs. Scale bar, 2 μm. N, nucleus; V, vacuole.
Neutral lipids TLC. SE, sterol esters; TAG, triacylglycerides; FFA, free fatty acids; S, sterols; DAG, diacylglycerides.
Quantification of TAG, SE, and FFA in (D) (μg; normalized to cell pellet weight) in WT, mdm1Δ, nvj3Δ, mdm1Δnvj3Δ, faa1Δ, and faa1Δmdm1Δnvj3Δ. Scatter plot legend on the right.
Light microscopy of mdm1Δ yeast showing recruitment of Faa1‐GFP to the NVJ. Dashed lines indicate the NVJ. Scale bar, 2 μm. N, nucleus; V, vacuole.
Light microscopy of Nvj1‐GFP yeast with LDs labeled using AutoDOT staining in diauxic shift. Arrows indicate LDs. Scale bar, 2 μm. N, nucleus; V, vacuole.
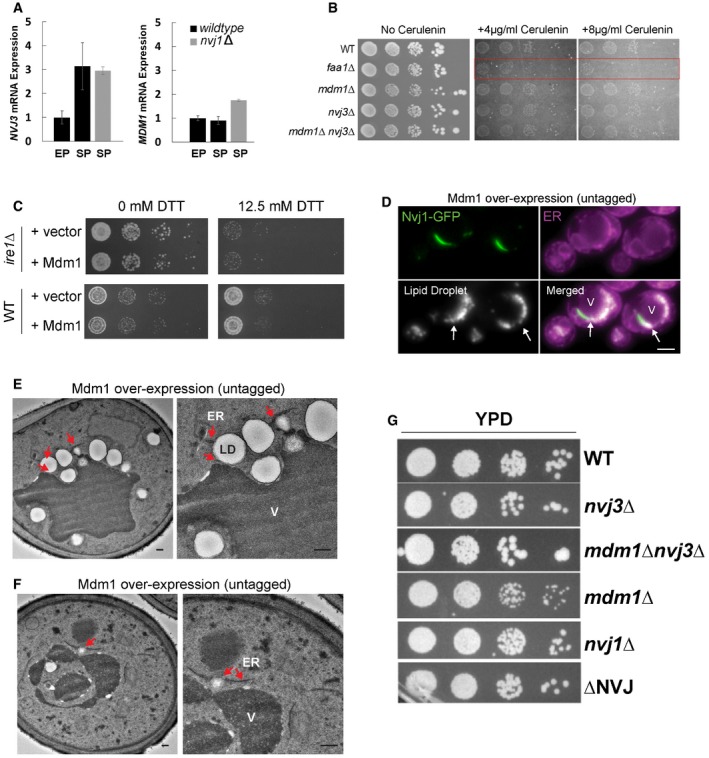
- A
qRT–PCR showing expression levels of Mdm1 and Nvj3 in nvj1Δ yeast cultured in EP and SP (mean ± SEM, n = 3 independent cultures per condition, ***P < 0.001, Student's t‐test). EP, exponential phase; SP, stationary phase.
- B
Plating assay of WT, faa1Δ mdm1Δ, nvj3Δ, and mdm1Δnvj3Δ on plates containing different concentrations of cerulenin.
- C
Growth assays on DTT‐containing plates for both wild‐type yeast and ire1Δ over‐expressing Mdm1.
- D
Light microscopy of cells over‐expressing untagged Mdm1 show increase LDs that cluster at the NVJ (arrows, visualized by Nvj1‐GFP). Scale bar, 2 μm. V, vacuole.
- E, F
TEM of WT cells over‐expressing untagged Mdm1. Arrows indicate LDs associated with LDs near the vacuole. Scale bar, 0.5 μm. V, vacuole.
- G
Plating assay for yeast lacking different NVJ proteins.
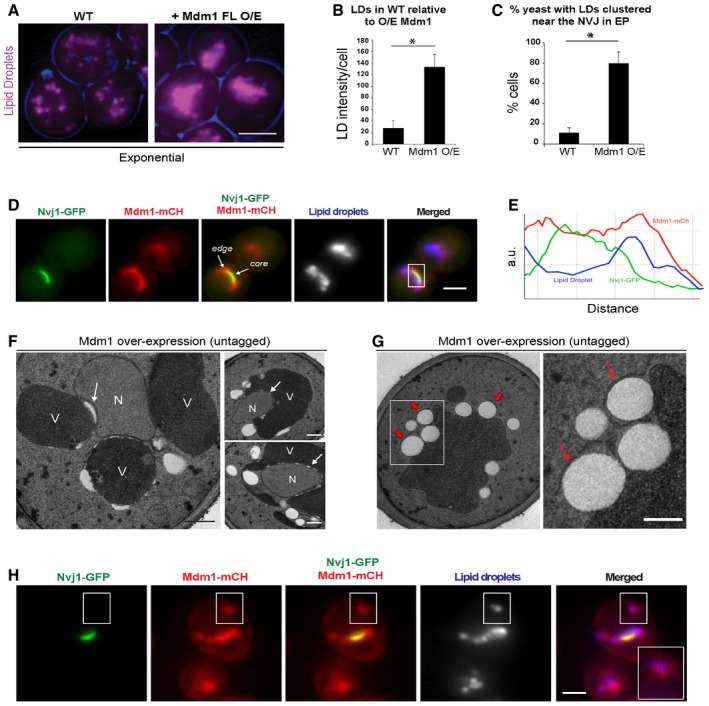
- A
Light microscopy for AutoDOT‐labeled LDs in WT yeast and yeast over‐expressing Mdm1. Scale bar, 2 μm.
- B
Quantification using ImageJ of LD intensity per cell from light microscopy imaging in (A) (mean ± SD, n > 50 cells, *P < 0.05, Student's t‐test).
- C
Quantification of LD‐NVJ clustering in WT yeast and yeast over‐expressing Mdm1 (percentage of cells with LD‐NVJ clustering over total number of cells counted, mean ± SD, n > 50 cells, *P < 0.05, Student's t‐test).
- D
Light microscopy for yeast with dual over‐expression of Mdm1‐mCherry and Nvj1‐GFP showing localization of Mdm1‐mCH and Nvj1‐GFP at the edge and core, respectively. White rectangle indicates the NVJ core and edge regions corresponding to line tracing in (E). Scale bar, 2 μm.
- E
Line tracing showing the spatial distribution of Mdm1‐mCH, Nvj1‐GFP, and LDs.
- F, G
TEM of yeast over‐expressing untagged Mdm1. Arrows in (F) indicate aberrant structures. Arrows in (G) indicate LDs wrapped in ER tubules. Scale bar, 0.5 μm. N, nucleus; V, vacuole.
- H
Light microscopy for yeast with dual over‐expression of Mdm1‐mCherry and Nvj1‐GFP. Inset: Co‐localization of Mdm1‐mCH and LDs labeled using AutoDOT. Scale bar, 2 μm.
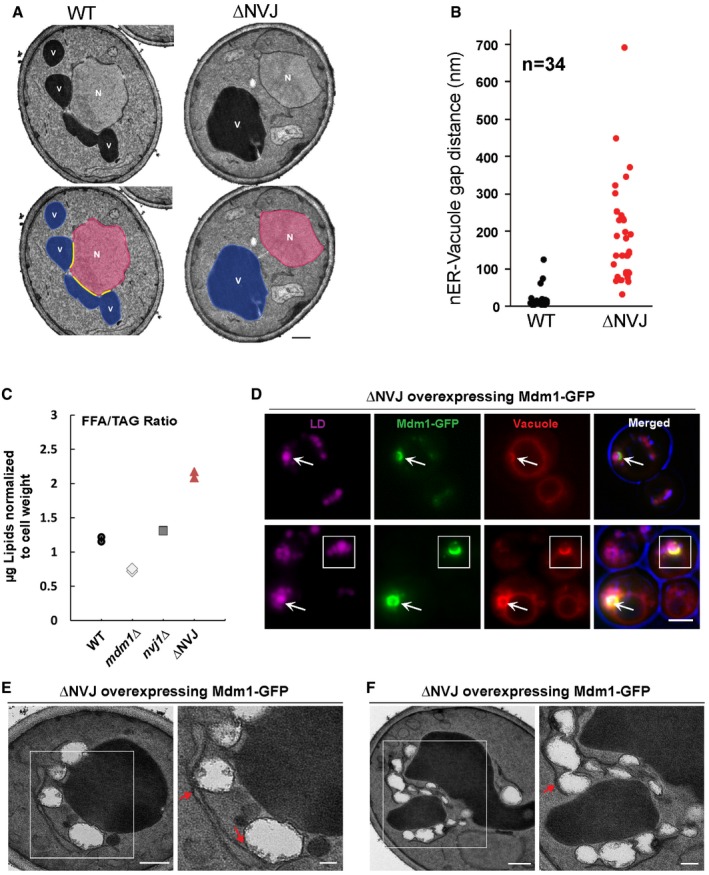
- A
Electron micrographs of yeast strain lacking NVJ tethering proteins (ΔNVJ: nvj1Δnvj2Δmdm1Δnvj3Δ). Scale bar, 0.5 μm. N, nucleus; V, vacuole.
- B
Quantification of nER–vacuole distance in ΔNVJ yeast imaged in (A) (n = 34 cells).
- C
Quantification of the ratio of free fatty acid to TAG (normalized to cell pellet weight) in WT, mdm1Δ, nvj1Δ, and ΔNVJ for TLC in Fig EV5A.
- D
Light microscopy for ΔNVJ yeast over‐expressing Mdm1‐GFP. Scale bar, 2 μm. Arrows point to supersized LDs co‐localizing with Mdm1‐GFP. LDs and vacuole are labeled with AutoDOT and FM4‐64 dye, respectively.
- E, F
TEM of ΔNVJ yeast over‐expressing Mdm1 and treated with oleic acid overnight. Arrows indicate ER tubules wrapping LDs near the vacuole. Scale bar, 0.5 μm.
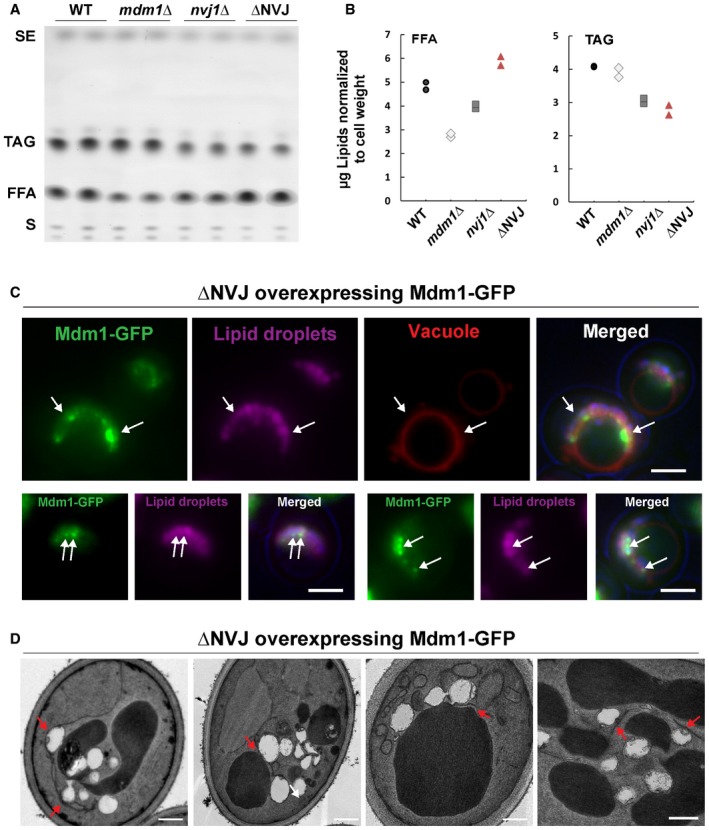
TLC of neutral lipids for WT and mutant yeast fed oleic acid overnight quantified in Fig 7C. SE, sterol esters; TAG, triacylglycerides; FFA, free fatty acids; S, sterols.
Quantification of FFA and TAG for TLC in (A). The absolute values here correspond to the ratio graphed in Fig 7C.
Light microscopy of NVJΔ yeast over‐expressing Mdm1‐GFP. LDs are stained with AutoDOT. Arrows point to co‐localization of LDs and Mdm1‐GFP. Scale bar, 2 μm.
Electron micrographs of NVJΔ yeast over‐expressing Mdm1‐GFP. Arrows indicate ER wrapping LDs near the vacuole. Scale bar, 0.5 μm.
References
Publication types
MeSH terms
Substances
Grants and funding
LinkOut - more resources
Full Text Sources
Other Literature Sources
Molecular Biology Databases
Research Materials
