. 2017 Nov 16;8(1):1557.
doi: 10.1038/s41467-017-01590-5.

The genomic landscape of pediatric myelodysplastic syndromes

Affiliations

The genomic landscape of pediatric myelodysplastic syndromes

Jason R Schwartz et al. Nat Commun. .

Abstract

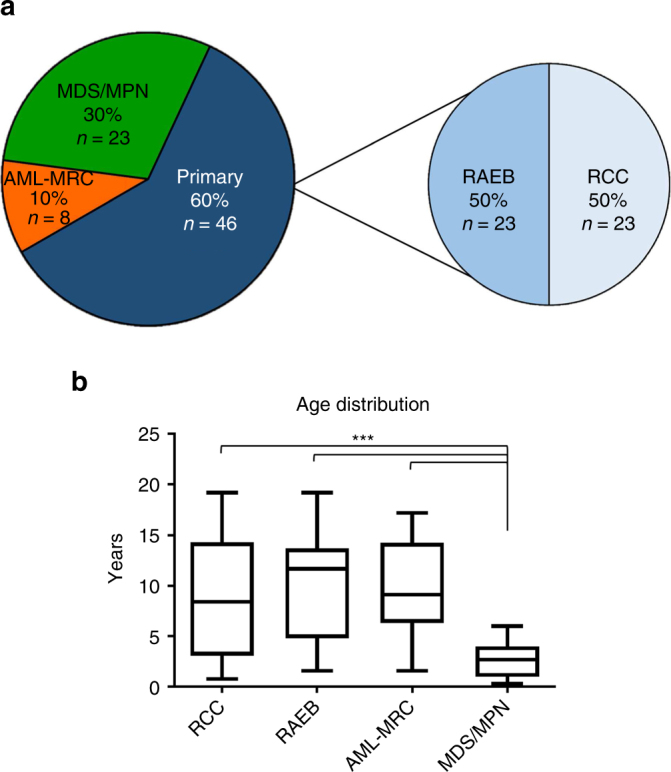
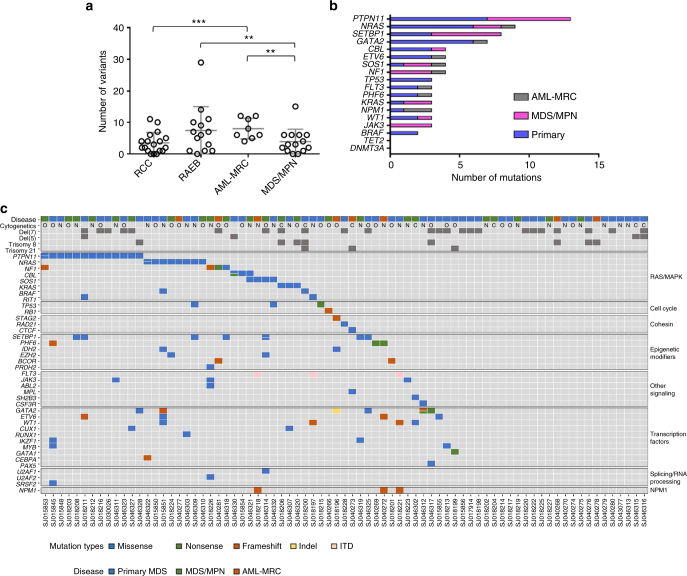
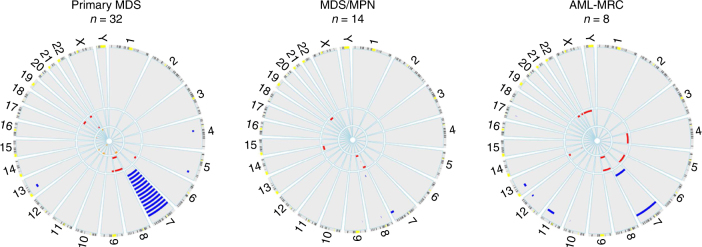
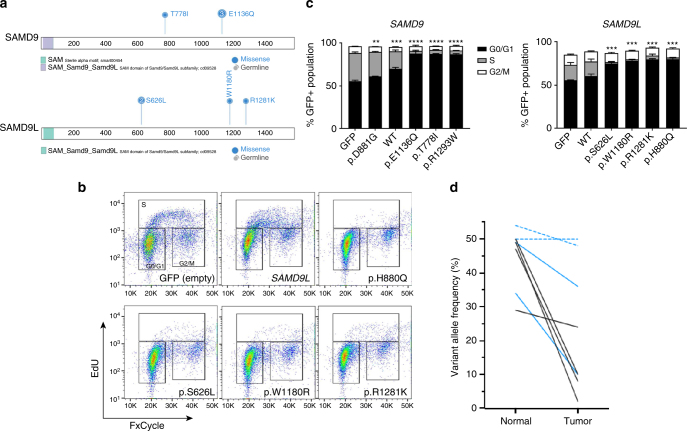
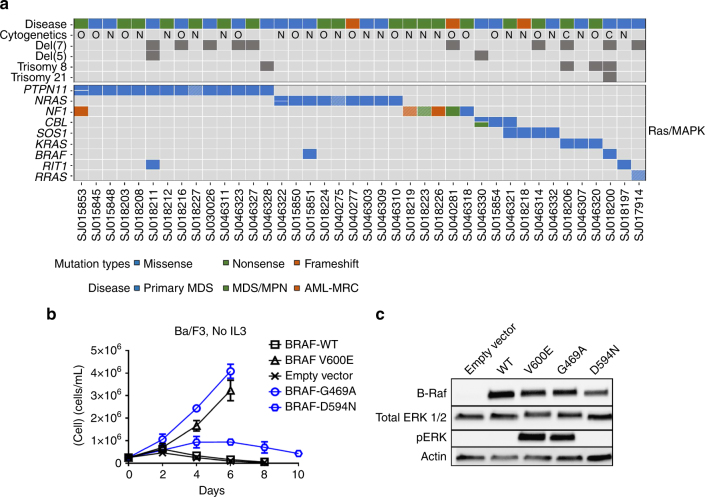
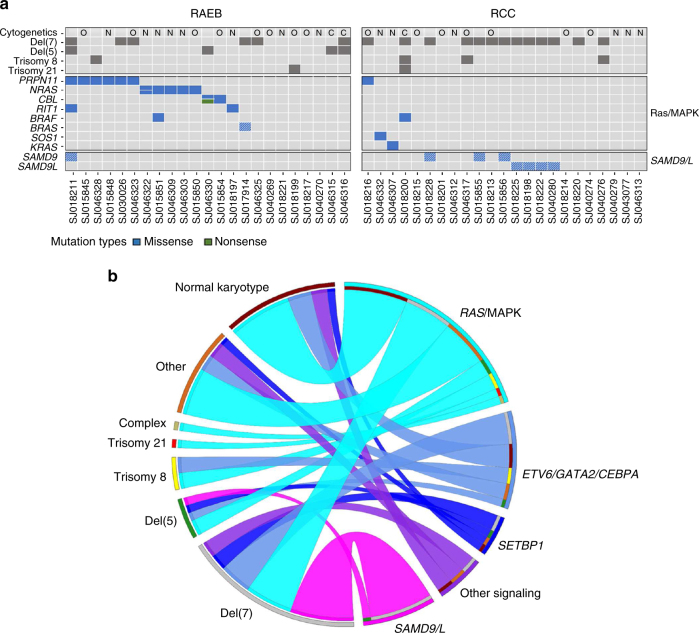
Myelodysplastic syndromes (MDS) are uncommon in children and have a poor prognosis. In contrast to adult MDS, little is known about the genomic landscape of pediatric MDS. Here, we describe the somatic and germline changes of pediatric MDS using whole exome sequencing, targeted amplicon sequencing, and/or RNA-sequencing of 46 pediatric primary MDS patients. Our data show that, in contrast to adult MDS, Ras/MAPK pathway mutations are common in pediatric MDS (45% of primary cohort), while mutations in RNA splicing genes are rare (2% of primary cohort). Surprisingly, germline variants in SAMD9 or SAMD9L were present in 17% of primary MDS patients, and these variants were routinely lost in the tumor cells by chromosomal deletions (e.g., monosomy 7) or copy number neutral loss of heterozygosity (CN-LOH). Our data confirm that adult and pediatric MDS are separate diseases with disparate mechanisms, and that SAMD9/SAMD9L mutations represent a new class of MDS predisposition.


Conflict of interest statement

The authors declare no competing financial interests.

Figures

Fig. 1
Fig. 1
Pediatric MDS cohort. a Pie charts depicting the distribution of the three diagnostic categories and subcategories of the pediatric MDS cohort; Total: n = 77. b Distribution of age (in years) at diagnosis for the pediatric MDS cohort. Lines within boxes represent median age (RCC: 8.4, RAEB: 11.7, AML-MRC: 9.1, MDS/MPN: 2.7) and whiskers represent maximum and minimum. ***: p < 0.0001 (student’s t-test). AML-MRC AML with myelodysplasia-related changes, RAEB, Refractory anemia with excess blasts; RCC, Refractory cytopenia of childhood
Fig. 2
Fig. 2
Somatic mutations in pediatric MDS and related neoplasms. a Total number of somatic variants per patient in the 54 patients with WES data (includes silent, nonsense, missense, frame shifts, indels, ITD, and mutations within 3′ and 5′ UTR). **: p= 0.02; ***: p = 0.003 (student’s t-test). b The most common genes with somatic mutations in the full cohort of 77 patients (includes WES and targeted amplicon sequencing). Only somatic mutations with presumed functional consequences are shown. c Heat map showing the somatic mutational profile of the pediatric MDS cohort separated by gene functional groups. Only somatic mutations with presumed functional consequences are shown. Split cells indicate multiple mutations. O, other karyotype findings not listed separately; C, complex karyotype; N, normal karyotype
Fig. 3
Fig. 3
Copy number analysis. Circos plots showing copy number alterations found with WES analysis of 54 tumor-normal pairs (events identified by conventional karyotyping are not included in these plots). Circumferential numbers indicate chromosome number, blue lines (outside ring) = deletions, red lines (middle ring) = amplifications, and orange lines (inside ring) = copy number neutral-loss of heterozygosity
Fig. 4
Fig. 4
Gain-of-function mutations in SAMD9 and SAMD9L decrease cell proliferation and inhibit cycle progression. a Schematic showing the protein structure of SAMD9 and SAMD9L. b Flow cytometry plots (FxCycle-total DNA content vs. EdU incorporation) showing the cell cycle inhibiting effects of gain-of-function SAMD9L mutations. SAMD9L p.H880Q (positive control) is a gain-of-function mutation previously reported in Ataxia-Pancytopenia syndrome. c EdU incorporation assay showing that gain-of-function SAMD9/SAMD9L mutations inhibit cells from progressing through the cell cycle as depicted by the relative absence of cells in S-phase. SAMD9 p.R1293W (positive control) is a previously reported gain-of-function mutation in MIRAGE syndrome. SAMD9 p.D881G is a common SNP that is not predicted to be pathogenic. **: p < 0.01, ***: p < 0.001, ****: p < 0.0001 (student’s t-test). Error bars indicate standard deviation. Data in B & C are representative of 2–3 experiments completed in triplicate. d VAF plot, obtained from targeted deep sequencing, showing the preferential loss (decrease in VAF) of the SAMD9/SAMD9L mutations in the tumor population. Black lines: SAMD9; Blue lines: SAMD9L; dashed lines indicate cases where a subclonal (3/20 metaphases) del(7) was detected only by conventional karyotyping
Fig. 5
Fig. 5
Ras/MAPK pathway mutations in pediatric MDS, MDS/MPN, and AML-MRC. a Heat map showing all Ras/MAPK pathway mutations, both somatic and presumed germline (cells with hatched lines indicate presumed germline variants from WES tumor/normal cases), in the pediatric MDS cohort (n = 77). b Growth curves of Ba/F3 cells transduced with retrovirus containing BRAF mutations. Blue curves indicate mutations found in the pediatric MDS cohort, and black curves are positive (V600E) and negative controls. Error bars indicate standard deviation. c Western blots of BRAF, total ERK, and phosphorylated ERK from lysates of 293 T cells transiently transfected with each BRAF mutation. Data are representative of three biological replicates
Fig. 6
Fig. 6
The genomic landscape of pediatric primary MDS. a Heat map indicating primary MDS patients, subdivided into RCC and RAEB categories, with somatic mutations, germline variants (cells with hatched lines), and transcript fusions. Ras/MAPK mutations are enriched in the RAEB subgroup (65% vs 17%, p= 0.002, Fisher’s exact test) b Ribbon plot showing associations between cytogenetic abnormalities and recurrent mutations in myeloid neoplasms. Data from WES and targeted amplicon sequencing of the primary MDS cohort (n = 46) was used to build the plot. Associations between a cytogenetic abnormality and a mutation are connected by a ribbon, the width of which is proportional to the frequency of that association

References

    1. Glaubach T, Robinson LJ, Corey SJ. Pediatric myelodysplastic syndromes: they do exist! J. Pediatr. Hematol. Oncol. 2014;36:1–7. doi: 10.1097/MPH.0000000000000046. - DOI - PubMed
    1. Hasle H. Myelodysplastic and myeloproliferative disorders of childhood. Hematol. Am. Soc. Hematol. Educ. Program. 2016;2016:598–604. - PMC - PubMed
    1. Papaemmanuil E, et al. Somatic SF3B1 mutation in myelodysplasia with ring sideroblasts. N. Engl. J. Med. 2011;365:1384–1395. doi: 10.1056/NEJMoa1103283. - DOI - PMC - PubMed
    1. Graubert TA, et al. Recurrent mutations in the U2AF1 splicing factor in myelodysplastic syndromes. Nat. Genet. 2011;44:53–57. doi: 10.1038/ng.1031. - DOI - PMC - PubMed
    1. Haferlach T, et al. Landscape of genetic lesions in 944 patients with myelodysplastic syndromes. Leukemia. 2014;28:241–247. doi: 10.1038/leu.2013.336. - DOI - PMC - PubMed

Publication types