. 2017 Nov 16;7(1):15752.
doi: 10.1038/s41598-017-15793-9.

Developmental excitatory-to-inhibitory GABA-polarity switch is disrupted in 22q11.2 deletion syndrome: a potential target for clinical therapeutics

Affiliations

Developmental excitatory-to-inhibitory GABA-polarity switch is disrupted in 22q11.2 deletion syndrome: a potential target for clinical therapeutics

Hayder Amin et al. Sci Rep. .

Abstract

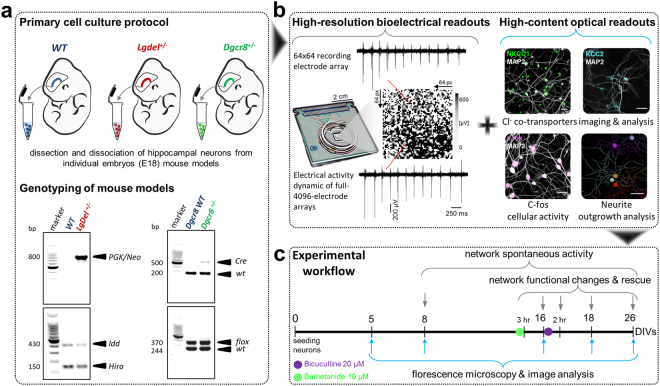
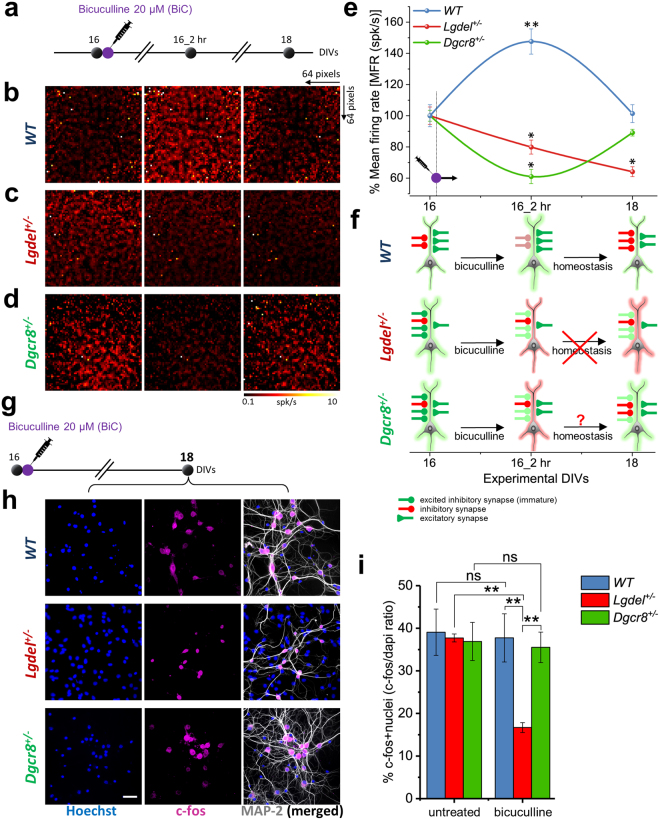
Individuals with 22q11.2 microdeletion syndrome (22q11.2 DS) show cognitive and behavioral dysfunctions, developmental delays in childhood and risk of developing schizophrenia and autism. Despite extensive previous studies in adult animal models, a possible embryonic root of this syndrome has not been determined. Here, in neurons from a 22q11.2 DS mouse model (Lgdel +/-), we found embryonic-premature alterations in the neuronal chloride cotransporters indicated by dysregulated NKCC1 and KCC2 protein expression levels. We demonstrate with large-scale spiking activity recordings a concurrent deregulation of the spontaneous network activity and homeostatic network plasticity. Additionally, Lgdel +/- networks at early development show abnormal neuritogenesis and void of synchronized spontaneous activity. Furthermore, parallel experiments on Dgcr8 +/- mouse cultures reveal a significant, yet not exclusive contribution of the dgcr8 gene to our phenotypes of Lgdel +/- networks. Finally, we show that application of bumetanide, an inhibitor of NKCC1, significantly decreases the hyper-excitable action of GABAA receptor signaling and restores network homeostatic plasticity in Lgdel +/- networks. Overall, by exploiting an on-a-chip 22q11.2 DS model, our results suggest a delayed GABA-switch in Lgdel +/- neurons, which may contribute to a delayed embryonic development. Prospectively, acting on the GABA-polarity switch offers a potential target for 22q11.2 DS therapeutic intervention.


Conflict of interest statement

The authors declare that they have no competing interests.

Figures

Figure 1
Figure 1
Schematic of experimental implementation of the 22q11.2 DS model. (a) Single-embryo primary cell culture preparation of hippocampal neurons from WT, Lgdel +/− and Dgcr8 +/− mice and their genotyping. Each cropped gel image reports two representative embryos from groups of animals genotyped for PGK/Neo (top left) and Idd/Hira alleles (bottom left) in (WT and Lgdel +/− embryos) or Cre (top right) and flox alleles (bottom right) in (Dgcr8 WT and Dgcr8 +/− embryos); “full-length gels are presented in Supplementary Figure S5”. (b) Overview of the experimental readouts used in this study, combining electrical measures and optical HCI. Scale bars represent 30 μm. (c) Workflow timeline of the experimental implementation.
Figure 2
Figure 2
Altered expression of NKCC1 and KCC2 in Lgdel +/− and Dgcr8 +/− neurons. (a) Fluorescence micrographs showing intensity expression of NKCC1 in cultures from WT, Lgdel +/− and Dgcr8 +/− (n = 5), at 8, 16, 26 DIVs. Scale bar represents 30 μm. (b) Quantification of NKCC1 intensity shows a significantly higher expression in Lgdel +/− neurons (n = 5) compared to WT neurons (n = 7) across all developmental ages (*p < 0.05, ANOVA) and slightly higher than Dgcr8 +/− neurons (n = 5) (ns denotes not significant). (c) Fluorescence micrographs showing the changes of intensity expression of KCC2 in cultures from the three animal genotypes at 8, 16, 26 DIVs. Scale bar represents 30 μm. (d) Quantification of KCC2 intensity at 8 DIVs shows the non-significant difference between genotypes (ns denotes not significant), but displaying a significantly lower expression in Lgdel +/− and Dgcr8 +/− neurons compared to WT neurons at 16 and 26 DIVs (*p < 0.05, ANOVA).
Figure 3
Figure 3
Altered GABAergic-signaling in Lgdel +/− and Dgcr8 +/− neurons is correlated with excitable neuronal network firing activity. (a) In WT neurons, the quantification of the fluorescence intensities of NKCC1 and KCC2 allows estimating an intersection point that indicates the GABA-polarity switch time point at 8 DIVs. Cartoon (right up) illustrates the physiological arrangement (size) of the chloride cotransporters derived from data at 16 DIVs, indicating low and high expression levels of NKCC1 and KCC2, respectively. (b) As in (a), but for Lgdel +/− neurons, the intersection point corresponding to the GABA-polarity switch is delayed with respect to WT, and it is estimated at ~20.5 DIVs. Cartoon (right middle) illustrates the high expression level of NKCC1 and the low expression level of KCC2 observed at 16 DIVs. (c) As in (a) and (b), but for Dgcr8 +/− neurons, the GABA-polarity switch is delayed with respect to WT, and it is estimated at ~17.5 DIVs. Cartoon (right down) illustrates the arrangement of NKCC1 and KCC2 cotransporters at 16 DIVs. (d) The MFR computed from the spontaneous activity of WT, Lgdel +/− and Dgcr8 +/− embryonic hippocampal neuronal networks at 8, 16 and 26 DIVs. At 16 DIVs, compared to WT, the hyper-excitable Lgdel +/− and Dgcr8 +/− networks showing evident correlation with the expression level of the chloride cotransporters and with the delayed GABA-polarity switches. The hyper-excitable state is indicated by a significantly higher MFR in Lgdel +/− and Dgcr8 +/− networks compared to WT networks (**denotes p < 0.01 Lgdel +/− vs. WT,++ denotes p < 0.01 Dgcr8 +/− vs. WT, ANOVA).
Figure 4
Figure 4
Electrical and optical evidence of dysregulated network homeostatic plasticity in Lgdel +/− and Dgcr8 +/− networks. (a) Schematic illustration of the experimental protocol used to test network homeostatic plasticity responses upon 20 µM bicuculline-treatment. (b) Snapshots showing the homogenous averaged MFR maps (64 × 64 electrode pixels) for a WT network at the different experimental time points and each map is computed for a recording of 10 minutes. (c) As in (b), but for a Lgdel +/− network. At 16 DIVs the network manifests an already higher averaged MFR than WT. Upon bicuculline-treatment the maps at 16_2 hr and 18 DIVs indicate a decrease of the network firing activity without the homeostatic restoration to the initial condition. (d) As in (b) and (c), but for a Dgcr8 +/− network. (e) Quantification of the MFR shows after bicuculline-treatment (16_2 hr), a significantly decrease in Lgdel +/− and Dgcr8 +/− networks, and a significantly increase in WT from the initial baseline (**p < 0.01 WT, *p < 0.05 Lgdel +/−, *p < 0.05 Dgcr8 +/−, ANOVA; n = 5). At 18 DIVs, the MFR continuously decreases in Lgdel +/− networks, while it returns to the baseline value in Dgcr8 +/− networks and sets to a nearly similar MFR of WT. (f) Cartoon illustrates the homeostatic regulation of the excitation-inhibition balance in WT, Lgdel +/− and Dgcr8 +/− neurons at the different time points. (g) Schematic of the experimental protocol used to assay the cellular neuronal activity with c-fos immunofluorescence after 48 hr from bicuculline-treatment. (h) Fluorescence micrographs showing the c-fos expression 48 hr after bicuculline-treatment in WT, Lgdel +/− and Dgcr8 +/− networks and confirming previous electrical read-outs. (i) Quantification of c-fos-positive nuclei ratio 48 hr after bicuculline-treatment. Data showing a significant decrease in expression in Lgdel +/− neurons compared to WT, and Dgcr8 +/− neurons (**p < 0.01, ANOVA; n = 5), as well as compared to the expression in Lgdel +/− neurons before bicuculline-treatment (untreated) (**p < 0.01, ANOVA, n = 5).
Figure 5
Figure 5
Desynchronization and deregulation of spontaneous bursting activity in Lgdel +/− networks over developmental phases. (a) Graphs display the network-wide averaged firing rate (AFR) and raster plots of the spiking activity from recordings in WT, Lgdel +/− and Dgcr8 +/− networks (n = 5) at 8, 16 and 26 DIVs. (b) MBR indicates the mean bursting rate computed for single electrodes. At 8 DIVs, the MBR displays a significantly lower value in Lgdel +/− network compared to WT and Dgcr8 +/− networks (**denotes p < 0.01 to WT, ++ denotes p < 0.01 to Dgcr8 +/−, ANOVA). During development, Lgdel +/− networks manifest a tendency to increase the MBR and reach the highest value at 26 DIVs, with a similar MBR to Dgcr8 +/− networks, but significantly lower than WT networks (**denotes p < 0.01, ANOVA). (c) The quantification of NBs shows the lack of Lgdel +/− networks to express these events at 8 DIVs compared to WT and Dgcr8 +/− networks. In all networks NBs increase over developmental phases. Lgdel +/− networks reach nearly similar NB counts of WT at 16 DIVs but manifest a significantly lower NB counts than Dgcr8 +/− network (*p < 0.01, ANOVA). At 26 DIVs Lgdel +/− networks manifest significantly lower NB counts than WT and Dgcr8 +/− networks (*p < 0.01, ANOVA). (d) Distribution of IBIs yielded from the temporal classification of bursts in the selected time bins from WT networks. (e) As in (d), but for Lgdel +/− networks. (f) As in (d) and (e), but for Dgcr8 +/− networks.
Figure 6
Figure 6
Neurite outgrowth measurements unveil alteration in neuromorphogenesis in Lgdel +/− and Dgcr8 +/− neurons. (a) Micrographs showing the raw image of WT neurons (MAP-2) and the segmentation mask for cell bodies (Hoechst) that are used by the neurite outgrowth algorithm to obtain the final cell body and neurite segmentation masks. Scale bar represents 30 µm. (b) Micrographs of WT, Lgdel +/− and Dgcr8 +/− neurons before segmentation (raw images) and after final segmentation. Scale bar is 30 µm. (c) Quantifications of neurite outgrowth measurements from WT, Lgdel +/− and Dgcr8 +/− neurons (n = 5 for). Statistical comparisons confirm that all parameters’ values in Lgdel +/− and Dgcr8 +/− neurons are significantly lower than WT neurons (**p < 0.01, ANOVA). (d) Signal traces of typical spontaneous spikes extracellularly recorded from WT, Lgdel +/− and Dgcr8 +/− cultures at 8 DIVs. (e) Quantifications of the negative peaks of the spontaneous extracellular spikes recorded from WT, Lgdel +/− and Dgcr8 +/− cultures (n = 5) at different time points (8, 12, 16, 18 DIVs). This analysis reveals the non-significant difference of the spike amplitudes between the genotypes.
Figure 7
Figure 7
Bumetanide rescues the abnormally excitable Lgdel +/− neuronal network and restores physiological homeostatic plasticity. (a) Schematic summary of the experimental protocol used to test the effect of 10 µM bumetanide (administrated 3 hr before the baseline recordings at 16 DIVs) to rescue the spontaneous hyper-excitable activity in Lgdel +/− networks. (b) MFR indicates the spontaneous firing activity of WT and Lgdel +/− networks across the developmental phases from 16 to 26 DIVs. After 3 hr from bumetanide-treatment, Lgdel +/− cultures at 16 DIVs exert 2-fold decrease of MFR compared to untreated Lgdel +/− cultures (**p < 0.01, ANOVA; n = 5) and express a nearly analogous MFR as WT cultures. At 18 DIVs, the MFR in bumetanide-treated Lgdel +/− cultures remains significantly low (1.67-fold) compared to the untreated cultures (**p < 0.01, ANOVA; n = 5). At 26 DIVs, bumetanide-untreated Lgdel +/− cultures exert a steep decrease in the MFR, while the BUM-treated Lgdel +/− cultures display 1.47-fold significant recovery (**p < 0.05, ANOVA; n = 5). (c) Schematic summary of the experimental protocol used to test the effect of 10 µM bumetanide (administrated 3 hr before the baseline recordings at 16 DIVs) to rescue dysregulated homeostatic plasticity response in Lgdel +/− networks upon 2 hr of 20 µM bicuculline-treatment. (d) At 16 DIVs, 5 hr after bumetanide-treatment and 2 hr after bicuculline, Lgdel +/− networks display 1.67-fold significant increase of MFR compared to bumetanide-untreated bicuculline-treated Lgdel +/− cultures (**p < 0.01, ANOVA; n = 5), and showing a nearly analogous MFR as WT cultures. At 18 DIVs, bumetanide-treated Lgdel +/− cultures display a complete restoration to the baseline activity recorded at 16 DIVs (prior bicuculline-treatment) compared to bumetanide-untreated Lgdel +/− cultures (*p < 0.01, ANOVA; n = 5).

References

    1. Drew LJ, et al. The 22q11.2 microdeletion: fifteen years of insights into the genetic and neural complexity of psychiatric disorders. Int. J. Dev. Neurosci. 2011;29:259–281. doi: 10.1016/j.ijdevneu.2010.09.007. - DOI - PMC - PubMed
    1. Niklasson L, Rasmussen P, Óskarsdóttir S, Gillberg C. Autism, ADHD, mental retardation and behavior problems in 100 individuals with 22q11 deletion syndrome. Res. Dev. Disabil. 2009;30:763–773. doi: 10.1016/j.ridd.2008.10.007. - DOI - PubMed
    1. Cook EH, Jr, Scherer SW. Copy-number variations associated with neuropsychiatric conditions. Nature. 2008;455:919–923. doi: 10.1038/nature07458. - DOI - PubMed
    1. Karayiorgou M, Simon TJ, Gogos JA. 22q11.2 microdeletions: linking DNA structural variation to brain dysfunction and schizophrenia. Nat. Rev. Neurosci. 2010;11:402–416. doi: 10.1038/nrn2841. - DOI - PMC - PubMed
    1. Robin NH, Shprintzen RJ. Defining the clinical spectrum of deletion 22q11.2. J. Pediatr. 2005;147:90–6. doi: 10.1016/j.jpeds.2005.03.007. - DOI - PubMed

MeSH terms

LinkOut - more resources