. 2017 Nov 17;49(11):e393.
doi: 10.1038/emm.2017.157.

The transcription factor Batf3 inhibits the differentiation of regulatory T cells in the periphery

Affiliations

The transcription factor Batf3 inhibits the differentiation of regulatory T cells in the periphery

Wonyong Lee et al. Exp Mol Med. .

Abstract

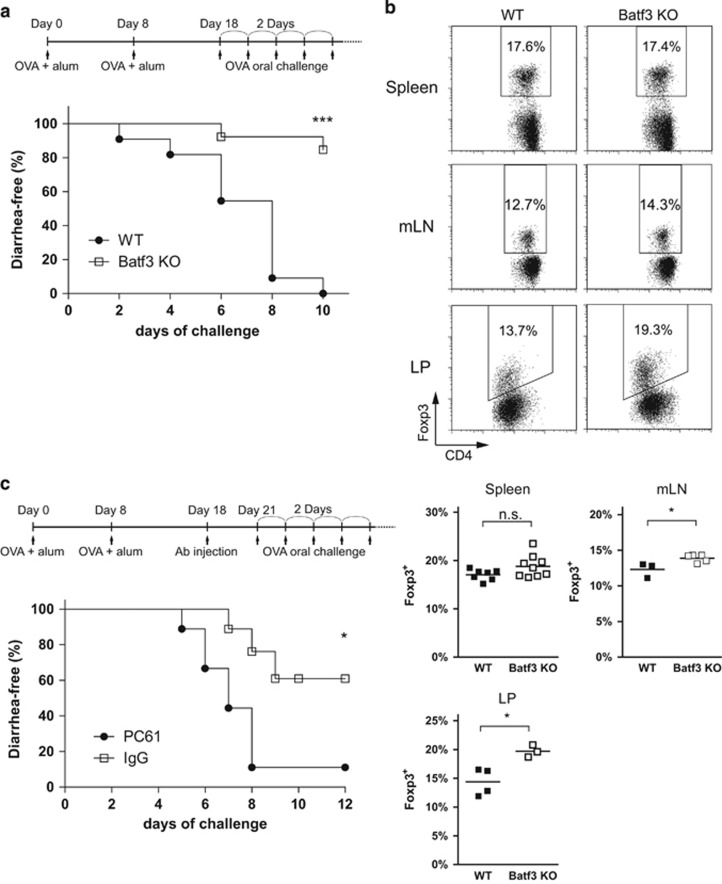
Naive CD4 T cells activated by antigen-presenting cells (APCs) undergo terminal differentiation in the periphery. Multiple mechanisms determine their fates, that is, whether they differentiate into conventional T (Tconv) cells or regulatory T (Treg) cells. The key event during Treg generation is expression of the transcription factor Foxp3, which is the lineage-determining regulator for Treg differentiation and function. Here we show that the transcription factor Batf3 acts as a fate-decision factor with respect to Tconv versus Tregs by restraining Treg differentiation. Batf3 was preferentially expressed in effector CD4 T cells but not in Treg cells, and ectopic expression of Batf3 inhibited Foxp3 induction. Batf3-deficient CD4 T cells favorably differentiated into Treg cells in vitro and in colonic lamina propria. Batf3 KO mice also showed enhanced Treg function in gut-associated immune disease models (for example, ovalbumin tolerance and inflammatory bowel disease models). Batf3 bound to the CNS1 region of the Foxp3 locus and reduced expression of the gene. Thus, Batf3 is a transcriptional suppressor of Treg differentiation.


Conflict of interest statement

The authors declare no conflict of interest.

Figures

Figure 1
Figure 1
Batf3 is selectively upregulated in effector CD4 T cells but not in T regulatory cells (Treg cells). (a) RT-PCR analysis of Batf3 mRNA expression in in vitro-differentiated Th1, Th2, Th17 and Treg cells. Hypoxanthine phosphoribosyltransferase (Hprt) mRNA was used as a loading control. (b) Kinetics of Batf3 mRNA expression in Th1, Th2, Th17 and Treg cells as measured by quantitative RT-PCR (qRT-PCR). Batf3 expression levels were normalized to those of Gapdh. (c) FACS analysis of CD62L and eGFP expression (left panel), and qRT-PCR analyses of Batf3 mRNA levels (right panel), in an enriched CD4+ cell population isolated from the splenocytes of Foxp3eGFP mice. The population was sorted into three groups: Tnaive, GFP/CD62L+ naive CD4 T cells; Teffs-mem, GFP/CD62L effector/memory T cells; and Treg cells, GFP+ Treg cells. The mRNA expression levels were normalized to those of Gapdh. The data are representative of two independent experiments (mean±s.e.m., n=3; Student’s t-test).
Figure 2
Figure 2
Ectopic expression of Batf3 represses Foxp3 production. (a) Naive CD4 T cells were activated and transduced with a control retroviral vector (MIEG3) or a Batf3-retroviral vector, and then cultured for 3 days under Th0, Th1, Th2, Th17 and Treg differentiation conditions. Cells were harvested, and total RNA was isolated. Levels of mRNA encoding master regulators in each subset were analyzed by qRT-PCR. The data were collected from six independent experiments (mean±s.e.m. Student’s t-test; n.s., not significant). (b) Naive CD4 T cells were activated and transduced with a control retroviral vector (MIEG3) or a Batf3-retroviral vector and then cultured for 5 days under Treg differentiation conditions. Levels of Foxp3 protein and cytokines were measured by intracellular staining. The data are representative of two independent experiments, each with similar results.
Figure 3
Figure 3
Batf3 inhibits Treg cell differentiation under mixed cytokine conditions in vitro. (a) Foxp3 staining of naive CD4 T cells from WT and Batf3 KO mice stimulated with various concentrations of hTGF-β1 for 3 days. (b) Foxp3 staining of naive CD4 T cells from WT and Batf3 KO mice stimulated with cytokines (hTGF-β1, 5 ng ml−1; IL-2, 1 ng ml−1; IL-12, 0.35 ng ml−1; and IL-4, 0.5 ng ml−1) and blocking antibodies (anti-IFN-γ and anti-IL-4; each at 10 μg ml−1) for 3 days. The numbers in the figure indicate the percentage of Foxp3+ cells. The data are representative of two independent experiments, each with similar results.
Figure 4
Figure 4
Increased Treg cell population in Batf3-deficient mice. (a) The frequencies of Foxp3+ T cells in the thymus, spleen, peripheral LNs (pLNs), mesenteric LNs (mLNs) and colonic lamina propria (LP) from 8- to 10-week-old WT and Batf3 KO mice. Cells were gated on CD4+ T cells. The data on the left are representative of four to seven independent experiments. The data on the right present the average of these independent experiments (mean±s.e.m., n=4–7, Student’s t-test; ***P<0.001, n.s., not significant). (b) Schematic diagram of mixed bone marrow chimera and composition of CD4+Foxp3+ T cells from several lymphoid organs of recipient mice (mean±s.e.m., n=4, Student’s t-test; *P<0.05, n.s., not significant).
Figure 5
Figure 5
Batf3-deficient mice are resistant to OVA-induced diarrhea. (a) The upper panel shows the procedure used to immunize WT and Batf3 KO mice with OVA and alum. Ten days after the second immunization, the mice were subjected to intragastric challenge with OVA every other day. The lower panel shows the diarrhea occurrence rate (mice showing watery stool during the first hour after challenge; n=22–26/group. ***P<0.0001, log-rank test). (b) Upper panels: FACS analysis of the frequency of Foxp3+ T cells in the thymus, spleen, mLNs, and colonic LP from the WT and Batf3 KO OVA-challenged mice in a. Lower panels: statistical analysis of the data shown above. Each data point represents an individual mouse (n=3–9/group, Student’s t-test; *P<0.05; n.s., not significant). (c) Batf3 KO BALB/c mice were immunized and intraperitoneally injected with 250 μg of PC61 or isotype IgG antibody before challenge as described in a. (n=9/group; *P<0.05, log-rank test).
Figure 6
Figure 6
Batf3-deficient naive CD4 T cells transferred into lymphopenic mice suppress colitis. (a) Body weights of C.B.17-SCID mice after adoptive transfer of PBS (control) or CD4+CD62L+CD25 naive T cells isolated from WT or Batf3 KO mice. Weight loss was measured every 3–4 days after injection of the cells (mean±s.e.m., n=4 animals/group; P<0.001, one-way ANOVA). The data are representative of three independent experiments, each with similar results. (b) Hematoxylin and eosin staining and (c) gross morphology of colon samples from C.B.17-SCID mice injected with PBS (control) or CD4+CD62L+CD25 naive T cells isolated from WT or Batf3 KO mice. Mice were killed on day 35 post induction of inflammatory bowel disease (scale bar, 10 μm). (d) Weights of the spleens from C.B.17-SCID mice injected with PBS (control) or CD4+CD62L+CD25 naive T cells isolated from WT or Batf3 KO mice. The mice were killed on day 35 post induction of inflammatory bowel disease (mean±s.e.m., n=4 animals per group; *P<0.05, one-way ANOVA).
Figure 7
Figure 7
Batf3 inhibits transcription of the Foxp3 gene by binding to the CNS1 region. (a) Chromatin immunoprecipitation of H3K4me3 on the Foxp3 locus. Naive CD4 T cells from WT and Batf3 KO mice were activated with IL-2 and hrTGF-β1. H3K4me3 in the region spanning −2 to +10 kb of the transcription start site of the Foxp3 locus was measured. The data are representative of three independent experiments (mean±s.e.m., n=3; *P<0.05, **P<0.005, ***P<0.001, Student’s t-test). (b) Chromatin immunoprecipitation analysis of Batf3 binding to CNS1, the promoter and intron 5–6 regions of the Foxp3 locus. Naive CD4 T cells were transduced with a Batf3-FLAG retroviral vector or with empty vector as a control. The data are expressed as the average of two independent experiments (mean±s.d., Student’s t-test; n.s., not significant). (c) Luciferase activity of pGL3 vectors containing the Foxp3 promoter, promoter-CNS1 or the AP-1-deleted promoter-CNS1 region. The vectors were transfected into EL4 cells. Control cells were transfected with an empty vector. One day after transfection, cells were stimulated with TGF-β (5 ng ml−1), PMA (P; 50 ng ml−1) and ionomycin (I; 1 mM) for 4 h as indicated, and luciferase activity was measured in the lysates. The data are expressed as the mean of six independent experiments (mean±s.d., Student’s t-test). (d) Luciferase activity of pGL3 vectors containing the Foxp3 promoter-CNS1 region in EL4 cells co-transfected with the indicated amounts of a Batf3 expression vector. One day after transfection, cells were stimulated with TGF-β (5 ng ml−1), PMA (P; 50 ng ml−1) and/or ionomycin (I; 1 mM) as indicated, and luciferase activity was measured in the lysates. The data are expressed as the mean of five independent experiments (mean±s.e.m. P<0.0001, two-way ANOVA). (e) Reduced reporter activity upon transfection of a Batf3 expression vector. The data from d were normalized against the corresponding control (Batf3-negative expression vector) (mean±s.e.m.; Student’s t-test).

Similar articles

Cited by

References

    1. Rudensky AY. Regulatory T cells and Foxp3. Immunol Rev 2011; 241: 260–268. - PMC - PubMed
    1. Ohkura N, Kitagawa Y, Sakaguchi S. Development and maintenance of regulatory T cells. Immunity 2013; 38: 414–423. - PubMed
    1. Benoist C, Mathis D. Treg cells, life history, and diversity. Cold Spring Harb Perspect Biol 2012; 4: a007021. - PMC - PubMed
    1. Abbas AK, Benoist C, Bluestone JA, Campbell DJ, Ghosh S, Hori S et al. Regulatory T cells: recommendations to simplify the nomenclature. Nat Immunol 2013; 14: 307–308. - PubMed
    1. Samstein RM, Josefowicz SZ, Arvey A, Treuting PM, Rudensky AY. Extrathymic generation of regulatory T cells in placental mammals mitigates maternal-fetal conflict. Cell 2012; 150: 29–38. - PMC - PubMed

Publication types

MeSH terms

Substances