. 2017 Nov 13:3:17070.
doi: 10.1038/cddiscovery.2017.70. eCollection 2017.

Cell death and cell lysis are separable events during pyroptosis

Affiliations

Cell death and cell lysis are separable events during pyroptosis

Lucian DiPeso et al. Cell Death Discov. .

Abstract

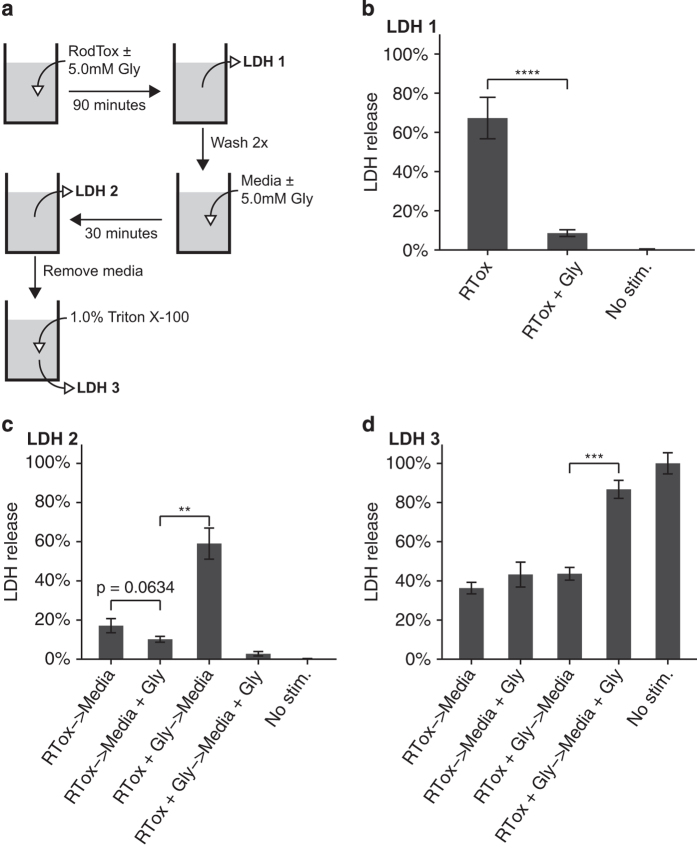
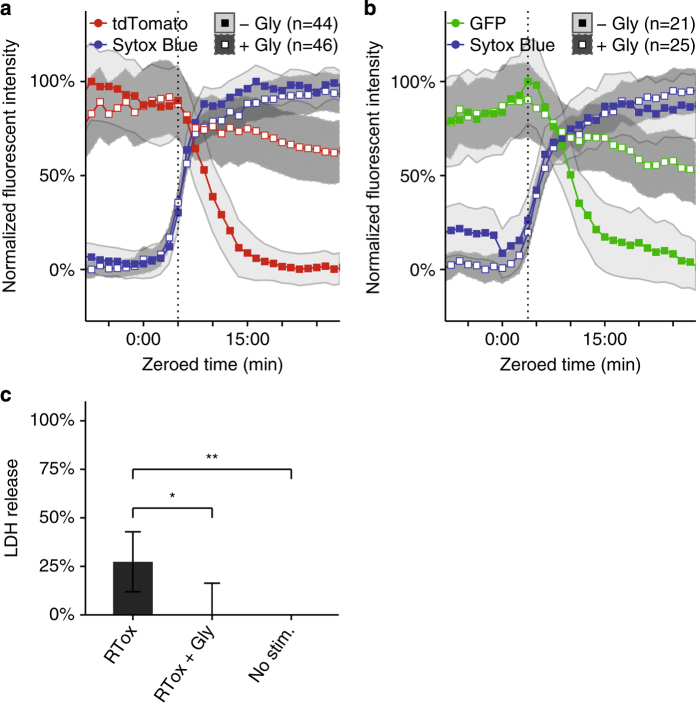
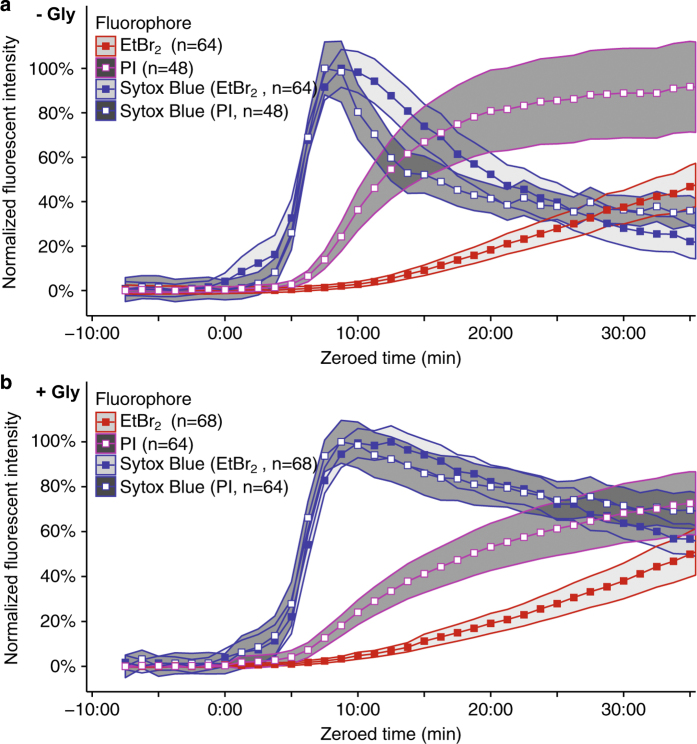
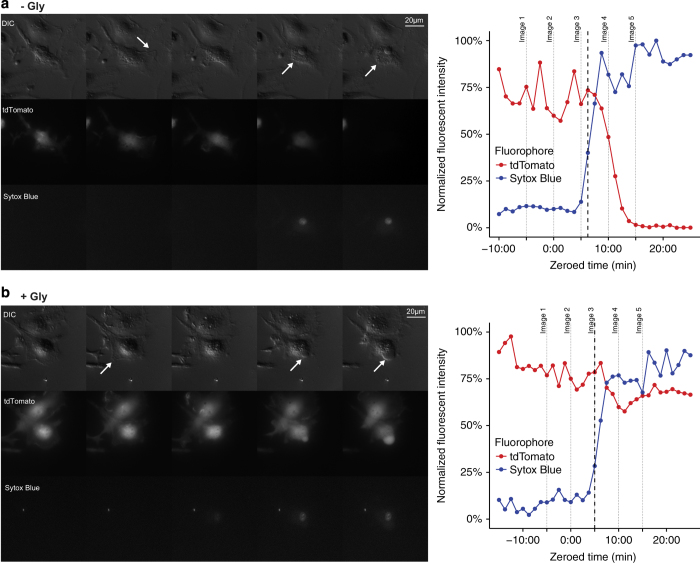
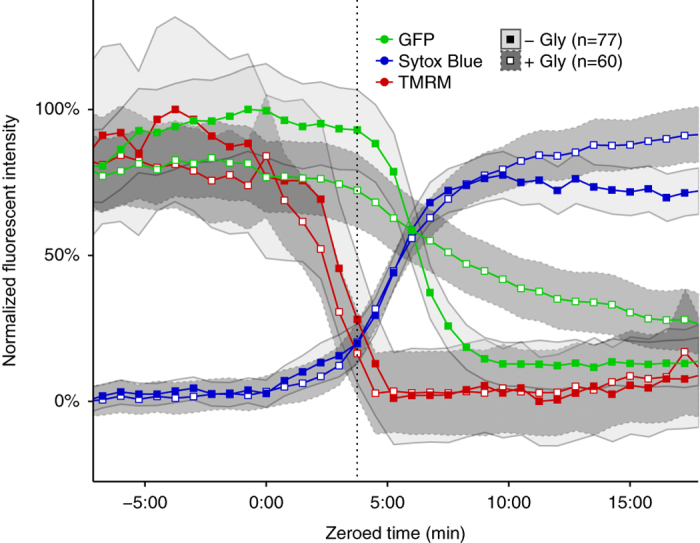
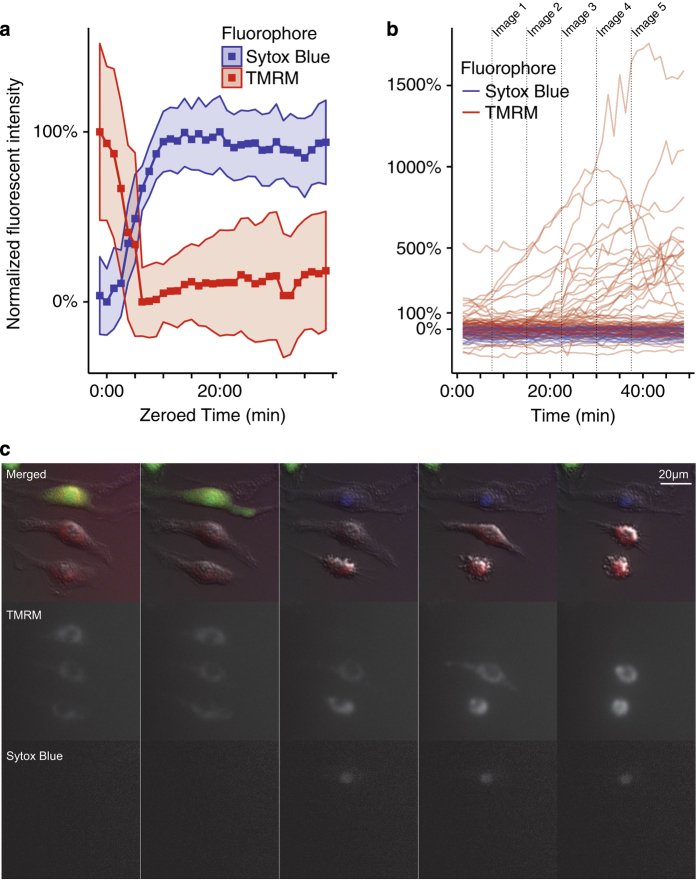
Although much insight has been gained into the mechanisms by which activation of the inflammasome can trigger pyroptosis in mammalian cells, the precise kinetics of the end stages of pyroptosis have not been well characterized. Using time-lapse fluorescent imaging to analyze the kinetics of pyroptosis in individual murine macrophages, we observed distinct stages of cell death and cell lysis. Our data demonstrate that cell membrane permeability resulting from gasdermin D pore formation is coincident with the cessation of cell movement, loss of mitochondrial activity, and cell swelling, events that can be uncoupled from cell lysis. We propose a model of pyroptosis in which cell death can occur independently of cell lysis. The uncoupling of cell death from cell lysis may allow for better control of cytosolic contents upon activation of the inflammasome.


Conflict of interest statement

The authors declare no conflict of interest.

Figures

Figure 1
Figure 1
Cell lysis can be delayed but not prevented following pyroptosis. (a) Overview of sequential stimulation and LDH measurement. (b) LDH release from BMMs treated with RodTox (RTox), RodTox+5 mM glycine (RTox+Gly), or media alone (no stim.) for 90 min. (c) LDH release from BMMs in b following wash and replacement with media±5 mM glycine for 30 min. (d) LDH release from BMMs in c following replacement with a 1% Triton X-100 solution in PBS. Data are depicted as % of LDH release from 1% Triton X-100-treated unstimulated BMMs at each step and are representative of three independent experiments. **P<0.01, ***P<0.001, ****P<0.0001, two-tailed Student’s t-test. RTox, RodTox; Gly, glycine.
Figure 2
Figure 2
Glycine inhibits cell lysis without affecting plasma membrane permeability. (a) Fluorescent intensities over time of Sytox Blue and tdTomato in tdTomato-expressing BMMs treated with RodTox±5 mM glycine. The start of tdTomato loss in the no-glycine condition is annotated with a vertical dotted line. Loss of tdTomato fluorescence is statistically significant±5 mM glycine (rANOVA, P=0.00391) (b) Fluorescent intensities over time of Sytox Blue and GFP in GFP-expressing BMMs treated with RodTox±5 mM glycine. The start of GFP loss in the no-glycine condition is annotated with a vertical dotted line. Loss of GFP fluorescence is statistically significant±5 mM glycine (rANOVA, P=0.0442). Data in a and b are pooled from three independent experiments and ‘n’ indicates total number of individual BMMs analyzed. Influx of sytox blue into macrophages was set to time 0 : 00 to align traces (see ‘Materials and methods’). tdTomato- and GFP-expressing WT macrophages were imaged in the presence of non-fluorescent caspase 1/11-deficient macrophages (please refer to Supplementary Videos 1 and 2). Lines represent the population mean and the shaded areas the 95% confidence interval. (c) Corresponding LDH release from imaging experiments in a and b measured 90 min post-stimulation with RodTox, depicted as mean % LDH release from 1% Triton X-100-treated unstimulated BMMs in each experiment. LDH release measurements in RodTox±5 mM glycine and RodTox versus unstimulated are significantly different (two-tailed Student’s t-test, P=0.0138, P=0.00744, respectively). ‘−Gly’, no supplemental glycine; ‘+Gly’, 5 mM supplemental glycine.
Figure 3
Figure 3
Small-molecular-weight nucleic acid-binding dyes stain pyroptotic BMMs with differential kinetics according to their size. (a) Fluorescent intensities over time of Sytox Blue, PI, and EtBr2 in non-fluorescent wild-type BMMs stimulated with RodTox in the absence of supplemental glycine. PI and EtBr2 staining is significantly delayed relative to Sytox Blue, P=0.022 and P=0.040, respectively, rANOVA. EtBr2 staining is significantly delayed relative to PI staining, P=2.9E-12, rANOVA. (b) Fluorescent intensities over time of Sytox Blue, PI, and EtBr2 in non-fluorescent wild-type BMMs stimulated with RodTox in the presence of 5 mM glycine. PI and EtBr2 staining is significantly delayed relative to Sytox Blue, P=0.00011 and P=2.94E-16, respectively, rANOVA. EtBr2 staining is significantly delayed relative to PI staining, P=7.76E-9, rANOVA. The delay in PI and EtBr2 staining relative to Sytox Blue staining is not significantly distinct±5 mM glycine, P=0.097 and P=0.394, respectively, rANOVA. In both a and b, Sytox Blue was paired with either PI or EtBr2 in separate imaging wells run in parallel and imaging data were aligned setting influx of Sytox blue to time 0 : 00 (see ‘Materials and Methods’). Lines represent the population mean and the shaded areas the 95% confidence interval. Data in a and b are pooled from two independent experiments and ‘n’ indicates total number of individual BMMs analyzed. ‘−Gly’, no supplemental glycine; ‘+Gly’, 5 mM supplemental glycine.
Figure 4
Figure 4
Cells cease ruffling and begin to swell following pore formation even in the absence of lysis. DIC, TRITC (tdTomato), and DAPI (Sytox Blue) channel images taken from imaging time series (left) and quantified fluorescent signal (right) of individual tdTomato-expressing BMMs exposed to (a) RodTox or (b) RodTox+5 mM glycine, taken at 75 s intervals. Cell movement (in the form of membrane ‘ruffling’) is indicated by an arrow in the second frame. Cell swelling is indicated by arrows in frames 4 and 5. The cessation of cell movement (see ‘Materials and Methods’) is annotated with a dashed line in each graph. Images in a and b are stills taken from kinetic imaging experiments depicted in Supplementary Videos 3 and 4, respectively, and correspond to the dotted lines labeled ‘Image 1’, ‘Image 2’, etc. in the associated graphs. The data presented are representative of individual macrophages observed in three independent experiments. ‘−Gly’, no supplemental glycine; ‘+Gly’, 5 mM supplemental glycine.
Figure 5
Figure 5
Mitochondrial activity ceases following GSDMD pore formation. Fluorescent intensities of Sytox Blue, GFP, and tetramethylrhodamine methyl ester (TMRM) in GFP-expressing BMMs following exposure to RodTox±5 mM glycine. The start of GFP loss in the no-glycine condition is indicated with a vertical dotted line. Loss of GFP and TMRM fluorescence differ significantly±5 mM glycine (rANOVA, P<2E-16, P=0.0337, respectively). Data are pooled from six independent experiments and ‘n’ indicates total number of individual BMMs analyzed, with cells imaged every 45 s. Lines represent the population mean and shaded areas the 95% confidence interval. Influx of Sytox Blue into macrophages was set to time 0 : 00 to align traces. ‘−Gly’, no supplemental glycine; ‘+Gly’, 5 mM supplemental glycine.
Figure 6
Figure 6
GSDMD is required for loss of cell movement and mitochondrial activity following inflammasome stimulus. (a) TMRM and Sytox Blue fluorescence observed in wild-type GFP-expressing BMMs following exposure to RodTox, with traces aligned according to Sytox Blue influx. (b) TMRM and Sytox Blue fluorescence observed in non-fluorescent GSDMD-deficient BMMs following exposure to RodTox. Traces from each cell were not aligned and instead are depicted over the timecourse of the experiment. TMRM fluorescence intensity in GSDMD-deficient BMMs is scaled relative to wild-type GFP-expressing controls such that 100% fluorescence intensity of GSDMD-deficient BMMs is equivalent to the mean 100% fluorescence intensity of wild-type controls (see Materials and methods). (c) Time series of TMRM, Sytox Blue, and merged-channel (showing DIC, GFP, TMRM, and Sytox Blue) images wild-type GFP-expressing and non-fluorescent GSDMD-deficient BMMs following exposure to RodTox in the presence of TMRM. Following pretreatment with TMRM, WT and GSDMD-deficient BMMs were stimulated with RodTox and imaged in the same wells (please refer to Supplementary Video 5). Images in c are stills taken from a kinetic imaging experiment depicted in Supplementary Video 5, and correspond to the dotted lines labeled ‘Image 1’, ‘Image 2’, etc. in b. Data depicted are representative of three independent experiments.

References

    1. Bergsbaken T, Fink SL, Cookson BT. Pyroptosis: host cell death and inflammation. Nat Rev Microbiol 2009; 7: 99–109. - PMC - PubMed
    1. Jorgensen I, Rayamajhi M, Miao EA. Programmed cell death as a defence against infection. Nat Rev Immunol 2017; 17: 151–164. - PMC - PubMed
    1. Shi J, Zhao Y, Wang K, Shi X, Wang Y, Huang H et al. Cleavage of GSDMD by inflammatory caspases determines pyroptotic cell death. Nature 2015; 526: 660–665. - PubMed
    1. Kayagaki N, Stowe IB, Lee BL, O'Rourke K, Anderson K, Warming S et al. Caspase-11 cleaves gasdermin D for non-canonical inflammasome signalling. Nature 2015; 526: 666–671. - PubMed
    1. He WT, Wan H, Hu L, Chen P, Wang X, Huang Z et al. Gasdermin D is an executor of pyroptosis and required for interleukin-1beta secretion. Cell Res 2015; 25: 1285–1298. - PMC - PubMed