. 2017 Sep 7;2(3):e000345.
doi: 10.1136/bmjgh-2017-000345. eCollection 2017.

Modelling historical changes in the force-of-infection of Chagas disease to inform control and elimination programmes: application in Colombia

Affiliations

Modelling historical changes in the force-of-infection of Chagas disease to inform control and elimination programmes: application in Colombia

Zulma M Cucunubá et al. BMJ Glob Health. .

Abstract

Background: WHO's 2020 milestones for Chagas disease include having all endemic Latin American countries certified with no intradomiciliary Trypanosoma cruzi transmission, and infected patients under care. Evaluating the variation in historical exposure to infection is crucial for assessing progress and for understanding the priorities to achieve these milestones.

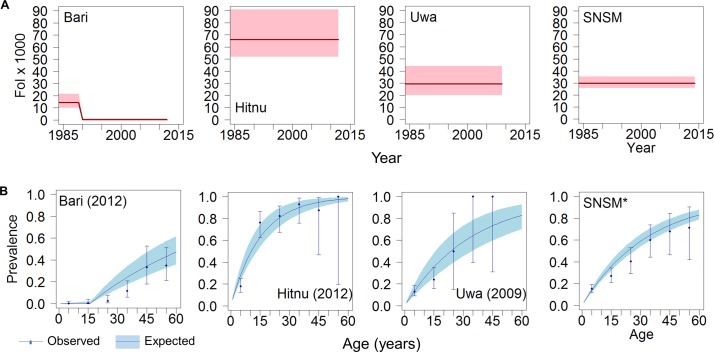
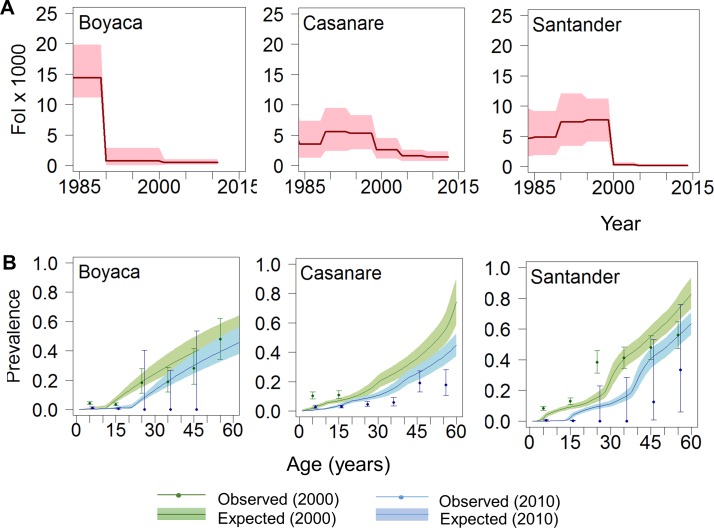
Methods: Focusing on Colombia, all the available age-structured serological surveys (undertaken between 1995 and 2014) were searched and compiled. A total of 109 serosurveys were found, comprising 83 742 individuals from rural (indigenous and non-indigenous) and urban settings in 14 (out of 32) administrative units (departments). Estimates of the force-of-infection (FoI) were obtained by fitting and comparing three catalytic models using Bayesian methods to reconstruct temporal and spatial patterns over the course of three decades (between 1984 and 2014).

Results: Significant downward changes in the FoI were identified over the course of the three decades, and in some specific locations the predicted current seroprevalence in children aged 0-5 years is <1%. However, pronounced heterogeneity exists within departments, especially between indigenous, rural and urban settings, with the former exhibiting the highest FoI (up to 66 new infections/1000 people susceptible/year). The FoI in most of the indigenous settings remain unchanged during the three decades investigated. Current prevalence in adults in these 15 departments varies between 10% and 90% depending on the dynamics of historical exposure.

Conclusions: Assessing progress towards the control of Chagas disease requires quantifying the impact of historical exposure on current age-specific prevalence at subnational level. In Colombia, despite the evident progress, there is a marked heterogeneity indicating that in some areas the vector control interventions have not been effective, hindering the possibility of achieving interruption by 2020. A substantial burden of chronic cases remains even in locations where serological criteria for transmission interruption may have been achieved, therefore still demanding diagnosis and treatment interventions.

Keywords: chagas disease; control strategies; cross-sectional survey; mathematical modelling; serology.


Conflict of interest statement

Competing interests: None declared.

Figures

Figure 1
Figure 1
Geographical distribution of serosurveys of Trypanosoma cruzi infection in Colombia. Locations are endemic departments (in green); size of the circles represents sample size; colours represent type of epidemiological setting; for departments in grey there are no available seroprevalence data. Inset shows location of Colombia in Latin America.
Figure 2
Figure 2
Geographical, temporal and setting-level heterogeneities in the force-of-infection (FoI) of Chagas disease in Colombia. (A) Averaged FoI from individual serosurveys for subnational (first administrative) level (departments) per 1000 population at-risk per year. ANT, Antioquia; ARA, Arauca; BOL, Bolívar; CAS, Casanare; CES, Cesar; CUN, Cundinamarca; GUN, Guainía; MAG, Magdalena; MET, Meta; NST, Norte Santander; SAN, Santander; SNSM, Sierra Nevada de Santa Marta; SUC, Sucre; TOL, Tolima. The location of the departments has been provided in figure 1. (B) Averaged (overall) FoI by quinquennial period. (C) Averaged FoI by quinquennial period and type of setting (rural indigenous, mixed, rural-non-indigenous and urban). Bottom and top of the box are first and third quartiles; the horizontal band inside is the median; the whiskers are the minimum and maximum 1.5 IQR and the solid circles are the outlier values.
Figure 3
Figure 3
Force-of-infection (FoI) and prevalence trends of Chagas disease in four different indigenous settings in Colombia. (A) FoI per 1000 population at-risk per year vs year for the period 1984–2014. Red solid lines represent median FoI and pink shaded areas the 95% Bayesian Credible Intervals (95% BCI) according to best-fit models. (B) Age profiles of Chagas disease seroprevalence in specific years. Blue solid lines represent median predicted prevalence and coloured shaded areas the 95% BCI; solid circles represent observed prevalence values (plotted for the midpoint of each 10 year age range) and error bars are exact 95% CI. Panels from left to right correspond to four different indigenous groups, namely, Bari (Santander Norte) in 2012, Hitnu (Arauca) in 2012, Uwa (Boyacá) in 2009 and Sierra Nevada de Santa Marta (SNSM*, two serosurveys in 2007–2014).
Figure 4
Figure 4
Temporal trends in the force-of-infection (FoI) and age-prevalence profiles of Chagas disease in Colombia at subnational level in three of the most endemic departments. (A) FoI per 1000 population at-risk per year vs year for the period 1984–2014. Red solid lines represent median FoI and pink shaded areas the 95% Bayesian Credible Intervals (95% BCI) according to best-fit models. (B) Age profiles of Chagas disease seroprevalence for 2000 (green) and 2010 (blue). Coloured solid lines represent median predicted prevalence and coloured shaded areas the 95% BCI; solid circles represent observed prevalence values (plotted for the midpoint of each 5-year age range) and error bars are exact 95% CI. Panels from left to right correspond to Boyacá (model 2), Casanare (model 3) and Santander (model 3).
Figure 5
Figure 5
Maps illustrating spatiotemporal changes in force-of-infection (FoI) of Chagas disease in Colombia (1990–2014). Colour intensity represents the magnitude of the FoI (per 1000 population at-risk per year); for departments in grey there are no available seroprevalence data. The identification of the departments has been provided in figure 1.
Figure 6
Figure 6
Temporal trends in force-of-infection (FoI) and age-prevalence profiles of Chagas disease in Colombia at setting level. (A) FoI per 1000 population at-risk per year vs year for the period 1984–2014. Red solid lines represent median FoI and pink shaded areas the 95% Bayesian Credible Intervals (95% BCI) according to best-fit models. (B) Age profiles of Chagas disease seroprevalence for 2000 (green) and 2010 (blue). Coloured solid lines represent median predicted prevalence and correspondingly coloured shaded areas the 95% BCI; solid circles represent observed prevalence values (plotted for the midpoint of each 5-year age range) and error bars are exact 95% CI. Left, centre and right panels correspond, respectively, to indigenous (model 1), rural non-indigenous (model 3) and urban (model 2) settings.

References

    1. World health organization. Chagas disease in Latin America: an epidemiological update based on 2010 estimates. Wkly Epidemiol Rec 2015;90:33–43 http://www.ncbi.nlm.nih.gov/pubmed/25671846 - PubMed
    1. Lozano R, Naghavi M, Foreman K, et al. . Global and regional mortality from 235 causes of death for 20 age groups in 1990 and 2010: a systematic analysis for the global burden of disease study 2010. The Lancet 2012;380:2095–128. 10.1016/S0140-6736(12)61728-0 - DOI - PMC - PubMed
    1. Cucunubá ZM, Okuwoga O, Basáñez M-G, et al. . Increased mortality attributed to chagas disease: a systematic review and meta-analysis. Parasit Vectors 2016;9:42 10.1186/s13071-016-1315-x - DOI - PMC - PubMed
    1. Reithinger R, Tarleton RL, Urbina JA, et al. . Eliminating chagas disease: challenges and a roadmap. BMJ 2009;338:b1283 10.1136/bmj.b1283 - DOI - PMC - PubMed
    1. Tarleton RL, Gürtler RE, Urbina JA, et al. . Chagas disease and the London declaration on neglected tropical diseases. PLoS Negl Trop Dis 2014;8:e3219 10.1371/journal.pntd.0003219 - DOI - PMC - PubMed