. 2017 Jul 31;6(11):e1356147.
doi: 10.1080/2162402X.2017.1356147. eCollection 2017.

Immune signature profiling identified predictive and prognostic factors for esophageal squamous cell carcinoma

Affiliations

Immune signature profiling identified predictive and prognostic factors for esophageal squamous cell carcinoma

Yuan Li et al. Oncoimmunology. .

Abstract

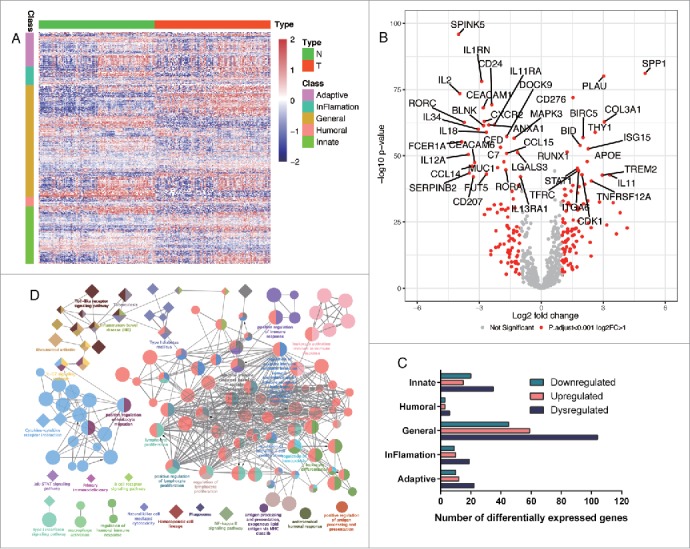
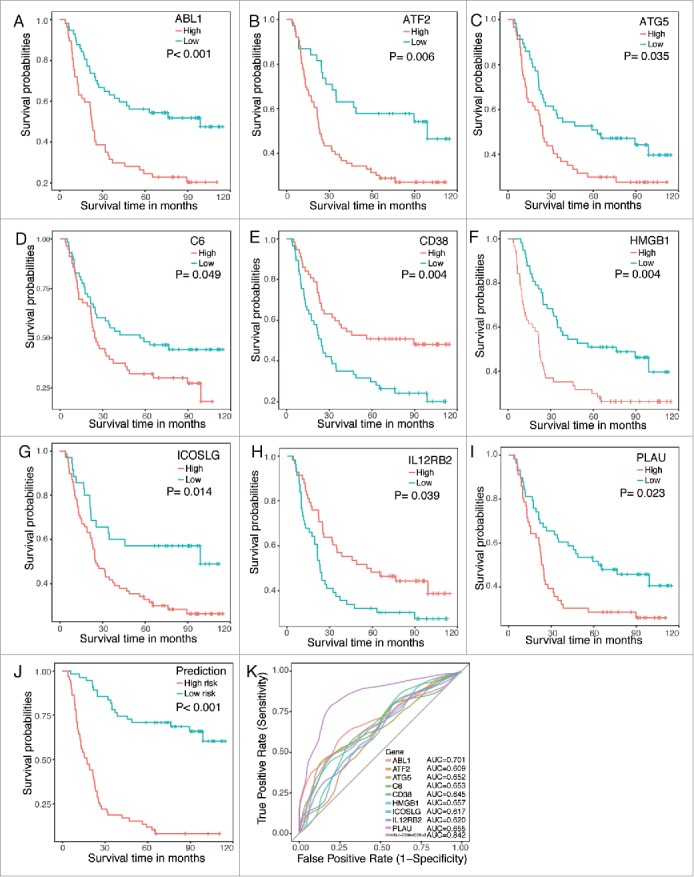
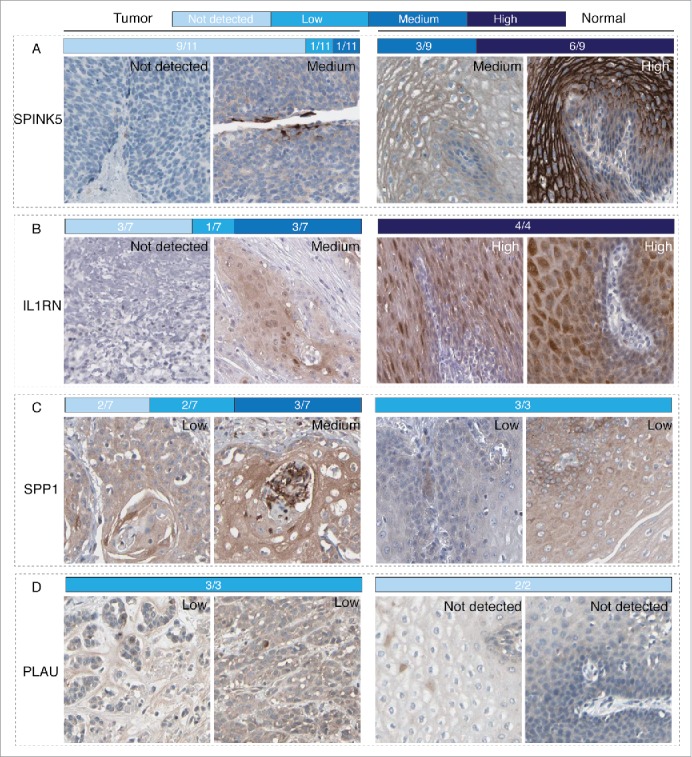
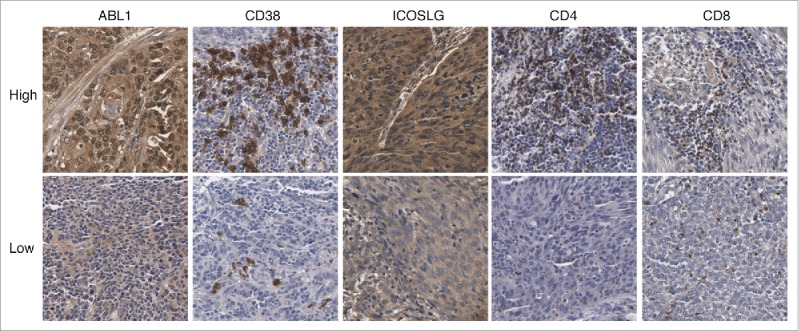
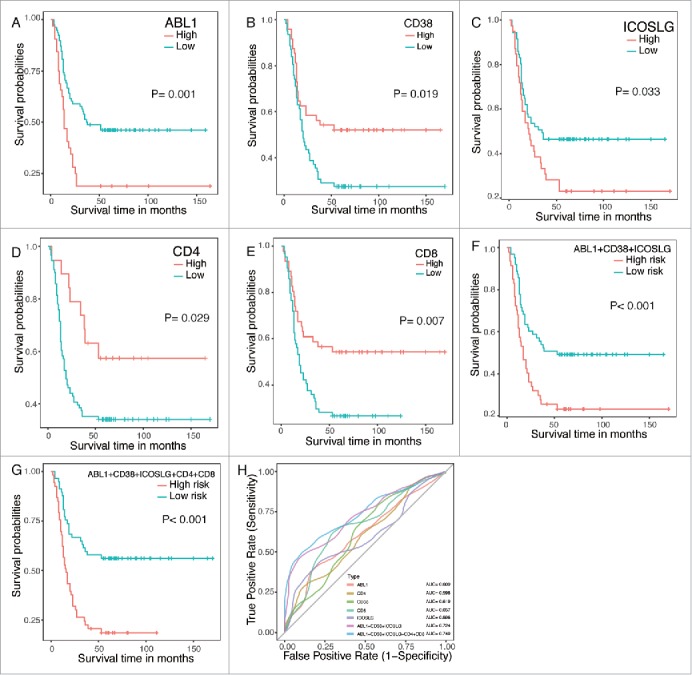
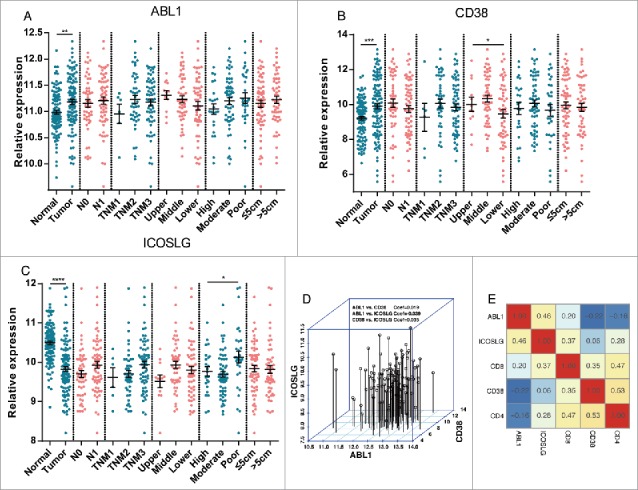
Understanding interactions between tumor and the host immune system holds great promise to uncover biomarkers for targeted therapies and clinical outcomes. However, systematical analysis of immune signatures in esophageal squamous cell carcinoma (ESCC) remains largely unstudied. In this study, immune signatures containing 708 immune related genes were curated from mRNA microarray data with tumor and paired normal tissues from 119 ESCC patients. Differential expression and survival analysis were performed with validations from Human Protein Atlas and an independent cohort of 110 ESCC patients by immunohistochemistry staining. We identified a total of 186 significantly dysregulated genes in ESCC, including downregulated genes SPINK5, IL1RN and upregulated genes SPP1 and PLAU, which were further confirmed in Human Protein Atlas data. Moreover, nine immune related genes (ABL1, ATF2, ATG5, C6, CD38, HMGB1, ICOSLG, IL12RB2 and PLAU) were significantly associated with patients' overall survival, among which, prognostic model was built including three independent factors ABL1, CD38 and ICOSLG. Validation by immunohistochemistry staining suggested that combination with tumor infiltrated CD4+ and CD8+ T lymphocytes would yield higher performance in distinguishing cases as high or low risk of unfavorable prognosis. In summary, we profiled the immune status in ESCC and established predictive and prognostic factors for ESCC, which could reflect immune disorders within tumor microenvironments and independently distinguish patients with a high risk of reduced survival, providing novel predictive and therapeutic targets for ESCC patients in the future.

Keywords: ABL1; CD38; ICOSLG; esophageal squamous cell carcinoma; immune; prognosis; tumor-infiltrated lymphocyte.


Figures

Figure 1.
Figure 1.
Differentially expressed immune signatures in ESCC and enriched GO and KEGG. Panel A. expression of immune signature containing 708 immune related genes in ESCC tissues (T) and paired normal tissues (N) were shown as heatmap. Generally, these genes were classified into five groups: adaptive, inflammation, general, humoral, and innate immune response genes. Panel B. Significantly downregulated and upregulated genes in ESCC were shown as volcano plot. Red dots represent significantly dysregulated genes which were defined as adjusted P value less than 0.001 and fold change bigger than 2. Panel C. Distribution of significantly dysregulated genes among the five classes. Major of the dysregulated genes were enriched in general immune response and upregulated or downregulated genes seemed to be equally divided in each class. Panel D. Significantly enriched GO and KEGG. Circles represent enriched GO while diamonds represent enriched KEGG. Objects with the same color belongs to the same group with labels in the same color by the side. Interactions between GO and or KEGG were lined up otherwise were placed alone.
Figure 2.
Figure 2.
Kaplan-Meier plots and ROC curves of the survival associated genes in the microarray data. Panel A to I. Kaplan-Meier plots of the nine survival associated genes. Patients were divided into high expression (red line) and low expression (blue line) based on their gene expression by mean cut. Panel J. Kaplan-Meier plot of the prognostic predictor built with three independent factors ABL1, CD38 and ICOSLG. Patients were divided into high risk (red line) and low risk (blue line) by the prediction of the predictor. Panel K. ROC curves of each parameters with AUC scores.
Figure 3.
Figure 3.
IHC validations of the top2 downregulated and upregulated genes in ESCC. Representative images for expression of each genes in ESCC tissues and normal esophageal tissues were shown with the fraction of samples with antibody staining/protein expression level high, medium, low, or not detected were provided by the blue-scale color-coding. Panel A and B. Expression of SPINK5 and IL1RN, which were top2 downregulated genes in the microarray data, in ESCC tissues were obviously lower than that in normal esophageal tissues. Panel C and D. Expression of SPP1 and PLAU, which were top2 upregulated genes in the microarray data, in ESCC tissues were obviously higher than that in normal esophageal tissues.
Figure 4.
Figure 4.
Representative images of expression of ABL1, CD38, ICOSLG, CD4 and CD8 in ESCC tissues by IHC staining.
Figure 5.
Figure 5.
IHC validations of prognostic factors in ESCC. The independent prognostic factors ABL1, CD38 and ICOSLG were chosen as candidates in the validations. CD4+ and CD8+ T lymphocytes were also detected as controls. Panel A to E. Kaplan-Meier plots of each gene with red line represent high expression group while blue lines represent low expression group. Panel F and G. Kaplan-Meier plots of predictors built with the specific genes. Panel H. ROC curves of each parameters with AUC scores.
Figure 6.
Figure 6.
Interactions between important prognostic factors and clinicopathologic parameters. Panel A to C. Relationships between the three independent factors (ABL1, CD38 and ICOSLG) and the tumor characteristics, including comparison with normal esophageal tissues, N stage (N0 and N1), TNM stage (TNM1, TNM2 and TNM3), tumor location (Upper, Middle and Lower), tumor grade (High, Moderate, Low) and maximal tumor diameter (≤5 cm and >5 cm) were analyzed. Panel D. Correlations between ABL1, CD38 and ICOSLG expression in the microarray cohort. No significant correlation between these three genes was detected. Panel E. Correlations between ABL1, CD38, ICOSLG, CD4 and CD8 expression in the tissue array cohort. Correlation efficiencies were labeled in the matrix with scaled color indications. *, P < 0.05; **, P < 0.01; ***, P < 0.001; ****, P < 0.0001.

References

    1. Rustgi AK, El-Serag HB. Esophageal carcinoma. N Engl J Med. 2014; 371:2499-509. doi: 10.1056/NEJMra1314530. PMID:25539106 - DOI - PubMed
    1. Gupta B, Kumar N. Worldwide incidence, mortality and time trends for cancer of the oesophagus. Eur J Cancer Prev. 2017;26:107-18. doi: 10.1097/CEJ.0000000000000249. PMID:27014938 - DOI - PubMed
    1. Chen W, Zheng R, Baade PD, Zhang S, Zeng H, Bray F, Jemal A, Yu XQ, He J. Cancer statistics in China, 2015. CA Cancer J Clin. 2016;66:115-32. doi: 10.3322/caac.21338. PMID:26808342 - DOI - PubMed
    1. Arnold M, Soerjomataram I, Ferlay J, Forman D. Global incidence of oesophageal cancer by histological subtype in 2012. Gut. 2015;64:381-7. doi: 10.1136/gutjnl-2014-308124. PMID:25320104 - DOI - PubMed
    1. Torre LA, Bray F, Siegel RL, Ferlay J, Lortet-Tieulent J, Jemal A. Global cancer statistics, 2012. CA Cancer J Clin. 2015;65:87-108. doi: 10.3322/caac.21262. PMID:25651787 - DOI - PubMed

Publication types