. 2016 Sep;1(3):323-337.
doi: 10.1002/btm2.10036. Epub 2016 Oct 3.

Stimuli-Responsive Delivery of Therapeutics for Diabetes Treatment

Affiliations

Stimuli-Responsive Delivery of Therapeutics for Diabetes Treatment

Jicheng Yu et al. Bioeng Transl Med. 2016 Sep.

Abstract

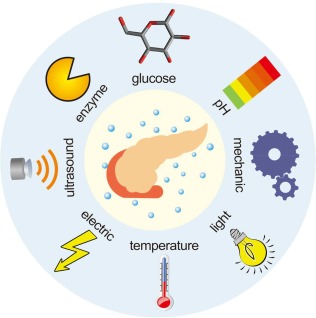
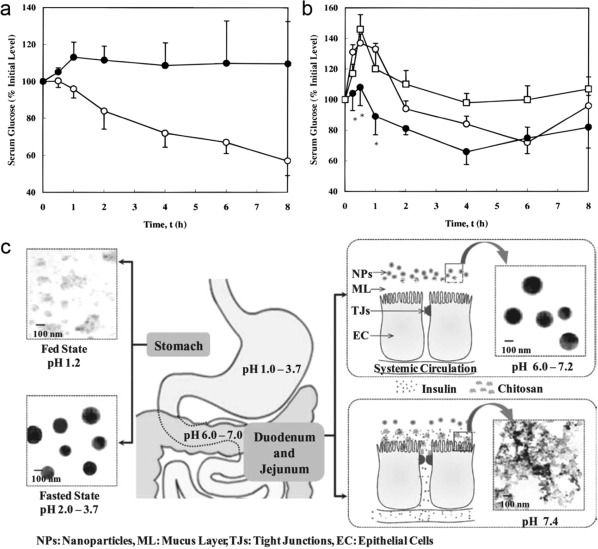
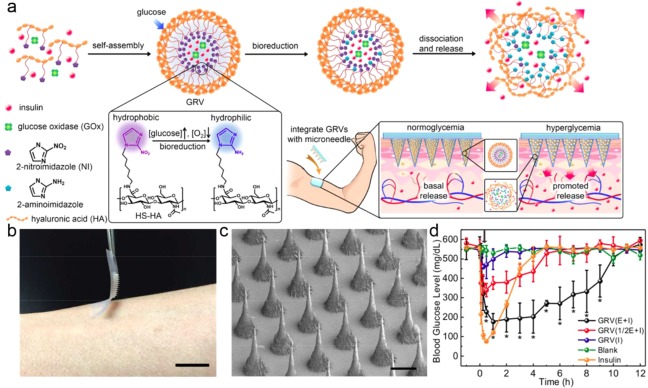
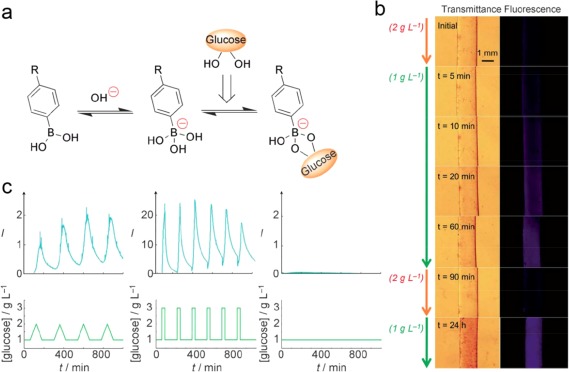
Diabetic therapeutics, including insulin and glucagon-like peptide 1 (GLP-1), are essential for diabetic patients to regulate blood glucose levels. However, conventional treatments that are based on subcutaneous injections are often associated with poor glucose control and a lack of patient compliance. In this review, we focus on the different stimuli-responsive systems to deliver therapeutics for diabetes treatment to improve patient comfort and prevent complications. Specifically, the pH-responsive systems for oral drug delivery are introduced first. Then, the closed-loop glucose-responsive systems are summarized based on different glucose-responsive moieties, including glucose oxidase (GOx), glucose binding protein (GBP), and phenylboronic acid (PBA). Finally, the on-demand delivery systems activated by external remote triggers are also discussed. We conclude by discussing advantages and limitations of current strategies, as well as future opportunities and challenges in this area.

Keywords: diabetes; drug delivery; insulin; stimuli-responsive.


Figures

Figure 1
Figure 1
Schematic of a variety of stimuli to trigger delivery of diabetic therapeutics for diabetes treatment
Figure 2
Figure 2
(a) Blood glucose levels in diabetic rats following oral administration of 25 IU/kg body weight doses contained in (○) P(MAA‐g‐EG) microspheres and (•) insulin solutions. (b) Blood glucose response in healthy rats following the oral administration of P(MAA‐g‐EG) microspheres containing insulin doses of (○) 25 IU/kg body weight and (•) 50 IU/kg body weight and (□) insulin solutions (50 IU/kg body weight). (c) Schematic illustrations of the presumed mechanism of the paracellular transport of insulin released from pH‐responsive NPs. Reproduced with permission from Refs. 22, 34
Figure 3
Figure 3
Hypoxia‐sensitive vesicle loaded MN‐array patches for glucose‐responsive insulin delivery. (a) Schematic of the formation and release mechanism of GRV and the GRV‐containing MN‐array patch for in vivo insulin delivery triggered by a hyperglycemic state. (b) Photograph of the MN‐array patch. (Scale bar: 1 cm) (c) SEM image of MN‐arrays. (Scale bar: 200 μm) (d) BGLs in diabetic mice after treatment with blank MNs containing only cross‐linked HA, MNs loaded with human recombinant insulin, MNs loaded with GRV(E + I), MNs loaded with GRV(1/2E + I), or MNs loaded with GRV(I). Reproduced with permission from Ref. 54
Figure 4
Figure 4
Gels composed of AmECFPBA for self‐regulated insulin delivery. (a) Glucose‐dependent equilibrium of phenylboronic acid. (b) Time‐course (left) transmittance and (right) 8‐anilino‐1‐naphthalene sulfonic acid (ANS) fluorescence top‐view images of a cylinder‐shaped piece of gel when changing the glucose concentration under pH 7.4 and 37°C. (c) (Top) Time‐course changes in the fluorescence intensity of FITC‐labeled bovine insulin released from the gel under physiological conditions (pH 7.4, I = 0.15, 37°C). (Bottom) Temporal patterns of the fluctuation in glucose concentration, investigated in each experiment. Reproduced with permission from Ref. 110
Figure 5
Figure 5
Ultrasound‐mediated transdermal insulin delivery. (a) Time variation of the amount of insulin transported across human skin (in vitro) in the presence of ultrasound (20 kHz, 100‐ms pulses applied every second) at 12.5 (▪), 62.5 (♦), 125 (•), and 225 mW/cm2 (▲). (b) Variation of the transdermal insulin permeability (in vitro) with ultrasound intensity (20 kHz, 100‐ms pulses applied every second). (c) Time variation of blood glucose concentrations of 16‐week‐old hairless rats on 1 hr insulin‐ultrasound treatment at 12.5 (•), 62.5 (▲), 125 (♦), and 225 mW/cm2 (▪). (d) Time variation of blood glucose concentration of hairless rats exposed to ultrasound (20 kHz, 225 mW/cm2, 100‐ms pulses applied every second) for different times. Ultrasound was turned on at 1 hr and was turned off after 1 min (•), 10 min (▲), and 1 hr (▪). Control (□). Reproduced with permission from Ref. 115
Figure 6
Figure 6
(a) Schematic of proposed device (upper) and membrane cross‐section (lower). (b) The device was turned on by immersion in a 45°C bath or laser irradiation at 570 or 300 mW/cm2. In all cases, the release rate was constant over at least 3 hr, and was much greater than release from the same devices in the off state (blue). (c) Blood glucose levels after repeated dosing at the same irradiance (gray box; 30 min duration; 570 mW/cm2) on four separate occasions over 14 days. Reproduced with permission from Ref. 123
Figure 7
Figure 7
(a) Schematic drawings of the diabetes patch, which is composed of the sweat‐control, sensing, and therapy components. (b) One‐day monitoring of glucose concentrations in the sweat and blood of a human. (c) Infrared camera images of multichannel heaters showing the stepwise drug release. (d) Optical images of the stepwise dissolution of the microneedles. (e) Blood glucose concentrations of mice for the treated group (with the drug) and control groups (without the patch and without the drug). Reproduced with permission from Ref. 127
Figure 8
Figure 8
Remote neural activation in vivo using radio waves. (a) Schema of activation system. (b) Change in blood glucose with RF treatment of GK–Cre mice with ventromedial hypothalamus injection of Ad‐FLEX‐anti‐GFP‐TRPV1mutant/GFP‐ferritin. Reproduced with permission from Ref. 130

References

    1. Atkinson MA, Eisenbarth GS. Type 1 diabetes: new perspectives on disease pathogenesis and treatment. Lancet. 2001;358:221–229. - PubMed
    1. Stumvoll M, Goldstein BJ, van Haeften TW. Type 2 diabetes: principles of pathogenesis and therapy. Lancet. 2005;365:1333–1346. - PubMed
    1. International Diabetes Federation. 4/20/2016. http://www.idf.org.
    1. American Diabetes Association . 4/20/2016. http://www.diabetes.org.
    1. Lieberman SM, DiLorenzo TP. A comprehensive guide to antibody and T‐cell responses in type 1 diabetes. Tissue Antigens. 2003;62:359–377. - PubMed