

Mechanical parameters of the molecular motor myosin II determined in permeabilised fibres from slow and fast skeletal muscles of the rabbit
- PMID: 29148051
- PMCID: PMC5878222
- DOI: 10.1113/JP275404
Mechanical parameters of the molecular motor myosin II determined in permeabilised fibres from slow and fast skeletal muscles of the rabbit
Abstract
Key points: The different performance of slow and fast muscles is mainly attributed to diversity of the myosin heavy chain (MHC) isoform expressed within them. In this study fast sarcomere-level mechanics has been applied to Ca2+ -activated single permeabilised fibres isolated from soleus (containing the slow myosin isoform) and psoas (containing the fast myosin isoform) muscles of rabbit for a comparative definition of the mechano-kinetics of force generation by slow and fast myosin isoforms in situ. The stiffness and the force of the slow myosin isoform are three times smaller than those of the fast isoform, suggesting that the stiffness of the myosin motor is a determinant of the isoform-dependent functional diversity between skeletal muscles. These results open the question of the mechanism that can reconcile the reduced performance of the slow MHC with the higher efficiency of the slow muscle.
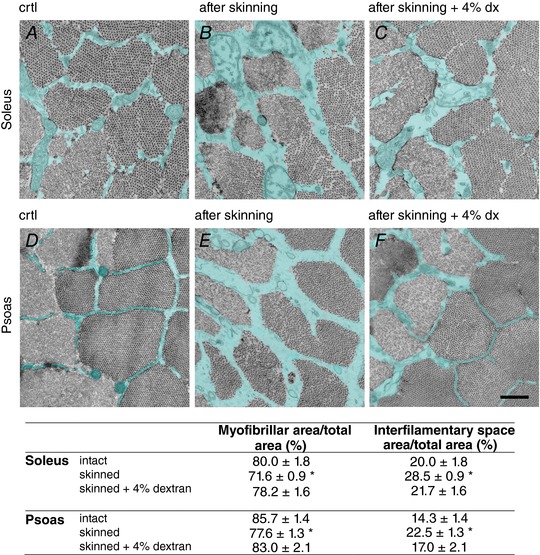
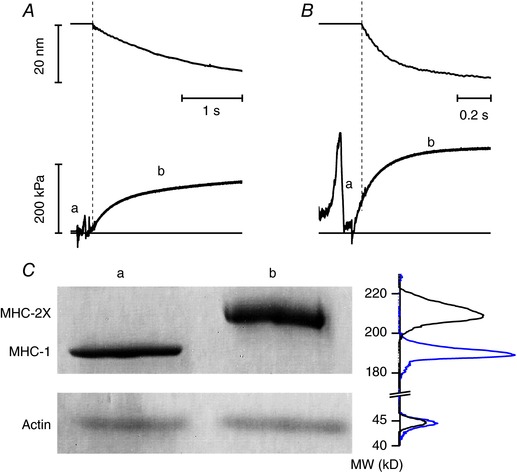
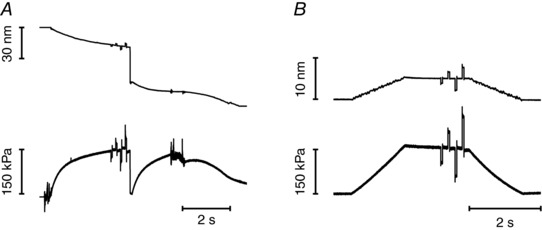
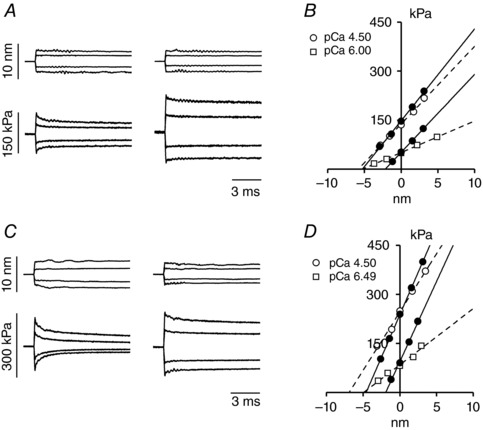
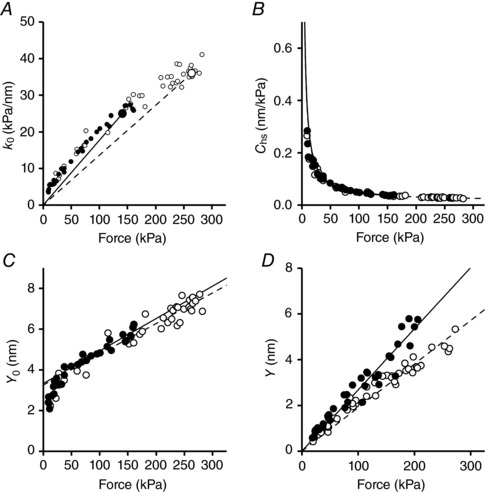
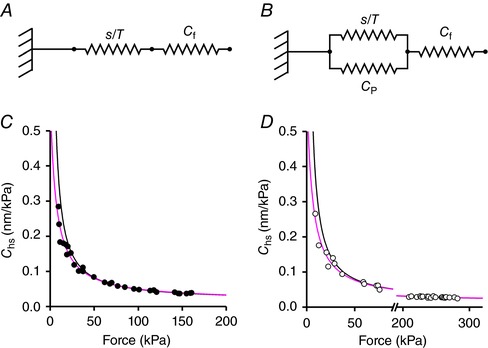
Abstract: The skeletal muscle exhibits large functional differences depending on the myosin heavy chain (MHC) isoform expressed in its molecular motor, myosin II. The differences in the mechanical features of force generation by myosin isoforms were investigated in situ by using fast sarcomere-level mechanical methods in permeabilised fibres (sarcomere length 2.4 μm, temperature 12°C, 4% dextran T-500) from slow (soleus, containing the MHC-1 isoform) and fast (psoas, containing the MHC-2X isoform) skeletal muscle of the rabbit. The stiffness of the half-sarcomere was determined at the plateau of Ca2+ -activated isometric contractions and in rigor and analysed with a model that accounted for the filament compliance to estimate the stiffness of the myosin motor (ε). ε was 0.56 ± 0.04 and 1.70 ± 0.37 pN nm-1 for the slow and fast isoform, respectively, while the average strain per attached motor (s0 ) was similar (∼3.3 nm) in both isoforms. Consequently the force per motor (F0 = εs0 ) was three times smaller in the slow isoform than in the fast isoform (1.89 ± 0.43 versus 5.35 ± 1.51 pN). The fraction of actin-attached motors responsible for maximum isometric force at saturating Ca2+ (T0,4.5 ) was 0.47 ± 0.09 in soleus fibres, 70% larger than that in psoas fibres (0.29 ± 0.08), so that F0 in slow fibres was decreased by only 53%. The lower stiffness and force of the slow myosin isoform open the question of the molecular basis of the higher efficiency of slow muscle with respect to fast muscle.
Keywords: fast myosin isoform; muscle mechanics; myosin motor force; myosin motor stiffness; slow myosin isoform.
© 2017 The Authors. The Journal of Physiology © 2017 The Physiological Society.
Figures
Comment in
-
Cross-bridges in slow skeletal muscle: not only slow but also soft.J Physiol. 2018 Apr 1;596(7):1121-1122. doi: 10.1113/JP275575. Epub 2018 Feb 25. J Physiol. 2018. PMID: 29427372 Free PMC article. No abstract available.
Similar articles
-
The mechanism of the force response to stretch in human skinned muscle fibres with different myosin isoforms.J Physiol. 2004 Jan 15;554(Pt 2):335-52. doi: 10.1113/jphysiol.2003.051748. Epub 2003 Oct 10. J Physiol. 2004. PMID: 14555725 Free PMC article.
-
The force and stiffness of myosin motors in the isometric twitch of a cardiac trabecula and the effect of the extracellular calcium concentration.J Physiol. 2018 Jul;596(13):2581-2596. doi: 10.1113/JP275579. Epub 2018 May 27. J Physiol. 2018. PMID: 29714038 Free PMC article.
-
Dependence of cross-bridge kinetics on myosin light chain isoforms in rabbit and rat skeletal muscle fibres.J Physiol. 2006 Feb 15;571(Pt 1):231-42. doi: 10.1113/jphysiol.2005.099770. Epub 2005 Dec 15. J Physiol. 2006. PMID: 16357018 Free PMC article.
-
Muscle mechanics: adaptations with exercise-training.Exerc Sport Sci Rev. 1996;24:427-73. Exerc Sport Sci Rev. 1996. PMID: 8744258 Review.
-
Smooth, slow and smart muscle motors.J Muscle Res Cell Motil. 2003;24(2-3):165-73. doi: 10.1023/a:1026001513928. J Muscle Res Cell Motil. 2003. PMID: 14609028 Review.
Cited by
-
The molecular athlete: exercise physiology from mechanisms to medals.Physiol Rev. 2023 Jul 1;103(3):1693-1787. doi: 10.1152/physrev.00017.2022. Epub 2023 Jan 5. Physiol Rev. 2023. PMID: 36603158 Free PMC article. Review.
-
Orthophosphate increases the efficiency of slow muscle-myosin isoform in the presence of omecamtiv mecarbil.Nat Commun. 2020 Jul 7;11(1):3405. doi: 10.1038/s41467-020-17143-2. Nat Commun. 2020. PMID: 32636378 Free PMC article.
-
Thick filament activation is different in fast- and slow-twitch skeletal muscle.J Physiol. 2022 Dec;600(24):5247-5266. doi: 10.1113/JP283574. Epub 2022 Nov 23. J Physiol. 2022. PMID: 36342015 Free PMC article.
-
A Myosin II-Based Nanomachine Devised for the Study of Ca2+-Dependent Mechanisms of Muscle Regulation.Int J Mol Sci. 2020 Oct 6;21(19):7372. doi: 10.3390/ijms21197372. Int J Mol Sci. 2020. PMID: 33036217 Free PMC article.
-
Single-molecule analysis reveals that regulatory light chains fine-tune skeletal myosin II function.J Biol Chem. 2020 May 15;295(20):7046-7059. doi: 10.1074/jbc.RA120.012774. Epub 2020 Apr 9. J Biol Chem. 2020. PMID: 32273340 Free PMC article.
References
-
- Aigner S, Gohlsch B, Hamalainen N, Staron RS, Uber A, Wehrle U & Pette D (1993). Fast myosin heavy chain diversity in skeletal muscles of the rabbit: heavy chain IId, not IIb predominates. Eur J Biochem 211, 367–372. - PubMed
Publication types
MeSH terms
Substances
LinkOut - more resources
Full Text Sources
Other Literature Sources
Research Materials
Miscellaneous