. 2018 Mar;31(3):406-417.
doi: 10.1038/modpathol.2017.143. Epub 2017 Nov 17.

Single-cell heterogeneity in ductal carcinoma in situ of breast

Affiliations

Single-cell heterogeneity in ductal carcinoma in situ of breast

Michael J Gerdes et al. Mod Pathol. 2018 Mar.

Abstract

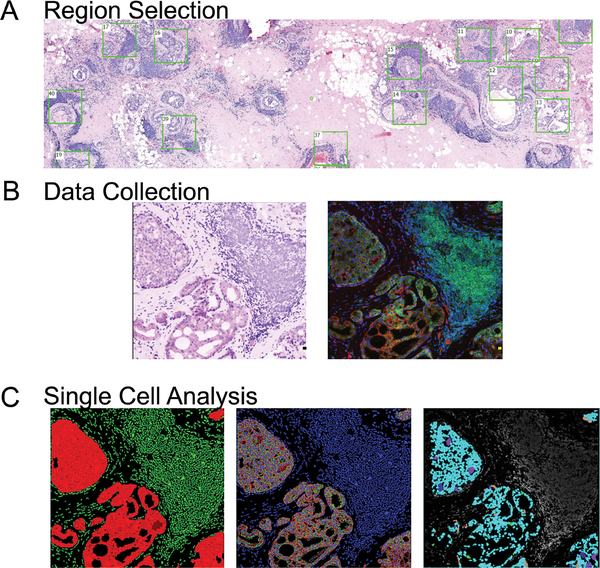
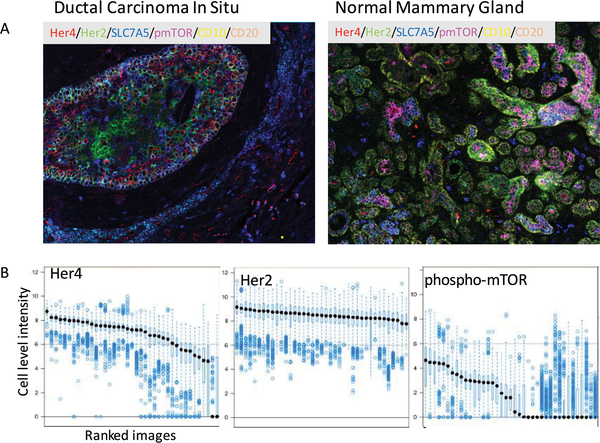
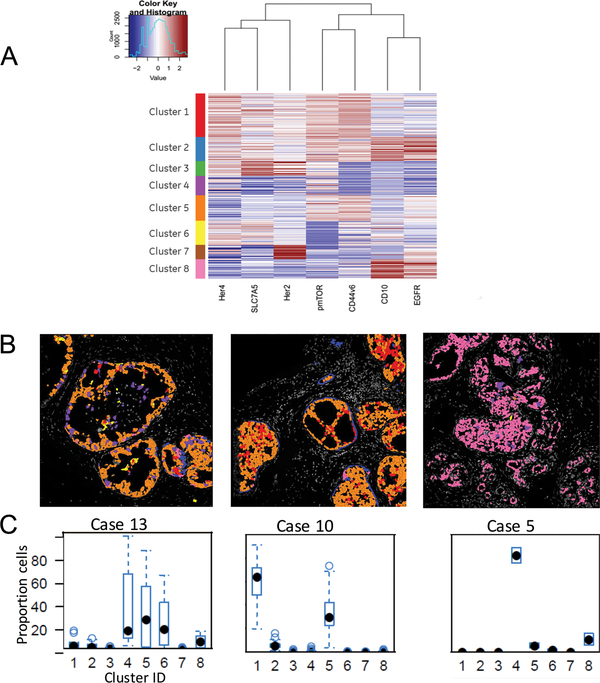
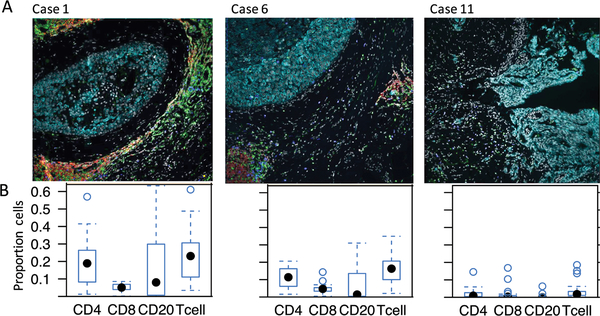
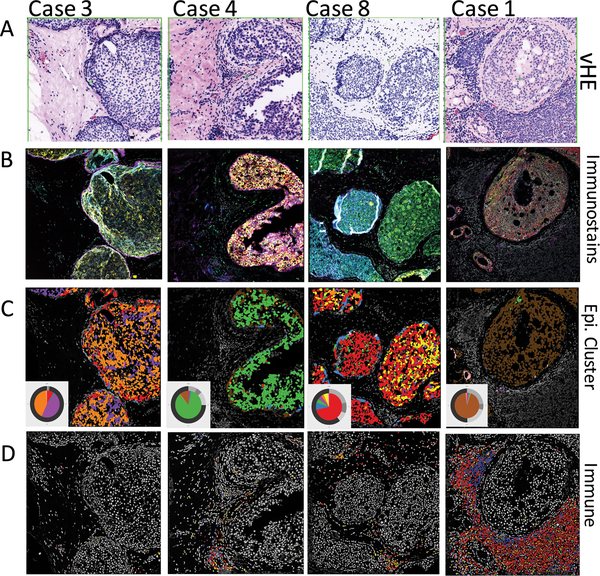
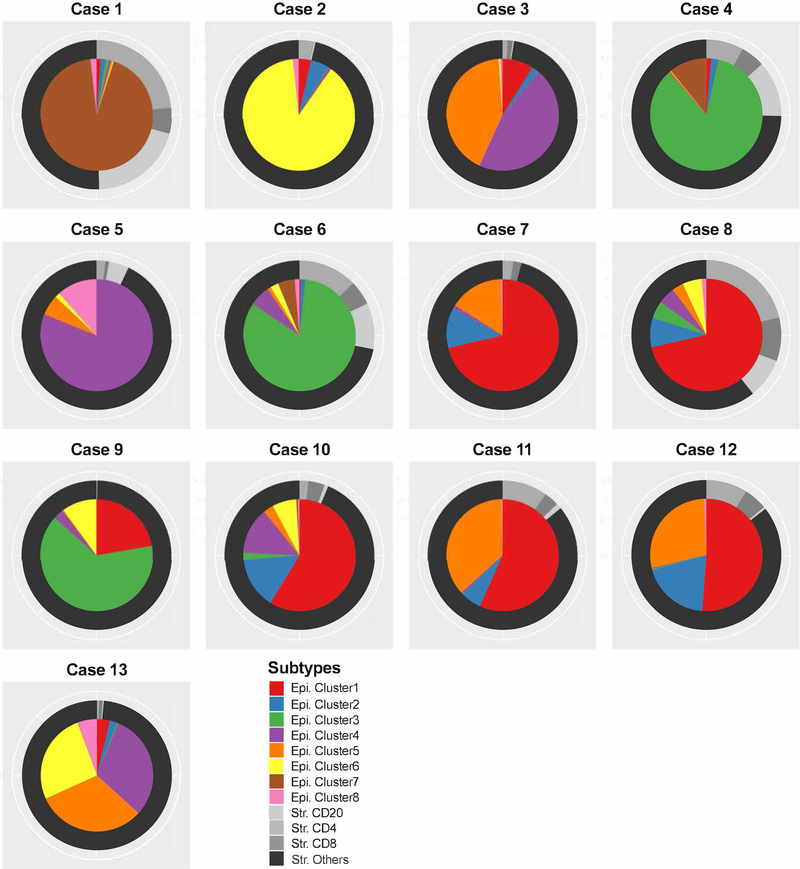
Heterogeneous patterns of mutations and RNA expression have been well documented in invasive cancers. However, technological challenges have limited the ability to study heterogeneity of protein expression. This is particularly true for pre-invasive lesions such as ductal carcinoma in situ of the breast. Cell-level heterogeneity in ductal carcinoma in situ was analyzed in a single 5 μm tissue section using a multiplexed immunofluorescence analysis of 11 disease-related markers (EGFR, HER2, HER4, S6, pmTOR, CD44v6, SLC7A5 and CD10, CD4, CD8 and CD20, plus pan-cytokeratin, pan-cadherin, DAPI, and Na+K+ATPase for cell segmentation). Expression was quantified at cell level using a single-cell segmentation algorithm. K-means clustering was used to determine co-expression patterns of epithelial cell markers and immune markers. We document for the first time the presence of epithelial cell heterogeneity within ducts, between ducts and between patients with ductal carcinoma in situ. There was moderate heterogeneity in a distribution of eight clusters within each duct (average Shannon index 0.76; range 0-1.61). Furthermore, within each patient, the average Shannon index across all ducts ranged from 0.33 to 1.02 (s.d. 0.09-0.38). As the distribution of clusters within ducts was uneven, the analysis of eight ducts might be sufficient to represent all the clusters ie within- and between-duct heterogeneity. The pattern of epithelial cell clustering was associated with the presence and type of immune infiltrates, indicating a complex interaction between the epithelial tumor and immune system for each patient. This analysis also provides the first evidence that simultaneous analysis of both the epithelial and immune/stromal components might be necessary to understand the complex milieu in ductal carcinoma in situ lesions.


Figures

Figure 1:
Figure 1:. Data collection and analysis workflow.
1A. Tissue sections are scanned for auto-fluorescence and DAPI, and an H&E like image is generated allowing for specific regions to be analyzed by multiplex IF. 1B. Enlarged region from H&E scan and a companion composite image of multiplex staining for epithelial/ tumor cells (anti-pan cytokeratins AE1 and pck26), CD3 T-Cells, and CD20 B-cells are shown. 1C. Output images from single cell analysis workflow showing (left) separation of tumor (red) and stroma (green), (middle) single cell segmentation (blue-nuclei, red-epithelial membranes, green- epithelial cytoplasm), and (right) mapping of cell expression patterns based on K-means clustering back on original images.
Figure 2:
Figure 2:. Evaluation of heterogeneity in antibody staining for individual markers.
2A. Representative composite images of staining from a typical ductal carcinoma in situ lesion (left), and a region of normal ducts from the same patient sample. 2B: Boxplot of HER4, HER2 and pmTOR intensity for all the cells of one example patient. X-axis is the ducts of the lesion. Y-axis is the log2(protein intensity). Within each duct, each point is a cell, the black dot is the median cell intensity and the boxplot around the black dot is the 25th and 75th quantiles. This figure shows the cell to cell and duct to duct variabilities for HER2, HER4 and pmTOR.
Figure 3:
Figure 3:. Determining complex patterns of protein expression in ductal carcinoma in situ.
3A. K-means clustering was applied to single cell data to determine patterns of expression for 7 markers. Each cluster group represents a pattern of unique cellular expression. Scale set with blue representing low/negative expression and red is highest expression. 3B. Cluster IDs mapped back onto images to confirm accuracy of segmentation demonstrates variable levels of heterogeneity. Shown are 3 representative cases with high, intermediate and low heterogeneity. Colors of cells correspond to color code given to cluster groups in figure 3A. 3C. Boxplot of cellular heterogeneity of patients. X-axis is the 8 cell level clusters. Y-axis is the percentage of cells within each cluster. Each point is a duct. Most of the ducts for case 5 has more than 80% cells in cluster 4. Case 10 has majorly cluster 1 and 5. However, case 13 has 3 main clusters and the percent of cells within each duct can vary from 0–100% for cluster 4, 0–90% for cluster 5 and 0–60% for cluster 6.
Figure 4:
Figure 4:. Immune quantification in ductal carcinoma in situ samples.
4A. Representative images from 3 cases of ductal carcinoma in situ with differing levels of local immune response. Tumor cells (turquoise), CD20 (red), CD4 (green) and CD8 (blue). 4B. Boxplot of immune marker enrichment of patients. X-axis is the 4 main immune types: CD4, CD8, CD20 and total T cells (CD4+CD8). Y-axis is the proportion of positive immune cells. Each point is a duct. Most of the ducts for case 11 have very few immune cells. Case 6 has moderate level of immune cells. However, case 1 has relatively higher immune proportions for both T cells and B cells.
Figure 5:
Figure 5:. Mapping of epithelial and immune components in ductal carcinoma in situ.
5A. Representative pseudo-H&E images showing 4 cases of ductal carcinoma in situ with local immune responses. 5B. Composite immunofluorescence images for fields shown in A. Markers include HER4, SLC7A5, HER2, pmTOR, CD44v6, CD10 and EGFR. 5C. Cluster IDs mapped back to images allow clear visualization of cells with different patterns of expression. Colors correspond to cluster IDs in Figure 3, and pie charts shown in inset are for the specific field of view - the inner pie shows relative abundance of the 8 epithelial groups, and the outer ring show proportions of different immune populations. 5D. Verification of immune patterns after semi-automated quantification. CD20 positive cells in red, CD4 in green, and CD8 in blue.
Figure 6:
Figure 6:. Summary of epithelial and associated immune patterns in ductal carcinoma in situ.
Pie charts for cluster distribution and immune profile for each patient. The inner pie is composed of the 8 epithelial cell clusters. The outer ring is composed of the immune cell types as a proportion of the stromal space.

References

    1. Gerlinger M, Rowan AJ, Horswell S, Larkin J, Endesfelder D, Gronroos E, et al. Intratumor heterogeneity and branched evolution revealed by multiregion sequencing. N Engl J Med. 2012:883–92. - PMC - PubMed
    1. Cancer Govindan R.. Attack of the clones. Science. 2014:169–70. - PubMed
    1. de Bruin EC, McGranahan N, Mitter R, Salm M, Wedge DC, Yates L, et al. Spatial and temporal diversity in genomic instability processes defines lung cancer evolution. Science. 2014:251–6. - PMC - PubMed
    1. Zhang J, Fujimoto J, Zhang J, Wedge DC, Song X, Zhang J, et al. Intratumor heterogeneity in localized lung adenocarcinomas delineated by multiregion sequencing. Science. 2014:256–9. - PMC - PubMed
    1. Navin NE. Cancer genomics: one cell at a time. Genome Biol. 2014:452. - PMC - PubMed

Publication types

MeSH terms