

Hyperventilation and breath-holding test with indocyanine green kinetics predicts cerebral hyperperfusion after carotid artery stenting
- PMID: 29148891
- PMCID: PMC6501514
- DOI: 10.1177/0271678X17743878
Hyperventilation and breath-holding test with indocyanine green kinetics predicts cerebral hyperperfusion after carotid artery stenting
Abstract
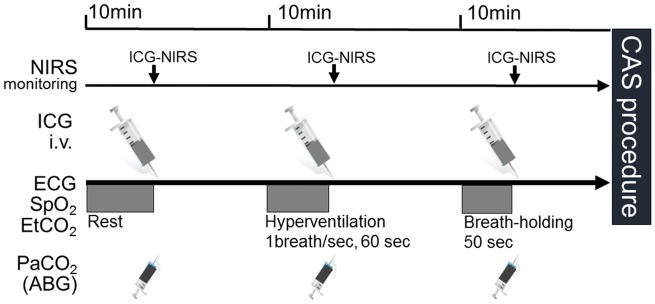
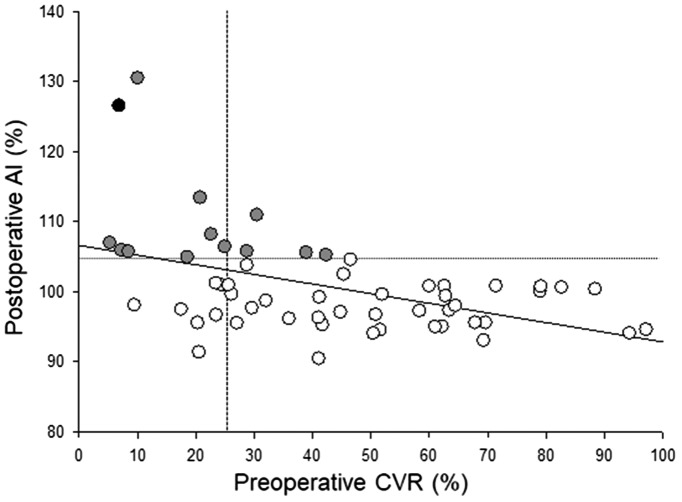
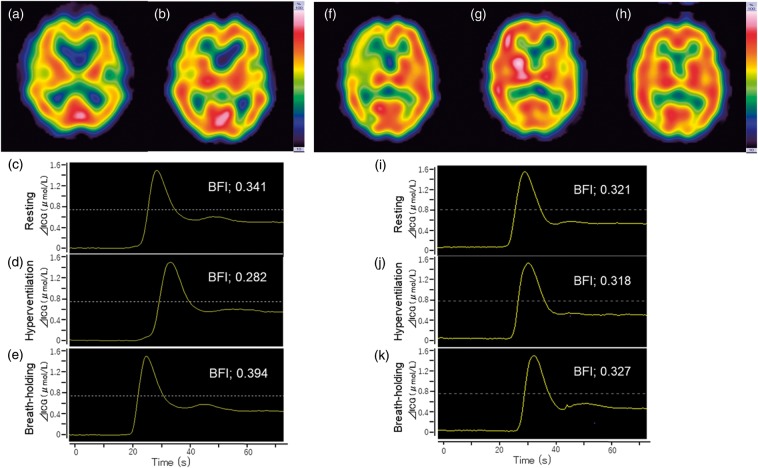
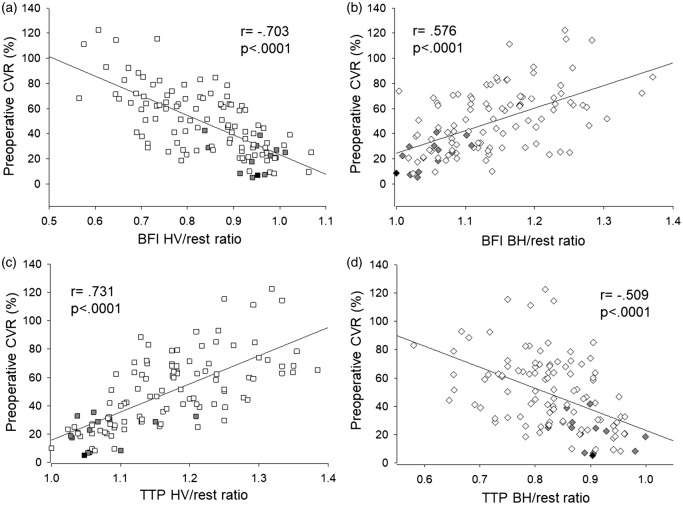
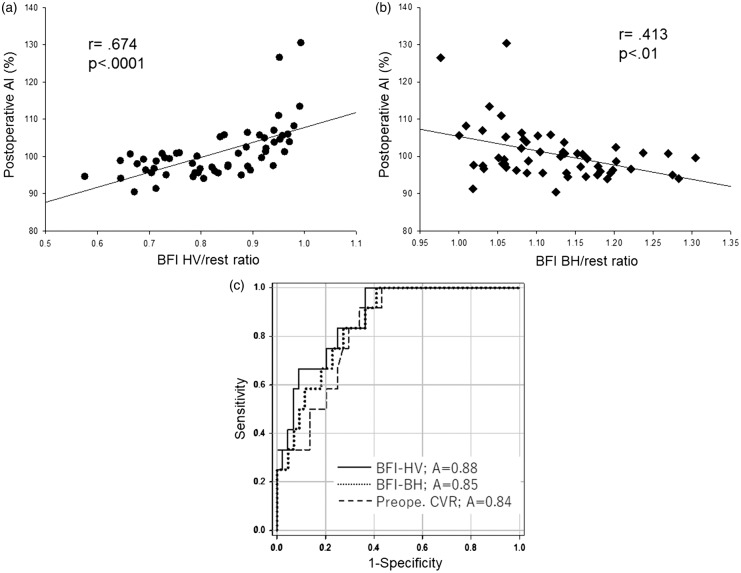
Cerebral hyperperfusion syndrome (CHS) is a serious complication following carotid artery stenting (CAS), but definitive early prediction of CHS has not been established. Here, we evaluated whether indocyanine green kinetics and near-infrared spectroscopy (ICG-NIRS) with hyperventilation (HV) and the breath-holding (BH) test can predict hyperperfusion phenomenon after CAS. The blood flow index (BFI) ratio during HV and BH was prospectively monitored using ICG-NIRS in 66 patients scheduled to undergo CAS. Preoperative cerebrovascular reactivity (CVR) and the postoperative asymmetry index (AI) were also assessed with single-photon emission computed tomography before and after CAS and the correlation with the BFI HV/rest ratio, BFI BH/rest ratio was evaluated. Twelve cases (18%) showed hyperperfusion phenomenon, and one (1.5%) showed CHS after CAS. A significant linear correlation was observed between the BFI HV/rest ratio, BFI BH/rest ratio, and preoperative CVR. A significant linear correlation was observed between the BFI HV/rest ratio and postoperative AI (r = 0.674, P < 0.0001). A BFI HV/rest ratio of 0.88 or more was the optimal cut-off point to predict hyperperfusion phenomenon according to receiver operating characteristic curve analyses. HV and BH test under ICG-NIRS is a useful tool for detection of hyperperfusion phenomenon in patients who underwent CAS.
Keywords: Carotid artery stenting; hyperperfusion syndrome; hyperventilation test; indocyanine green; near-infrared spectroscopy.
Figures
Similar articles
-
Indocyanine green kinetics with near-infrared spectroscopy predicts cerebral hyperperfusion syndrome after carotid artery stenting.PLoS One. 2017 Jul 12;12(7):e0180684. doi: 10.1371/journal.pone.0180684. eCollection 2017. PLoS One. 2017. PMID: 28704454 Free PMC article.
-
Hypocapnia Induced by Hyperventilation with Indocyanine Green Kinetics Detects the Effect of Staged Carotid Angioplasty to Avoid Hyperperfusion in Patients with Impaired Cerebral Hemodynamic Reserve.Transl Stroke Res. 2022 Feb;13(1):77-87. doi: 10.1007/s12975-021-00911-7. Epub 2021 May 6. Transl Stroke Res. 2022. PMID: 33959854
-
Objective evaluation of cerebrovascular reactivity for acetazolamide predicts cerebral hyperperfusion after carotid artery stenting: Comparison with region of interest methods.J Neuroradiol. 2018 Oct;45(6):362-367. doi: 10.1016/j.neurad.2018.02.008. Epub 2018 Mar 7. J Neuroradiol. 2018. PMID: 29524498
-
Editor's Choice - Cerebral Hyperperfusion Syndrome After Carotid Artery Stenting: A Systematic Review and Meta-analysis.Eur J Vasc Endovasc Surg. 2018 Sep;56(3):322-333. doi: 10.1016/j.ejvs.2018.05.012. Epub 2018 Jun 29. Eur J Vasc Endovasc Surg. 2018. PMID: 30196814
-
[Cerebral hyperperfusion syndrome in carotid revascularisation surgery].Rev Neurol. 2012 Oct 16;55(8):490-8. Rev Neurol. 2012. PMID: 23055431 Review. Spanish.
Cited by
-
Investigation of the hyperperfusion phenomenon following carotid artery stenting using preoperative computed tomography perfusion imaging.Acta Neurochir (Wien). 2025 May 26;167(1):155. doi: 10.1007/s00701-025-06545-0. Acta Neurochir (Wien). 2025. PMID: 40418407 Free PMC article.
-
Optical imaging and spectroscopy for the study of the human brain: status report.Neurophotonics. 2022 Aug;9(Suppl 2):S24001. doi: 10.1117/1.NPh.9.S2.S24001. Epub 2022 Aug 30. Neurophotonics. 2022. PMID: 36052058 Free PMC article.
-
Quantification of the Tissue Oxygenation Delay Induced by Breath-Holding in Patients with Carotid Atherosclerosis.Metabolites. 2022 Nov 21;12(11):1156. doi: 10.3390/metabo12111156. Metabolites. 2022. PMID: 36422296 Free PMC article.
References
-
- Hosoda K, Kawaguchi T, Ishii K, et al. Prediction of hyperperfusion after carotid endarterectomy by brain SPECT analysis with semiquantitative statistical mapping method. Stroke 2003; 34: 1187–1193. - PubMed
-
- Chiu FY, Kao YH, Teng MM, et al. Validation and absolute quantification of MR perfusion compared with CT perfusion in patients with unilateral cerebral arterial stenosis. Eur J Radiol 2012; 81: 4087–4093. - PubMed
-
- Al-Rawi PG, Kirkpatrick PJ. Tissue oxygen index: Thresholds for cerebral ischemia using near-infrared spectroscopy. Stroke 2006; 37: 2720–2725. - PubMed
MeSH terms
Substances
LinkOut - more resources
Full Text Sources
Other Literature Sources
