. 2017 Nov 17:6:e30918.
doi: 10.7554/eLife.30918.

The somatically generated portion of T cell receptor CDR3α contributes to the MHC allele specificity of the T cell receptor

Affiliations

The somatically generated portion of T cell receptor CDR3α contributes to the MHC allele specificity of the T cell receptor

Philippa Marrack et al. Elife. .

Abstract

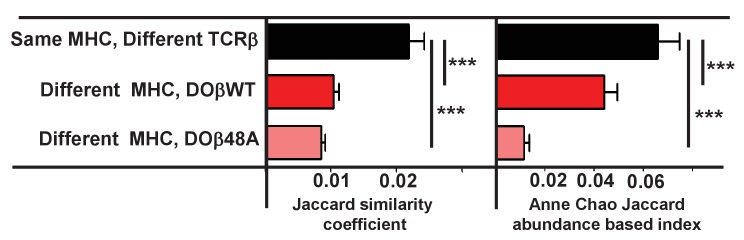
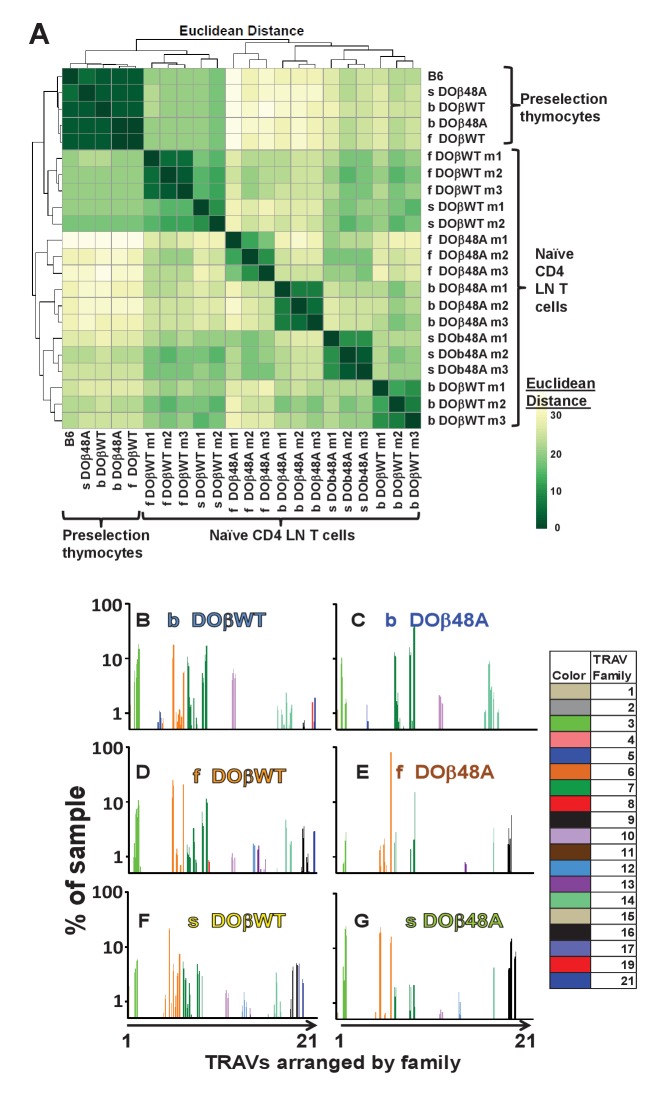
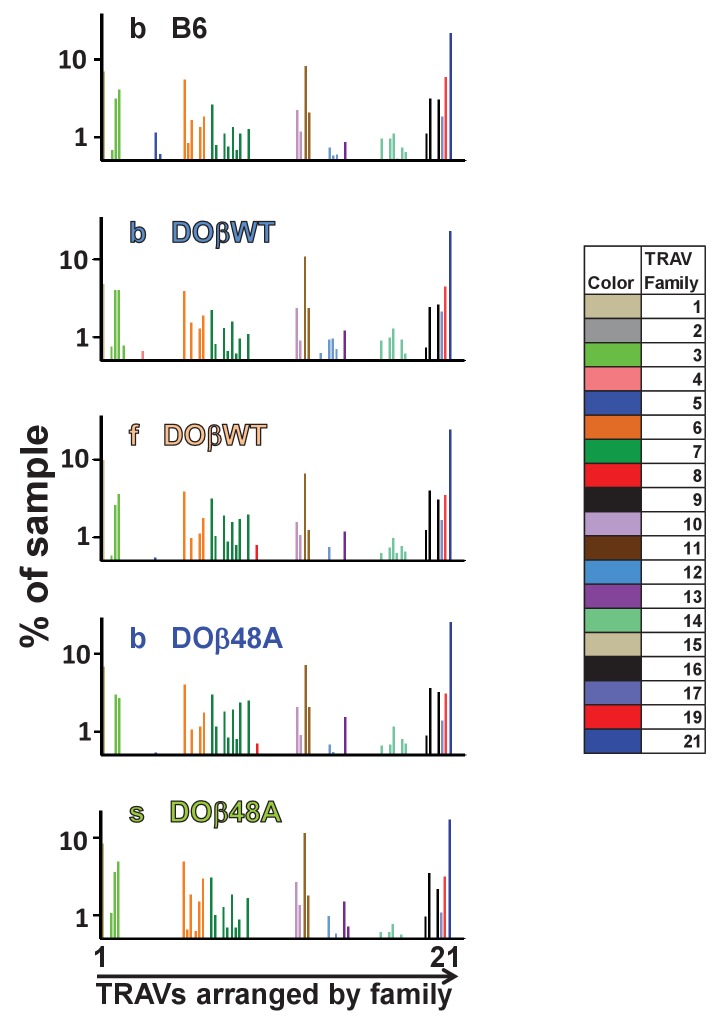
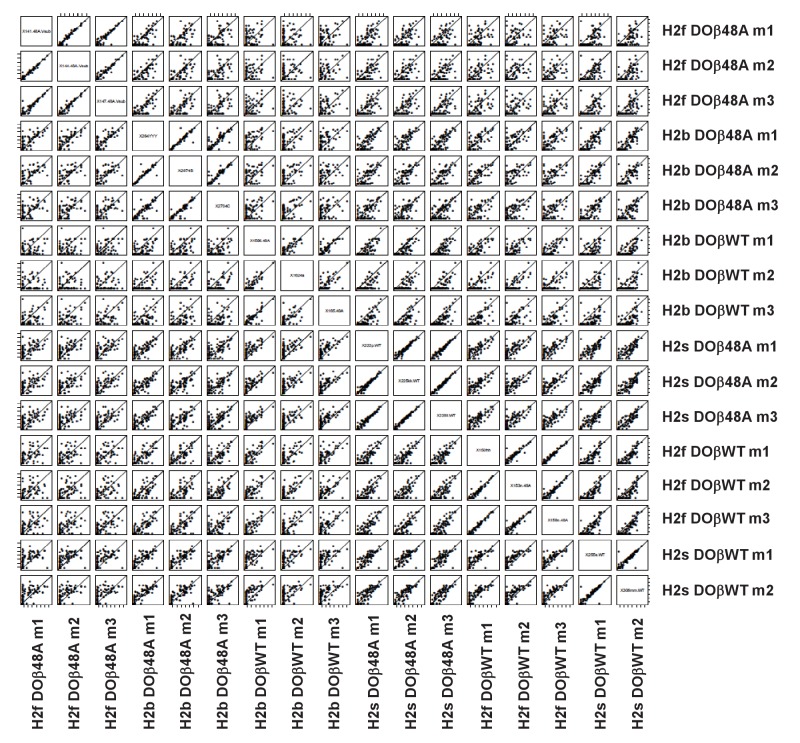
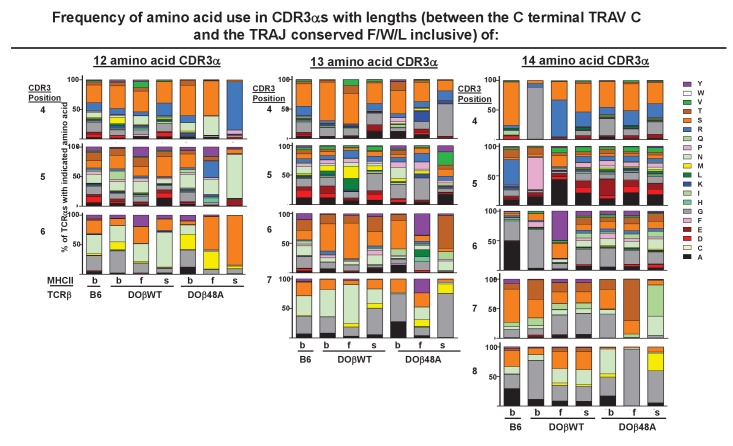
Mature T cells bearing αβ T cell receptors react with foreign antigens bound to alleles of major histocompatibility complex proteins (MHC) that they were exposed to during their development in the thymus, a phenomenon known as positive selection. The structural basis for positive selection has long been debated. Here, using mice expressing one of two different T cell receptor β chains and various MHC alleles, we show that positive selection-induced MHC bias of T cell receptors is affected both by the germline encoded elements of the T cell receptor α and β chain and, surprisingly, dramatically affected by the non germ line encoded portions of CDR3 of the T cell receptor α chain. Thus, in addition to determining specificity for antigen, the non germline encoded elements of T cell receptors may help the proteins cope with the extremely polymorphic nature of major histocompatibility complex products within the species.

Keywords: CDR3 alpha; T cell receptor; immunology; major histocompatibility complex; mouse; selection; thymus.


Conflict of interest statement

No competing interests declared.

Figures

Figure 1.
Figure 1.. CD4 selection in mice expressing single TCRβ chains and different MHC alleles.
Cells were isolated from the thymuses and lymph nodes of mice expressing a singl;e TCRβ, DOβWT or DOβ48A, and different MHC haplotypes and stained for expression of CD4 and CD8 and CD44. Results are the means and standard errors of the mean (SEMs) of three independently analyzed mice expressing the indicated TCRβs and MHC II alleles. Student t analyses were used to compare results between the DOβWT and DOβ48A paired samples. *p<0.05., **p<0.01, ***p<0.001.
Figure 2.
Figure 2.. TCRα contributes to the MHCII allele bias of selected naïve CD4 T cells.
Naïve CD4 T cells were isolated from the lymph nodes of DOβ48A H2b, f or s mice and incubated for 2 days in wells coated with anti-TCRβ and anti-CD28. Thus activated, the cells were spinfected with GFP-expressing retroviruses expressing also DOβWT or DOβ48A. The cells were cultured for a further 2 days and then challenged with spleen cells from mice expressing the indicated MHC alleles, or in the absence of added spleen cells. One day later the cells were stained for expression of CD69. Results were calculated as the (% of GFP+ T cells transduced with DOβWT-expressing retroviruses that were CD69+) – (the % of GFP+ T cells transfected with DOβ48A-expressing retroviruses that were CD69+) in wells containing the same challenge spleen cells. Shown are the average results ± standard error of the mean (SEM) from three independent experiments. *p<0.05, **p<0.01 by one way ANOVA followed by Neuman Keuls analyses.
Figure 3.
Figure 3.. Expression of a single TCRβ chain, DOβWT and, even more markedly, DOβ48A, reduces the number of different TCRα chains that can be positively selected, regardless of the selecting MHCII allele.
Naïve CD4 T cells were isolated from the spleens (B6) or lymph nodes of mice expressing MHC b, f or s, single TCRβ chains and heterozygous for expression of functional TCRα chains. Their expressed TCRα chains were sequenced and analyzed with species accumulation curves. Results were combined from three independently sequenced data sets from mice of each genotype except for those for H2s DOβWT animals, which were combined from only two independently sequenced animals. Data are shown together with an estimate (bracketed) of the total numbers of different TCRα protein sequences present in the naïve CD4 T cells of each type of mouse.
Figure 3—figure supplement 1.
Figure 3—figure supplement 1.. The naïve CD4 T cells in mice expressing a single TCRa chain express a limited number of TCRα sequences regardless of the MHC allele involved in their selection in the thymus.
Results were calculated as described in Figure 3. Data shown are for individual mice.
Figure 4.
Figure 4.. TCRβ sequences on naïve CD4 T cells are determined by the selecting MHCII allele and the co-selected TCRβ.
TCRαs on naïve CD4 T cells from the lymph nodes of TCRα+/- mice expressing a single TCRα and various MHC alleles were sequenced and analyzed as described in Figure 3. Results are the means and SEMs of three independently sequenced animals of each genotype except for H2s DOβWT animals, of which only two mice were analyzed. ***p<0.001 by one way ANOVA with Newman-Keuls post analysis.
Figure 4—figure supplement 1.
Figure 4—figure supplement 1.. TCRα sequences are somewhat more likely to be shared between T cells selected on the same MHCII allele but differing in TCRβ than between T cells sharing TCRβ but selected on different MHCII alleles.
TCRα sequences were obtained and analyzed as described in Figure 4. Data shown are combined as indicated between all the mice illustrated in Figure 4. Results are the means and SEMs of the data. ***p<0.001 by one way ANOVA with Newman Keuls post analysis.
Figure 5.
Figure 5.. The frequency with which TRAVs are used on naïve CD4 T cells in TCRβ transgenic mice depends on their selecting MHCII and their partner TCRβ.
TCRαs on preselection thymocytes or naïve T cells from the lymph nodes of TCRα+/- mice expressing a single TCRβ and various MHC alleles were sequenced and analyzed as described in Figure 3. (A) Shown are the Euclidean distances for TRAV use between the data for individual mice. Samples are hierachically ordered. Individual mice of the same genotype are numbered m1-3. (B) The average % use of each TRAV in mice expressing the indicated MHCII allele and TCRβ. Results are the means ± SEMs of 3 identical mice, except for H2s DOβWT animals, for which results are the averages of 2 mice. TRAVs are ordered by family, not by position on the chromosome.
Figure 5—figure supplement 1.
Figure 5—figure supplement 1.. Different TRAVs are detected at different frequencies in preselection thymocytes.
Preselection DP thymocytes were obtained from individual mice expressing the indicated MHCII alleles and TCRβs. Shown are the %s with which individual TRAVs were detected. Subfamily members of each family are color coded as shown. Note, the TRAVs are ordered by family and not by their position in the TCRα locus.
Figure 5—figure supplement 2.
Figure 5—figure supplement 2.. TRAV usage by naive CD4 T cells depends on the selecting MHCII allele and partner TCRβ.
Pairwise scatter plots of individual TRAV frequencies between all replicates of mature naïve CD4 T cells from mice expressing different MHCII alleles and different TCRβ chains. Data are plotted as log2 transformed TRAV counts per 1 × 10^4 total TCRα sequences in each mouse noted on the x axis versus each mouse noted on the y axis. Values distributed along the diagonal are equivalent between the two mice compared in the plot. Individual mice of each genotype were numbered m1-m3, numbers for each mouse are used consistently throughout.
Figure 5—figure supplement 3.
Figure 5—figure supplement 3.. TRAVs are used to different extents by naïve CD4 T cells in mice expressing different MHCII alleles and/or different TCRβs.
Data were obtained and analyzed as described in Figures 3 and 5. DESeq2 was used to compare the frequencies with which different TRAVs were used by naïve CD4 T cells in mice expressing different MHCII alleles and/or different TCRβs. Differential expression analyses were performed using the DESeq2 package (v1.8.1) in the R language (v3.2.2). DESeq2 fit negative binomial regression models to each feature to compare between groups. Corrections for size factors for each sample (animal) to account for differences in repertoire size were applied. The negative binomial dispersion parameter for each feature was then calculated, sharing information across features with similar expression levels to moderate extreme empirical dispersion estimates. Wald tests were applied to each feature to test for differential expression between groups. Features were considered differentially expressed if they had a Benjamini-Hochberg adjusted p-value (i.e., false discovery rate)<0.05.
Figure 6.
Figure 6.. Naïve CD4 T cells in DOβWT or DOβ48A mice preferentially use TRAJs from the distal end of the TRAJ locus.
TCRαs on preselection thymocytes or naïve CD4 T cells from the lymph nodes of TCRα±mice expressing a single TCRβ and various MHC alleles were sequenced and analyzed as described in Figure 3. (A) Shown are the Euclidean distances for TRAJ use between the data for individual mice. Samples are hierachically ordered. Individual mice of the same genotype are numbered m1-3. (B-L) The % use of each TRAJ in mice expressing the indicated MHCII allele and TCRβ. Results are the means and SEMs of 3 identical mice, except for H2s DOβWT animals, for which results are the averages of 2 identical mice. TRAJs are ordered by position on the chromosome. Also shown are the means and SEMs of TRAJ use by five independently sequenced preselection thymocytes and three independently sequenced naïve CD4 T spleen T cells from B6 mice.
Figure 6—figure supplement 1.
Figure 6—figure supplement 1.. TRAJ usage by naive CD4 T cells depends on the selecting MHCII allele and partner TCRβ.
Pairwise scatter plots of individual TRAJ frequencies between all replicates of mature naïve CD4 T cells from mice expressing different MHCII alleles. Each point is a TRAJ. Data are plotted as log2 transformed TRAV counts per 1 × 10^4 total TCRαsequences in each mouse noted on the x axis versus each mouse noted on the y axis. Values distributed along the diagonal are equivalent between the two mice compared in the plot. Individual mice of each genotype were numbered m1-m3, numbers for each mouse are used consistently throughout.
Figure 6—figure supplement 2.
Figure 6—figure supplement 2.. TRAJs are used to different extents by naïve CD4 T cells in mice expressing different MHCII alleles and/or different TCRβs.
Data were obtained and analyzed as described in Figures 3 and 5. DESeq 2 was used as described in Figure 5—figure supplement 3 to compare the frequencies with which different TRAJs were used by naïve CD4 T cells in mice expressing different MHCII alleles and/or different TCRbs.
Figure 7.
Figure 7.. CDR3α sequences on naïve CD4 T cells are determined by the selecting MHCII allele and the co-selected TCRβ.
TCRαs on naïve T cells from mice expressing a single TCRβ and various MHCII alleles were sequenced and analyzed for their CDR3α sequences as described in Figures 3 and 4. CDR3α sequences were defined as the amino acids between and including the conserved cysteine at the C terminal end of the TRAV and the conserved phenyl alanine, tryptophan or leucine in the TRAJ region. Shown are the means and SEMs of 3 independently sequenced identical mice except for H2s DOβWT mice, in which case only two mice were analyzed. ***p<0.001, **p<0.01 by one way ANOVA with Newman-Keuls post analysis.
Figure 7—figure supplement 1.
Figure 7—figure supplement 1.. CDR3α length on naïve CD4 T cells depends upon the selecting MHC allele and the co-selected TCRβ.
Data were obtained as described in Figures 3 and 4. Shown are the average lengths of CDR3α and N region bases on naïve CD4 T cells coexpressed with the indicated TCRβ. Results are the means and SEMs of 3 mice of the same haplotype except for s DOβWT mice, in which case the results from two mice were averaged. Errors are calculated with one way ANOVA with the Bonferroni post test comparing all pairs. *p<0.05, **p<0.01, ***p<0.001. Statistical results are omitted for pairs which were not significantly different from each other.
Figure 8.
Figure 8.. N region amino acids in CDR3α of naïve CD4 T cells are determined by the selecting MHCII allele and the co-selected TCRβ.
TCRαs on naïve CD4 T cells of mice expressing a single TCRβ and various MHCII alleles were sequenced as described in Figures 3 and 4. Mice were as listed in those Figures. Comparisons were made of N regions derived from the same TRAV TRAJ pair providing that all mice in the comparisons expressed at least five different sequences involving the chosen TRAV TRAJ pair. Results shown are the means ± SEMs of the data from identical mice. Statistical analyses involved one way ANOVA tests with Newman-Keuls post test analyses (A, B) or Student t tests (C–F). *p<0.05, **p<0.01, ***p<0.001.
Figure 8—figure supplement 1.
Figure 8—figure supplement 1.. N region amino acids in CDR3α of naïve CD4 T cells are determined by the selecting MHCII allele and the co-selected TCRβ.
TCRαs on naïve CD4 T cells of mice expressing a single TCRβ and various MHCII alleles were sequenced as described in Figures 3 and 4. Mice were as listed in those Figures. The results of samples expressing the same TRAV TRAJ pairs for all comparisons in which each mouse expressed at least five different sequences involving the chosen TRAV/TRAJ pair were averaged. Results shown are the means ± SEMs of the data from mice of identical genotypes. Statistical analyses for comparisons involving three different types of mice used one way ANOVA tests with Newman-Keuls post test analyses. Student t tests were used to analyze statistically the differences between pairs of mice. **p<0.01, ***p<0.001.
Figure 8—figure supplement 2.
Figure 8—figure supplement 2.. The frequency of amino acid use in CDR3α use on naïve CD4 T cells depends on the selecting MHCII allele, the coselected TCRβ and the length of the CDR3α.
Data from TCRα sequences obtained as in Figure 4 were used to analyze the frequency with which different amino acids were used at different positions.

Similar articles

Cited by

References

    1. Adams JJ, Narayanan S, Birnbaum ME, Sidhu SS, Blevins SJ, Gee MH, Sibener LV, Baker BM, Kranz DM, Garcia KC. Structural interplay between germline interactions and adaptive recognition determines the bandwidth of TCR-peptide-MHC cross-reactivity. Nature Immunology. 2016;17:87–94. doi: 10.1038/ni.3310. - DOI - PMC - PubMed
    1. Allison JP, McIntyre BW, Bloch D. Tumor-specific antigen of murine T-lymphoma defined with monoclonal antibody. Journal of Immunology. 1982;129:2293–2300. - PubMed
    1. Archbold JK, Ely LK, Kjer-Nielsen L, Burrows SR, Rossjohn J, McCluskey J, Macdonald WA. T cell allorecognition and MHC restriction--A case of Jekyll and Hyde? Molecular Immunology. 2008;45:583–598. doi: 10.1016/j.molimm.2006.05.018. - DOI - PubMed
    1. Arstila TP, Casrouge A, Baron V, Even J, Kanellopoulos J, Kourilsky P. A direct estimate of the human alphabeta T cell receptor diversity. Science. 1999;286:958–961. doi: 10.1126/science.286.5441.958. - DOI - PubMed
    1. Ashton-Rickardt PG, Bandeira A, Delaney JR, Van Kaer L, Pircher HP, Zinkernagel RM, Tonegawa S. Evidence for a differential avidity model of T cell selection in the thymus. Cell. 1994;76:651–663. doi: 10.1016/0092-8674(94)90505-3. - DOI - PubMed

Publication types

Substances