

The HMGB1/RAGE Pro-Inflammatory Axis in the Human Placenta: Modulating Effect of Low Molecular Weight Heparin
- PMID: 29149067
- PMCID: PMC6150179
- DOI: 10.3390/molecules22111997
The HMGB1/RAGE Pro-Inflammatory Axis in the Human Placenta: Modulating Effect of Low Molecular Weight Heparin
Abstract
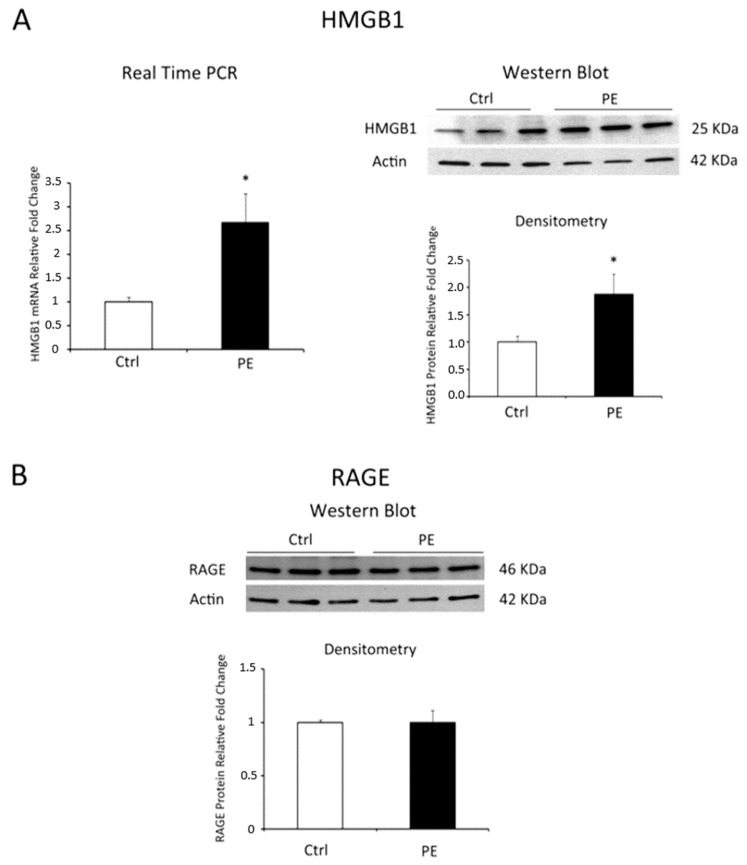
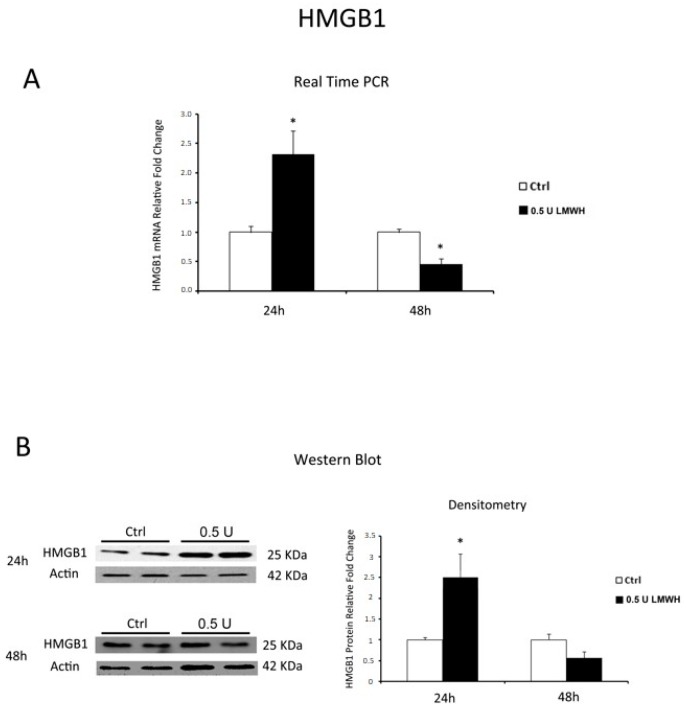
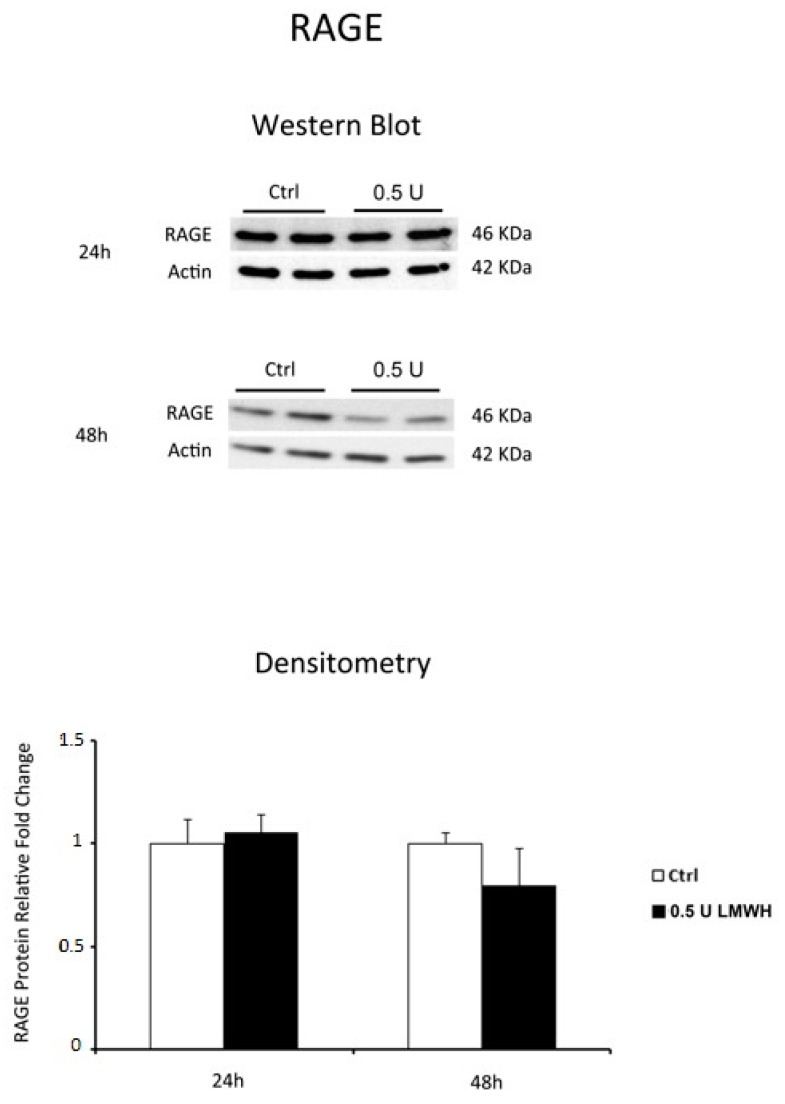
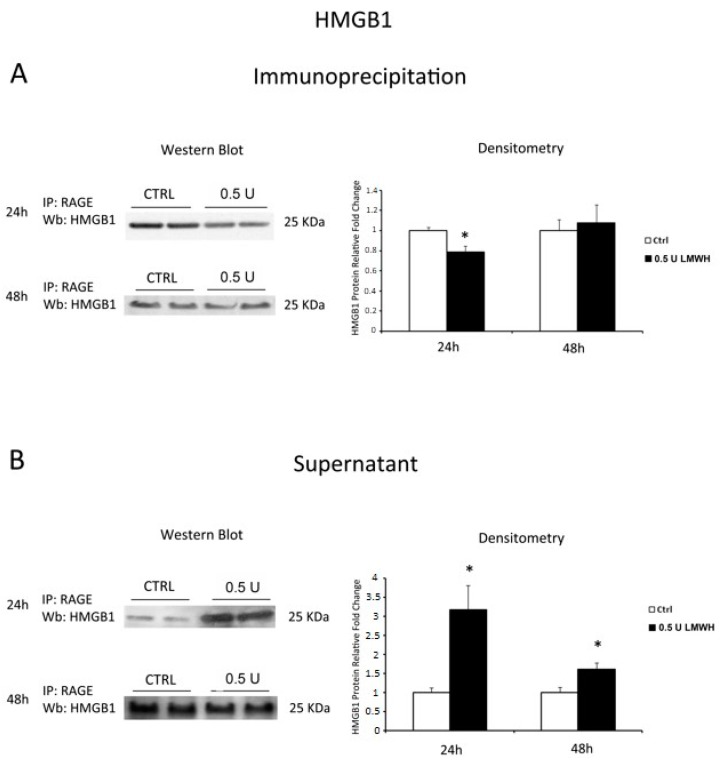
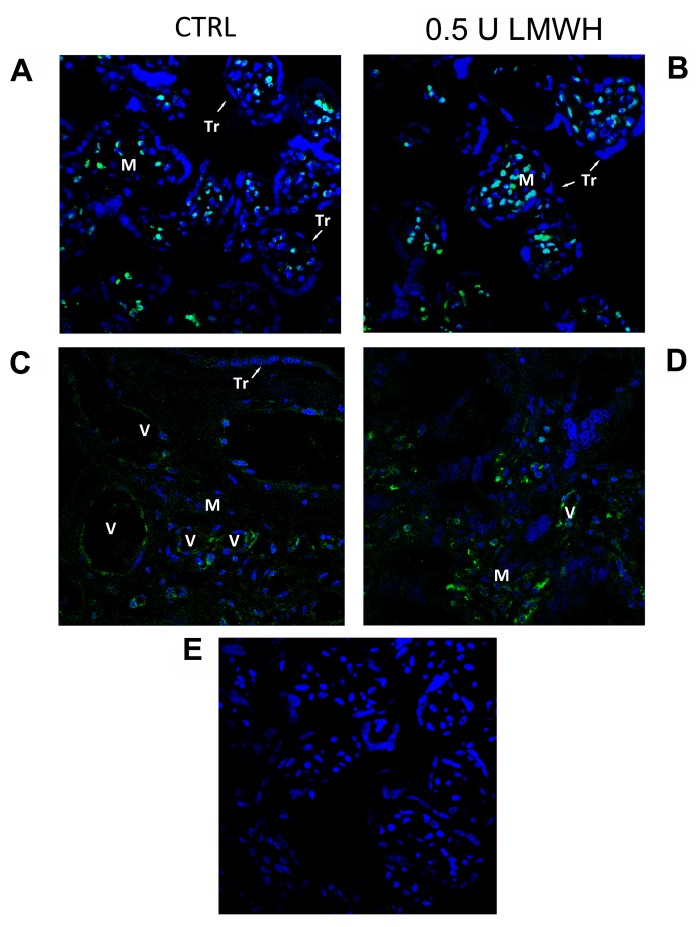
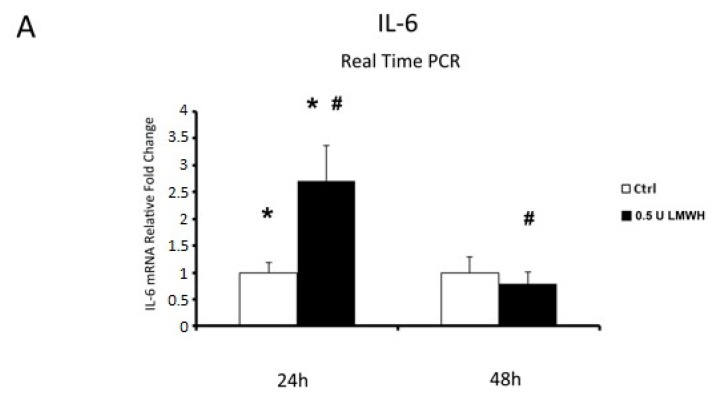
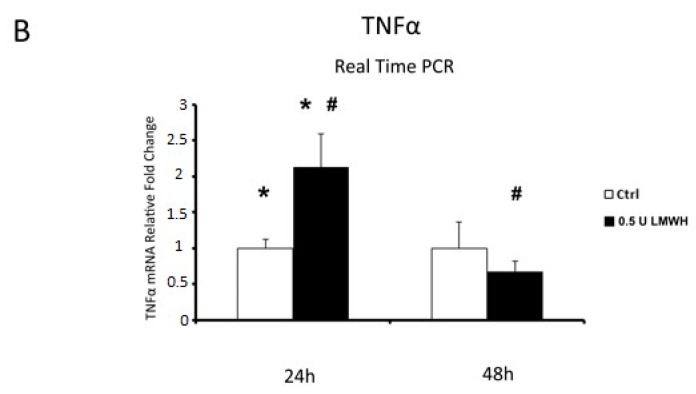
We evaluated whether physiological and pre-eclamptic (PE) placentae, characterized by exacerbated inflammation, presented alterations in pro-inflammatory High Mobility Group Box 1 (HMGB1) and its Receptor of Advanced Glycation End products (RAGE) expression. Moreover, we investigated, in physiological placental tissue, the ability of Low Molecular Weight Heparin (LMWH) to modify HMGB1 structural conformation thus inhibiting RAGE binding and HMGB1/RAGE axis inflammatory activity. HMGB1, RAGE, IL-6 and TNFα (HMGB1/RAGE targets) mRNA expression were assessed by Real Time PCR. HMGB1, RAGE protein levels were assessed by western blot assay. Physiological term placental explants were treated by 0.5 U LMWH for 24 or 48 h. HMGB1 and RAGE expression and association were evaluated in LMWH explants by RAGE immunoprecipitation followed by HMGB1 immunoblot. HMGB1 spatial localization was evaluated by immuofluorescent staining (IF). HMGB1 expression was increased in PE relative to physiological placentae while RAGE was unvaried. 24 h LMWH treatment significantly up-regulated HMGB1 expression but inhibited HMGB1/RAGE complex formation in physiological explants. RAGE expression decreased in treated relative to untreated explants at 48 h. IF showed HMGB1 localization in both cytoplasm and nucleus of mesenchymal and endothelial cells but not in the trophoblast. IL-6 and TNFα gene expression were significantly increased at 24 h relative to controls, while they were significantly down-regulated in 48 h vs. 24 h LMWH explants. Our data depicted a new molecular mechanism through which LMWH exerts its anti-inflammatory effect on PE placentae, underlying the importance of HMGB1/RAGE axis in PE inflammatory response.
Keywords: HMGB1; heparin; placenta; pre-eclampsia; receptor for advanced glycation end products (RAGE).
Conflict of interest statement
The authors declare no conflict of interest. The founding sponsors (Alfa Wassermann and Carlo Denegri Foundation) had no role in the design of the study; in the collection, analyses, or interpretation of data; in the writing of the manuscript, and in the decision to publish the results.
Figures
Similar articles
-
[Correlation between the expression of high mobility group box 1 and receptor for advanced glycation end products and the onset of pre-eclampsia].Zhonghua Fu Chan Ke Za Zhi. 2008 Oct;43(10):746-50. Zhonghua Fu Chan Ke Za Zhi. 2008. PMID: 19087540 Chinese.
-
HMGB1-RAGE signaling pathway in severe preeclampsia.Placenta. 2015 Oct;36(10):1148-52. doi: 10.1016/j.placenta.2015.08.006. Epub 2015 Aug 15. Placenta. 2015. PMID: 26303759
-
Low molecular weight heparin suppresses receptor for advanced glycation end products-mediated expression of malignant phenotype in human fibrosarcoma cells.Cancer Sci. 2013 Jun;104(6):740-9. doi: 10.1111/cas.12133. Epub 2013 Mar 24. Cancer Sci. 2013. PMID: 23421467 Free PMC article.
-
Expatiating the molecular approaches of HMGB1 in diabetes mellitus: Highlighting signalling pathways via RAGE and TLRs.Mol Biol Rep. 2021 Feb;48(2):1869-1881. doi: 10.1007/s11033-020-06130-x. Epub 2021 Jan 21. Mol Biol Rep. 2021. PMID: 33479829 Review.
-
The Immune Tolerance Role of the HMGB1-RAGE Axis.Cells. 2021 Mar 5;10(3):564. doi: 10.3390/cells10030564. Cells. 2021. PMID: 33807604 Free PMC article. Review.
Cited by
-
T helper cell immunity in pregnancy and influence on autoimmune disease progression.J Autoimmun. 2021 Jul;121:102651. doi: 10.1016/j.jaut.2021.102651. Epub 2021 May 18. J Autoimmun. 2021. PMID: 34020252 Free PMC article. Review.
-
Role of HMGB1 on the onset of preeclampsia.BMC Pregnancy Childbirth. 2025 May 29;25(1):626. doi: 10.1186/s12884-025-07701-1. BMC Pregnancy Childbirth. 2025. PMID: 40442700 Free PMC article.
-
Epithelial microRNA-30a-3p targets RUNX2/HMGB1 axis to suppress airway eosinophilic inflammation in asthma.Respir Res. 2022 Jan 29;23(1):17. doi: 10.1186/s12931-022-01933-x. Respir Res. 2022. PMID: 35093061 Free PMC article.
-
Homeostatic Macrophages Prevent Preterm Birth and Improve Neonatal Outcomes by Mitigating In Utero Sterile Inflammation in Mice.J Immunol. 2024 Dec 1;213(11):1620-1634. doi: 10.4049/jimmunol.2400467. J Immunol. 2024. PMID: 39431882 Free PMC article.
-
Etiological Value of Sterile Inflammation in Preeclampsia: Is It a Non-Infectious Pregnancy Complication?Front Cell Infect Microbiol. 2021 Aug 16;11:694298. doi: 10.3389/fcimb.2021.694298. eCollection 2021. Front Cell Infect Microbiol. 2021. PMID: 34485175 Free PMC article. Review.
References
-
- ACOG Committee on Obstetric Practice ACOG Practice Bulletin. Diagnosis and management of preeclampsia and eclampsia. Number 33, January 2002. American College of Obstetricians and Gynecologists. Int. J. Gynaecol. Obstet. Off. Organ Int. Fed. Gynaecol. Obstet. 2002;77:67–75. - PubMed
-
- Smarason A.K., Sargent I.L., Starkey P.M., Redman C.W. The effect of placental syncytiotrophoblast microvillous membranes from normal and pre-eclamptic women on the growth of endothelial cells in vitro. Br. J. Obstet. Gynaecol. 1993;100:943–949. doi: 10.1111/j.1471-0528.1993.tb15114.x. - DOI - PubMed
MeSH terms
Substances
LinkOut - more resources
Full Text Sources
Other Literature Sources
Miscellaneous
