. 2017 Dec 15;45(22):12888-12903.
doi: 10.1093/nar/gkx1048.

Discovering the 3' UTR-mediated regulation of alpha-synuclein

Collaborators, Affiliations

Discovering the 3' UTR-mediated regulation of alpha-synuclein

Domenica Marchese et al. Nucleic Acids Res. .

Abstract

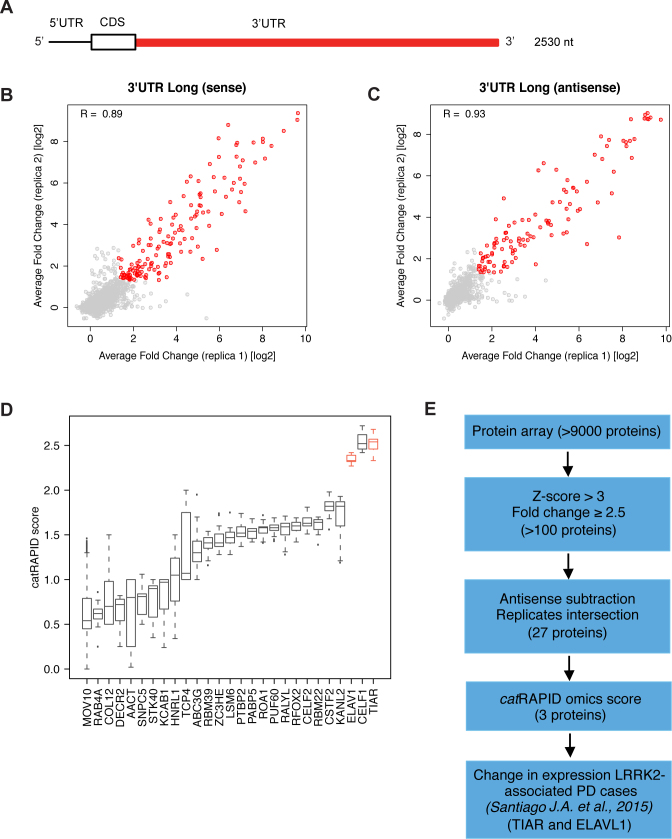
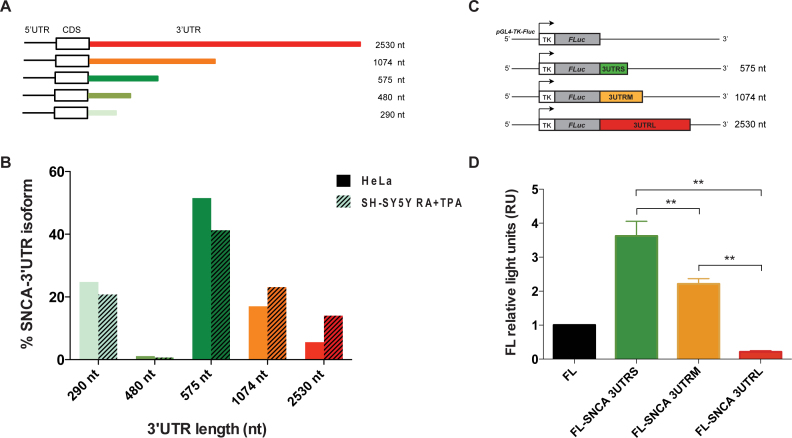
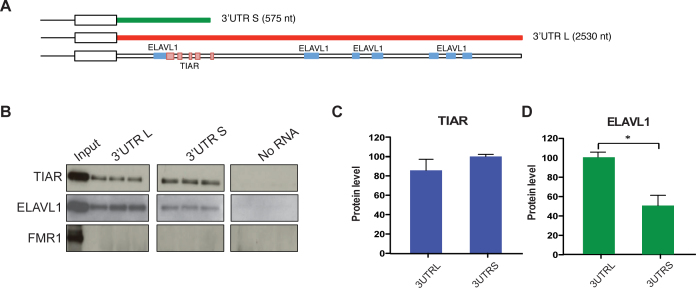
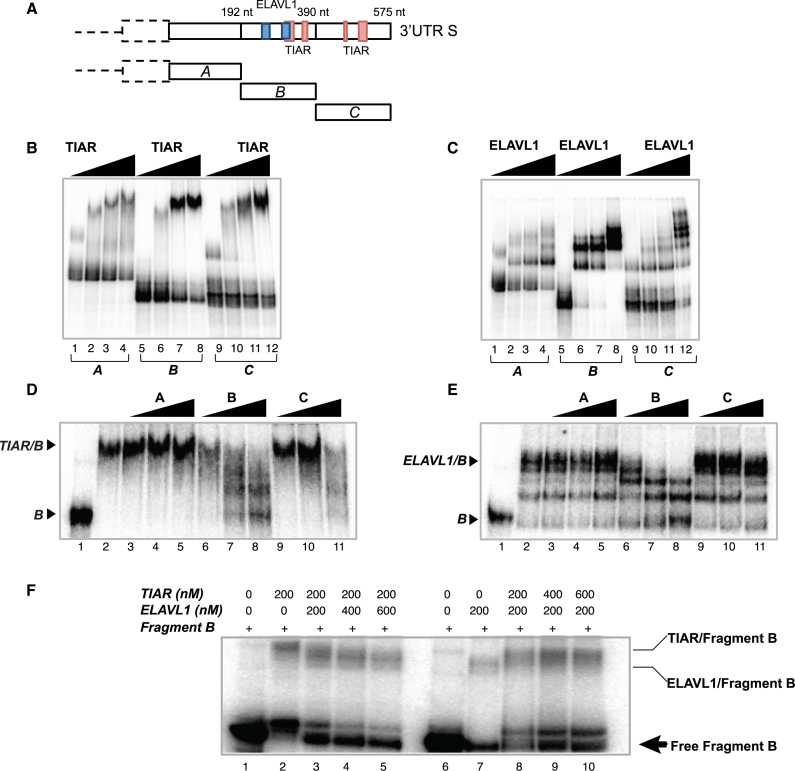
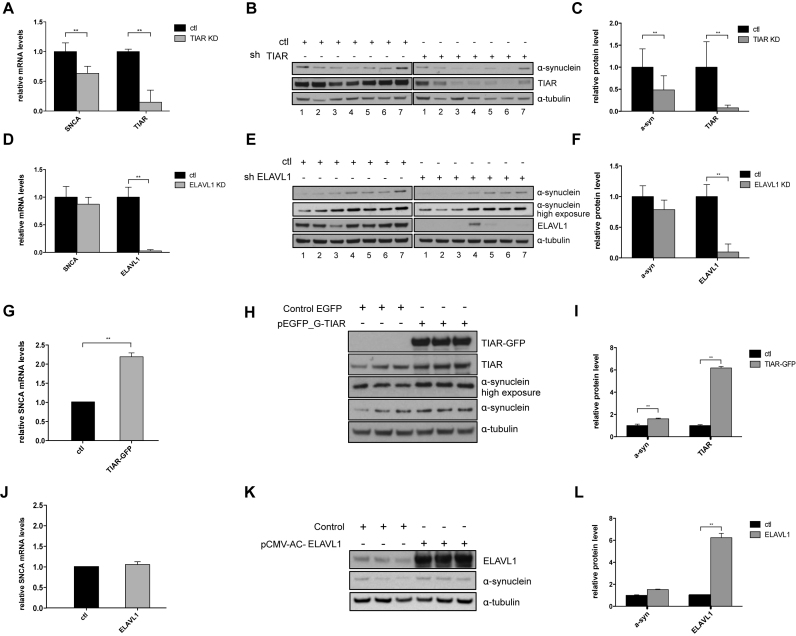
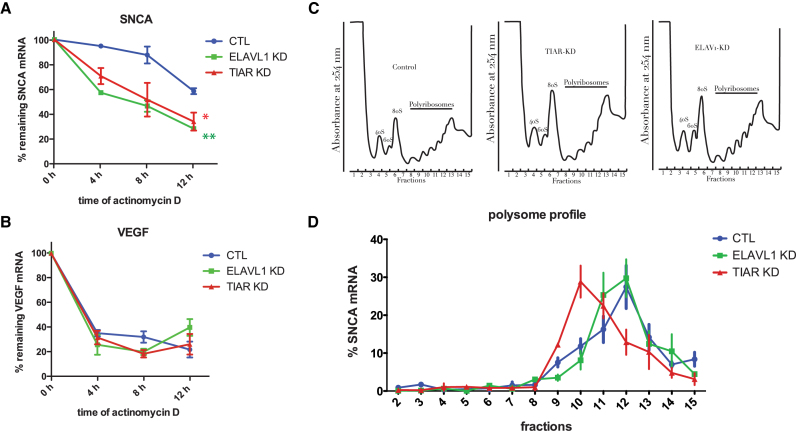
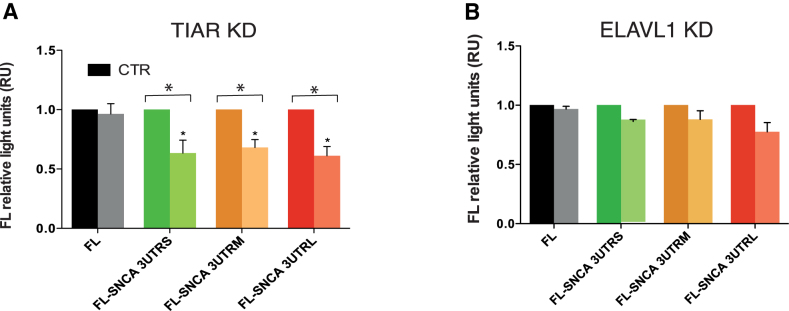
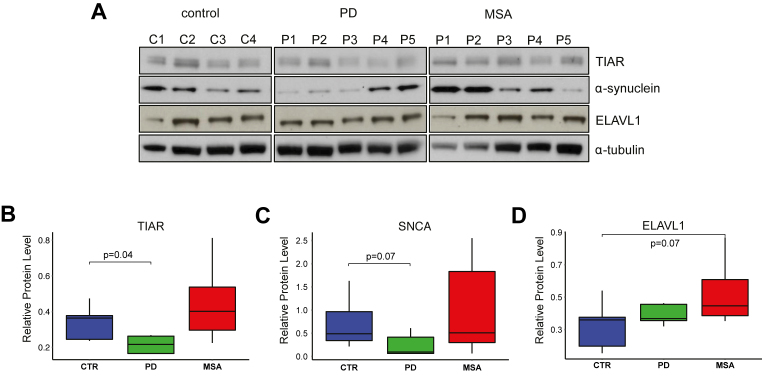
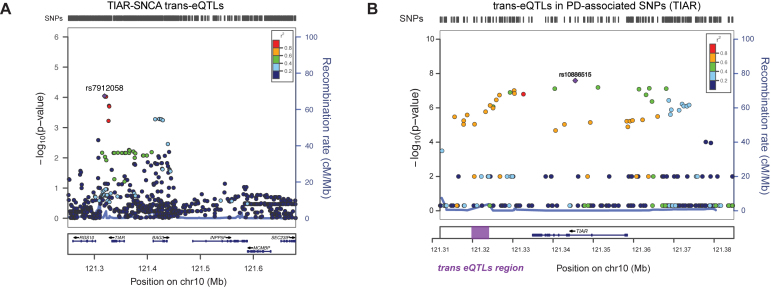
Recent evidence indicates a link between Parkinson's Disease (PD) and the expression of a-synuclein (SNCA) isoforms with different 3' untranslated regions (3'UTRs). Yet, the post-transcriptional mechanisms regulating SNCA expression are unknown. Using a large-scale in vitro /in silico screening we identified RNA-binding proteins (RBPs) that interact with SNCA 3' UTRs. We identified two RBPs, ELAVL1 and TIAR, that bind with high affinity to the most abundant and translationally active 3' UTR isoform (575 nt). Knockdown and overexpression experiments indicate that both ELAVL1 and TIAR positively regulate endogenous SNCA in vivo. The mechanism of regulation implies mRNA stabilization as well as enhancement of translation in the case of TIAR. We observed significant alteration of both TIAR and ELAVL1 expression in motor cortex of post-mortem brain donors and primary cultured fibroblast from patients affected by PD and Multiple System Atrophy (MSA). Moreover, trans expression quantitative trait loci (trans-eQTLs) analysis revealed that a group of single nucleotide polymorphisms (SNPs) in TIAR genomic locus influences SNCA expression in two different brain areas, nucleus accumbens and hippocampus. Our study sheds light on the 3' UTR-mediated regulation of SNCA and its link with PD pathogenesis, thus opening up new avenues for investigation of post-transcriptional mechanisms in neurodegeneration.


Figures

Figure 1.
Figure 1.
Large scale screening of SNCA 3′UTR protein interactors. (A) SNCA 3′UTR long (3′UTR L) used in our experiments in vitro; Pearson's correlation between two protein array replicates probed with (A) 3′UTR L sense and (B) antisense (right) RNAs. (sense: R = 0.89; (C) antisense: R = 0.93). Selected binders with fold change (signal to background ratio) >2.5 and associated Z-score > 3 are represented as red dots, while less significant binders are reported in grey. (D) Median value of catRAPID score of SNCA 3′UTR top interactors: 27 proteins; TIAR (also known as TIAL1) and ELAVL1 (ELAV1) are highlighted in red). (E) Sketch of the in vitro / in silico procedure followed to identify TIAR and ELAVL1 interactions.
Figure 2.
Figure 2.
Measurement of SNCA 3′UTR isoforms expression in HeLa and in vitro differentiated SH-SY5Y cell lines and effect of 3′UTR length on gene reporter activity. (A) Details of the five isoforms of SNCA transcript with different lengths of the 3′UTR, ranging from 290 nt (light green) to 2.5 kb (red). (B) Percentage of each of the five SNCA transcript isoforms in HeLa cells and in vitro differentiated SH-SY5Y cells measured by gene-specific 3′end RNA sequencing. (C) Dual luciferase gene reporter assay. Scheme of the three constructs carrying the sequence of SNCA 3′UTR S (575 nt), M (1074 nt) and L (2530 nt) at the 3′ of luciferase coding sequence. (D) Firefly relative to Renilla luciferase activity of the three constructs (FL-SNCA 3′UTRS, FL-SNCA 3′UTRM and FL-SNCA 3′UTRL) compared to control empty vector FL. * P-value < 0.05 (Wilcoxon's test).
Figure 3.
Figure 3.
In vitro validation of TIAR and ELAVL1 binding to SNCA 3′UTR. (A) CLIP binding sites along the sequence of SNCA 3′ UTR as reported in the Atlas of UTR regulatory activity (AURA) database (http://aura.science.unitn.it/). TIAR cluster of binding sites (291–318, 353–367, 429–437, 476–511, 578–584 nt) are represented as pink boxes and ELAVL1 binding sites (230–315, 1224–1276, 1546–1567, 1650–1690, 2057–2102, 2113–2153 and 2229–2269 nt) are represented as blue boxes. (B) RNA affinity purification assay performed in technical triplicates. (C) TIAR and (D) ELAVL1 are co-purified with the in vitro synthesized RNA of SNCA 3′UTR long and short (Western Blot). FMR1 is used as negative control.
Figure 4.
Figure 4.
In vitro characterization of TIAR and ELAVL1 binding sites of SNCA 3′UTR short. (A) Schematic representation of the sequence of SNCA 3′UTR S and TIAR/ELAVL1 binding sites previously identified by CLIP. The sequence of the 3′UTR S is divided into three fragments (A, B and C) of ∼190 nt each to test the binding ability of TIAR and ELAVL1. (B) RNA electrophoretic mobility shift assay (REMSA) of fragments A, B and C of SNCA 3′UTR S upon incubation with increasing concentrations of GST-tagged TIAR protein (0, 100, 200, 500 nM). (C) RNA electrophoretic mobility shift assay (REMSA) of fragments A, B and C of SNCA 3′UTR S upon incubation with increasing concentrations of GST-tagged ELAVL1 protein (0, 100, 200, 500 nM). (D) Competition gel shift assay showing binding specificity of TIAR protein for fragment B. Lane 1. Probe B alone, Lane 2. Probe B with 200 nM TIAR, Lane 3–11. Probe B with 200 nM TIAR in presence of 0.1, 1 and 10 nM of cold probe A, B and C. (E) Competition gel shift assay showing binding specificity of ELAVL1 protein for fragment B RNA. Lane 1. Probe B alone, Lane 2. Probe B with 100 nM ELAVL1, Lane 3–11. Probe B with 100 nM ELAVL1 in presence of 0.1, 1 and 10 nM of cold probe A, B and C. (F) Competition assay. Labeled fragment B was incubated with 200 nM of TIAR (lane 2) or 200 nM of ELAVL1 (lane 7). Competition between TIAR and ELAVL1 was performed by incubating fragment B with constant amount of TIAR (200nM) and increasing amount of ELAVL1 (lanes 3, 4 and 5) or constant amount of ELAVL1 (200nM) and increasing amounts of TIAR (lanes 8, 9 and 10).
Figure 5.
Figure 5.
Analysis of TIAR and ELAVL1 regulatory role on α-synuclein expression in HeLa cells. (A) Relative SNCA mRNA levels measured by qPCR upon stable knockdown of TIAR in HeLa cells compared to control cells. (B) α-synuclein protein down-regulation measured by Western Blot upon stable knockdown of TIAR protein in HeLa cells. (C) Average and standard deviation of seven biological replicates are reported (**P-value < 0.01, Student's t-test). (D) Fold change of SNCA mRNA upon KD of ELAVL1. (E) α-synuclein protein down-regulation measured by western blot upon stable knockdown of ELAVL1 in HeLa cells. (F) Average and standard deviation of seven biological replicates are reported (**P-value < 0.01, Student's t-test) (GI) Relative SNCA mRNA and α-synuclein protein up-regulation in HeLa cells overexpressing GFP-tagged TIAR protein compared to control cells (**P-value < 0.01, Student's t-test). (J-L) Relative SNCA mRNA and α-synuclein protein levels in HeLa cells overexpressing ELAVL1 protein compared to control cells (*P-value < 0.05, Student's t-test).
Figure 6.
Figure 6.
TIAR and ELAVL1 role in SNCA mRNA stability and translation. (A) Percentage of remaining SNCA mRNA measured at 0, 4, 8 and 12 h after transcription inhibition with actinomycin D in control, TIAR knockdown and ELAVL1 knockdown HeLa cells. Mean and standard deviation of three independent experiments are shown (Kolmogorov-Smirnov test with respect to control curve, *P-value < 0.1; **P-value < 0.01). (B) VEGF mRNA is a control for the effectiveness of the actinomycin D treatment. (C) Polysome profile of HeLa control, TIAR knockdown and ELAVL1 knockdown cells. (D) Percentage of SNCA mRNA distribution across polysome gradient in HeLa control, TIAR knockdown and ELAVL1 knockdown conditions. Data shown are mean with standard deviation of three independent experiments.
Figure 7.
Figure 7.
Dual firefly luciferase activity of SNCA 3′ UTRs upon TIAR or ELAVL1 knockdown. We measured luciferase activities of SNCA 3′UTRs with respect to control empty vector FL. (A) TIAR KD. We observed a fold decrease of 0.63, 0.68 and 0.61 for FL-SNCA 3′UTRS, FL-SNCA 3′UTRM and FL-SNCA 3′UTRL. No significant change was instead observed for the construct carrying the sequence of the firefly luciferase gene (B). ELAVL1 KD. Mild decrease of the signal is observed for FL-SNCA 3′UTRS, FL-SNCA 3′UTRM and FL-SNCA 3′UTRL with an average fold change of 0.86, 0.88 and 0.77 respectively. * P-value < 0.05 (Wilcoxon's test).
Figure 8.
Figure 8.
TIAR, ELAVL1 and α-synuclein protein levels in motor cortex post-mortem samples. (A) α-synuclein TIAR and ELAVL1 protein level in motor cortex tissue of post-mortem control individuals, PD and MSA patients measured by western blot. Normalized average values of (B) TIAR, (C) α-synuclein and (D) ELAVL1 in the three groups (Wilcoxon's test P-values are reported).
Figure 9.
Figure 9.
SNCAtrans expression Quantitative Trait Loci (trans-eQTLs) analysis of TIAR and ELAVL1. (A) SNCAtrans-eQTLs analysis in the region chr10:121250246–121682830 (hg19) spanning from 84 kb upstream TIAR gene to 94 kb downstream neighboring INPP5F gene. The analysis, performed using GTEX data available for human hippocampus tissue (n = 81), shows highly significant SNCA trans-eQTLs P-values (P-values < 10−9) for a group of SNPs downstream TIAR gene (red and purple dots). A locus zoom graph shows that the significant SNCA trans-eQTLs in TIAR region present the typical pattern of linkage disequilibrium (LD) decay of association signals, with a top-associated SNP and other surrounding associated SNPs in progressively decaying LD values (‘Recombination rate’ on right y-axes). (B) PD-associated SNPs from previous GWAS studies (58) in the genomic region of chromosome 10 including TIAR gene. The –log(P-value) is represented on the left y-axes, while the ‘recombination rate’ is represented on the right y-axes. The region downstream TIAR locus where significant SNCA trans-eQTLs map is highlighted with a purple rectangle.

References

    1. de Lau L.M.L., Breteler M.M.B.. Epidemiology of Parkinson's disease. Lancet Neurol. 2006; 5:525–535. - PubMed
    1. Dauer W., Przedborski S.. Parkinson's disease: mechanisms and models. Neuron. 2003; 39:889–909. - PubMed
    1. Spillantini M.G., Schmidt M.L., Lee V.M., Trojanowski J.Q., Jakes R., Goedert M.. Alpha-synuclein in Lewy bodies. Nature. 1997; 388:839–840. - PubMed
    1. Zanzoni A., Marchese D., Agostini F., Bolognesi B., Cirillo D., Botta-Orfila M., Livi C.M., Rodriguez-Mulero S., Tartaglia G.G.. Principles of self-organization in biological pathways: a hypothesis on the autogenous association of alpha-synuclein. Nucleic Acids Res. 2013; 41:9987–9998. - PMC - PubMed
    1. Rhinn H., Qiang L., Yamashita T., Rhee D., Zolin A., Vanti W., Abeliovich A.. Alternative α-synuclein transcript usage as a convergent mechanism in Parkinson's disease pathology. Nat. Commun. 2012; 3:1084. - PMC - PubMed

MeSH terms