. 2018 Apr 1;35(4):984-1002.
doi: 10.1093/molbev/msx294.

The Effect of Nonreversibility on Inferring Rooted Phylogenies

Affiliations

The Effect of Nonreversibility on Inferring Rooted Phylogenies

Svetlana Cherlin et al. Mol Biol Evol. .

Erratum in

Abstract

Most phylogenetic models assume that the evolutionary process is stationary and reversible. In addition to being biologically improbable, these assumptions also impair inference by generating models under which the likelihood does not depend on the position of the root. Consequently, the root of the tree cannot be inferred as part of the analysis. Yet identifying the root position is a key component of phylogenetic inference because it provides a point of reference for polarizing ancestor-descendant relationships and therefore interpreting the tree. In this paper, we investigate the effect of relaxing the unrealistic reversibility assumption and allowing the position of the root to be another unknown. We propose two hierarchical models that are centered on a reversible model but perturbed to allow nonreversibility. The models differ in the degree of structure imposed on the perturbations. The analysis is performed in the Bayesian framework using Markov chain Monte Carlo methods for which software is provided. We illustrate the performance of the two nonreversible models in analyses of simulated data using two types of topological priors. We then apply the models to a real biological data set, the radiation of polyploid yeasts, for which there is robust biological opinion about the root position. Finally, we apply the models to a second biological alignment for which the rooted tree is controversial: the ribosomal tree of life. We compare the two nonreversible models and conclude that both are useful in inferring the position of the root from real biological data.


Figures

<sc>Fig</sc>. 1.
Fig. 1.
An unrooted 30-taxon tree derived from a recent analysis (Williams et al. 2012) describing the relationships between Archaea and Eukaryota. A root on the branch E1 corresponds to the three-domain hypothesis (located between monophyletic Archaea and Eukaryota), whereas a root on the branch E2 corresponds to the eocyte hypothesis (located within paraphyletic Archaea, separating Euryarchaeota from the clade comprising the TACK superphylum and Eukaryota).
<sc>Fig</sc>. 2.
Fig. 2.
Posterior distribution of the root splits for three different alignments simulated for each of the six rooted trees according to table 3. Different bars on each plot represent different root splits ordered by posterior probabilities, with the highlighted bar representing the true root split. In the plots for Trees 2, 4, and 6, the split corresponding to a root on edge E1 is also marked.
<sc>Fig</sc>. 3.
Fig. 3.
Rooted phylogeny of the paleopolyploid yeasts supported by the whole-gene duplication analysis (not drawn to scale), reproduced from the YGOB web site (Byrne and Wolfe 2005; http://ygob.ucd.ie 2015; last accessed January 1, 2015). The tree is rooted according to the outgroup method based on an analysis with the GTR + I+G model in a maximum likelihood framework (Hedtke et al. 2006). Roots 1 and 2 represent the two most plausible posterior root splits in the current analysis.
<sc>Fig</sc>. 4.
Fig. 4.
The posterior distribution of the root splits of the paleopolyploid yeasts data set for both NR and NR2 models analyzed (a) with the structured uniform prior and (b) with the Yule prior. Different bars on the plot represent different root splits on the posterior distribution of trees ordered by posterior probabilities (roots 1 and 2 are mapped in fig. 3). In (a), the analysis performed with the structured uniform prior, the root split supported by outgroup rooting (Hedtke et al. 2006) has the highest posterior probability (root 1, highlighted), whereas root 2 is placed within the post-WGD clade. In (b), the analysis performed with the Yule prior, the root split supported by outgroup rooting (Hedtke et al. 2006) has the second highest posterior probability (root 1, highlighted). The posterior modal root 2 is placed within the post-WGD clade.
<sc>Fig</sc>. 5.
Fig. 5.
Rooted majority rule consensus tree of the paleopolyploid yeasts data set, inferred under the NR model using (a) the structured uniform prior and (b) the Yule prior, with the WGD event mapped. The analysis is based on the alignment of concatenated large and small subunit ribosomal DNA sequences for 20 yeast species, 4,460 bp. The trees differ from that supported by the WGD analysis by the placement of Vanderwaltozyma polyspora (highlighted) within the pre-WGD clade. The consensus trees obtained under the analyses using the NR2 model are very similar and so not shown.
<sc>Fig</sc>. 6.
Fig. 6.
Rooted majority rule consensus tree for the tree of life data set, inferred under the NR model using the Yule prior. The tree supports the eocyte hypothesis by placing Eukaryota within Archaea, as a sister group to the TACK superphylum. Roots 1, 2, and 3 are the root splits having the highest posterior support in the current analysis. Posterior support for these root splits is shown in figure 7. The consensus tree inferred under the NR2 model using the Yule prior is similar and so not shown. The same is true for both models using the structured uniform prior.
<sc>Fig</sc>. 7.
Fig. 7.
The posterior distribution of the root splits of the tree of life data set for the NR model analyzed with (a) the Yule prior and (b) with the structured uniform prior. Different bars on the plot represent different root splits on the posterior distribution of trees (ordered by posterior probabilities). The root split on the branch leading to Bacteria has the highest posterior probability (root 1). Root 2 is placed within Bacteria (on the branch leading to Rhodopirellula baltica) and root 3 is placed on the branch leading to Eukaryota (the roots are mapped in fig. 6). The posterior distributions obtained under the analyses using the NR2 model are very similar and so not shown.
<sc>Fig</sc>. 8.
Fig. 8.
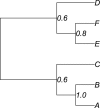
Majority rule consensus tree for illustrative example.

References

    1. Alfaro ME, Holder MT.. 2006. The posterior and the prior in Bayesian phylogenetics. Annu Rev Ecol Evol Syst. 371:19–42.10.1146/annurev.ecolsys.37.091305.110021 - DOI
    1. Baldauf SL, Palmer JD, Doolittle WF.. 1996. The root of the universal tree and the origin of eukaryotes based on elongation factor phylogeny. Proc Natl Acad Sci U S A. 9315:7749–7754.10.1073/pnas.93.15.7749 - DOI - PMC - PubMed
    1. Bergsten J. 2005. A review of long-branch attraction. Cladistic 212:163–193.10.1111/j.1096-0031.2005.00059.x - DOI - PubMed
    1. Blanquart S, Lartillot N.. 2006. A Bayesian compound stochastic process for modeling nonstationary and nonhomogeneous sequence evolution. Mol Biol Evol. 2311:2058–2071.10.1093/molbev/msl091 - DOI - PubMed
    1. Brown JR, Doolittle WF.. 1995. Root of the universal tree of life based on ancient aminoacyl-tRNA synthetase gene duplications. Proc Natl Acad Sci U S A. 927:2441–2445.10.1073/pnas.92.7.2441 - DOI - PMC - PubMed

Publication types

LinkOut - more resources