

Changes in Cytokine, Filarial Antigen, and DNA Levels Associated With Adverse Events Following Treatment of Lymphatic Filariasis
- PMID: 29149303
- PMCID: PMC5853815
- DOI: 10.1093/infdis/jix578
Changes in Cytokine, Filarial Antigen, and DNA Levels Associated With Adverse Events Following Treatment of Lymphatic Filariasis
Erratum in
-
Erratum.J Infect Dis. 2018 Mar 28;217(8):1334. doi: 10.1093/infdis/jiy078. J Infect Dis. 2018. PMID: 29584877 Free PMC article. No abstract available.
Abstract
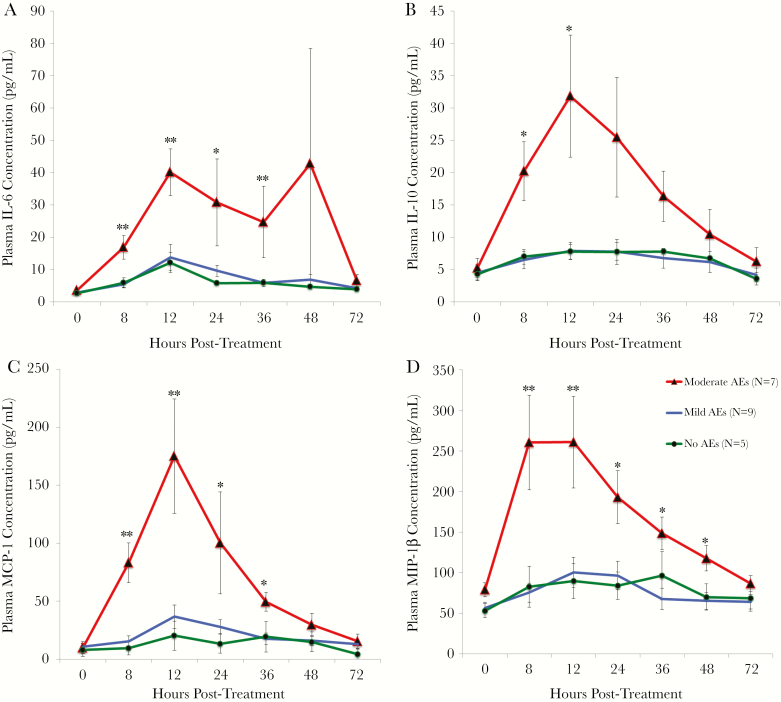
Background: Mild to moderate adverse events (AEs) are common after treatment of lymphatic filariasis (LF) and pose a major challenge for the global LF elimination program. We studied changes in cytokine levels and filarial worm components in plasma of subjects with and without AEs following treatment of LF.
Methods: Participants (n = 24) were hospitalized and monitored for AEs following treatment. Cytokines (27), filarial DNA, circulating filarial antigen (CFA), and immune complexes were measured in plasma samples collected before and after treatment.
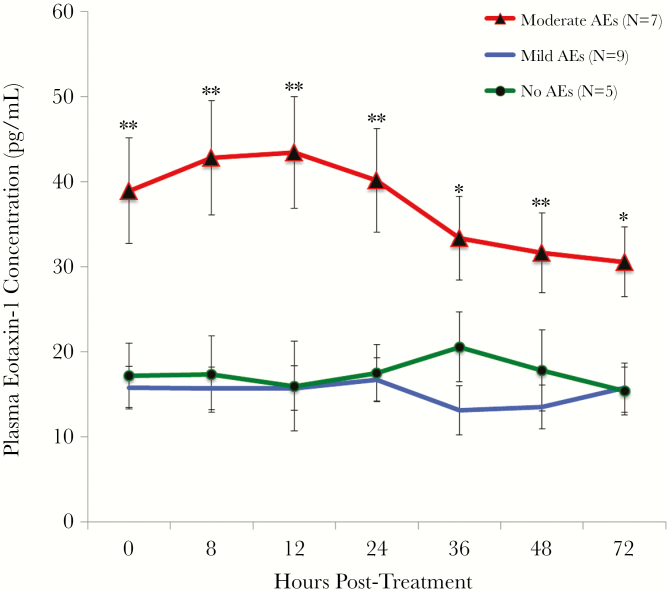
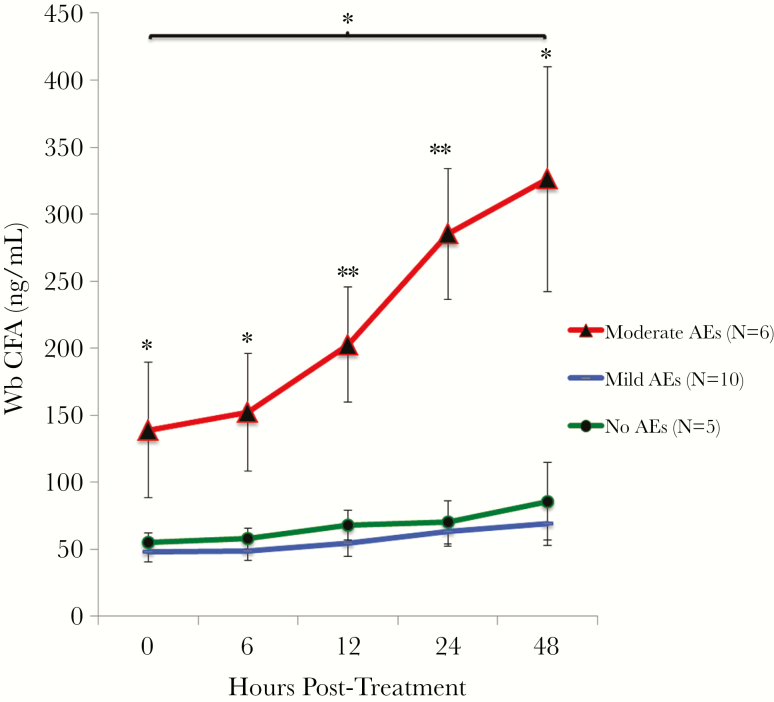
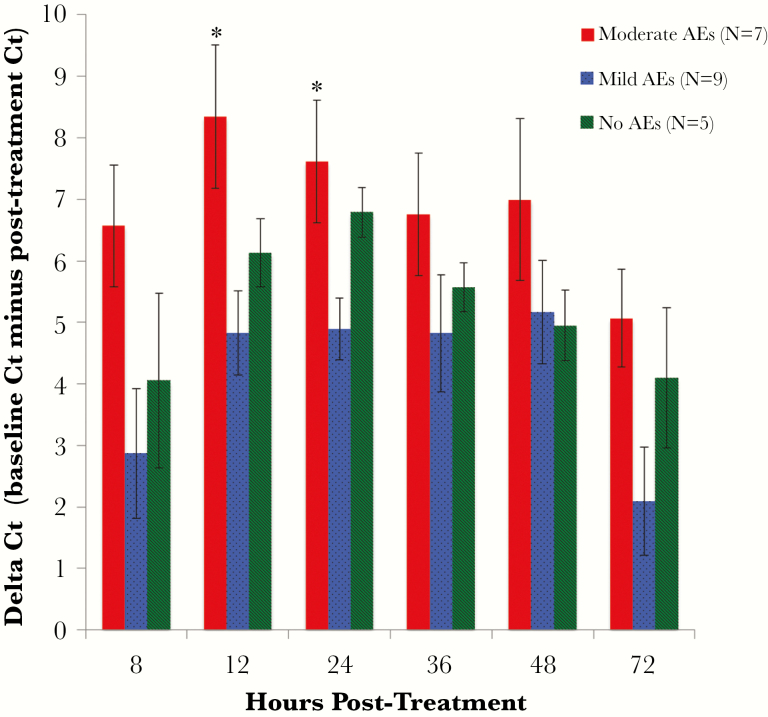
Results: Levels for 16 cytokines increased after treatment in individuals with moderate AEs compared to individuals with no and/or mild AEs. These included 3 major proinflammatory cytokines (interleukin 6, tumor necrosis factor α, and interleukin 1β). Eotaxin-1 levels were elevated at baseline in individuals who developed moderate AEs after treatment; thus, eotaxin-1 is a potential biomarker for AE risk. CFA and filarial DNA levels increased more in individuals with moderate AEs after treatment than in people with no/mild AEs.
Conclusions: Increases in cytokine, filarial DNA, and CFA levels were associated with development of AEs following treatment of LF. Improved understanding of the pathogenesis of AEs may lead to improved methods for their prevention or management that could increase compliance in elimination programs.
Keywords: adverse events; circulating filarial antigenemia; cytokines; lymphatic filariasis; therapy.
© The Author 2017. Published by Oxford University Press for the Infectious Diseases Society of America.
Figures
Similar articles
-
Systems analysis-based assessment of post-treatment adverse events in lymphatic filariasis.PLoS Negl Trop Dis. 2019 Sep 26;13(9):e0007697. doi: 10.1371/journal.pntd.0007697. eCollection 2019 Sep. PLoS Negl Trop Dis. 2019. PMID: 31557154 Free PMC article. Clinical Trial.
-
An open label, block randomized, community study of the safety and efficacy of co-administered ivermectin, diethylcarbamazine plus albendazole vs. diethylcarbamazine plus albendazole for lymphatic filariasis in India.PLoS Negl Trop Dis. 2021 Feb 16;15(2):e0009069. doi: 10.1371/journal.pntd.0009069. eCollection 2021 Feb. PLoS Negl Trop Dis. 2021. PMID: 33591979 Free PMC article. Clinical Trial.
-
A comprehensive assessment of lymphatic filariasis in Sri Lanka six years after cessation of mass drug administration.PLoS Negl Trop Dis. 2014 Nov 13;8(11):e3281. doi: 10.1371/journal.pntd.0003281. eCollection 2014. PLoS Negl Trop Dis. 2014. PMID: 25393404 Free PMC article.
-
Adverse events following single dose treatment of lymphatic filariasis: Observations from a review of the literature.PLoS Negl Trop Dis. 2018 May 16;12(5):e0006454. doi: 10.1371/journal.pntd.0006454. eCollection 2018 May. PLoS Negl Trop Dis. 2018. PMID: 29768412 Free PMC article. Review.
-
Albendazole alone or in combination with microfilaricidal drugs for lymphatic filariasis.Cochrane Database Syst Rev. 2019 Jan 8;1(1):CD003753. doi: 10.1002/14651858.CD003753.pub4. Cochrane Database Syst Rev. 2019. PMID: 30620051 Free PMC article.
Cited by
-
Unraveling the Dynamics of Human Filarial Infections: Immunological Responses, Host Manifestations, and Pathogen Biology.Pathogens. 2025 Feb 25;14(3):223. doi: 10.3390/pathogens14030223. Pathogens. 2025. PMID: 40137708 Free PMC article. Review.
-
Systems analysis-based assessment of post-treatment adverse events in lymphatic filariasis.PLoS Negl Trop Dis. 2019 Sep 26;13(9):e0007697. doi: 10.1371/journal.pntd.0007697. eCollection 2019 Sep. PLoS Negl Trop Dis. 2019. PMID: 31557154 Free PMC article. Clinical Trial.
-
Safety and efficacy of mass drug administration with a single-dose triple-drug regimen of albendazole + diethylcarbamazine + ivermectin for lymphatic filariasis in Papua New Guinea: An open-label, cluster-randomised trial.PLoS Negl Trop Dis. 2022 Feb 9;16(2):e0010096. doi: 10.1371/journal.pntd.0010096. eCollection 2022 Feb. PLoS Negl Trop Dis. 2022. PMID: 35139070 Free PMC article. Clinical Trial.
-
The safety of double- and triple-drug community mass drug administration for lymphatic filariasis: A multicenter, open-label, cluster-randomized study.PLoS Med. 2019 Jun 24;16(6):e1002839. doi: 10.1371/journal.pmed.1002839. eCollection 2019 Jun. PLoS Med. 2019. PMID: 31233507 Free PMC article. Clinical Trial.
-
The safety of combined triple drug therapy with ivermectin, diethylcarbamazine and albendazole in the neglected tropical diseases co-endemic setting of Fiji: A cluster randomised trial.PLoS Negl Trop Dis. 2020 Mar 16;14(3):e0008106. doi: 10.1371/journal.pntd.0008106. eCollection 2020 Mar. PLoS Negl Trop Dis. 2020. PMID: 32176703 Free PMC article. Clinical Trial.
References
-
- Simonsen PE, Fischer PU, Hoerauf A, Weil GJ. The filariases. In: Farrar J, Hotez PJ, Junghanss T, Kang G, Lalloo D, White NJ, eds. Manson’s tropical diseases. 23rd ed Amsterdam, Netherlands: Elsevier, 2013:737–65.
-
- World Health Organization. Global programme to eliminate lymphatic filariasis: progress report, 2015 http://www.who.int/lymphatic_filariasis/resources/who_wer9139/en/. Accessed 30 September 2016.
Publication types
MeSH terms
Substances
LinkOut - more resources
Full Text Sources
Other Literature Sources
