. 2017 Nov 16;171(5):1165-1175.e13.
doi: 10.1016/j.cell.2017.10.035.

Bias Factor and Therapeutic Window Correlate to Predict Safer Opioid Analgesics

Affiliations

Bias Factor and Therapeutic Window Correlate to Predict Safer Opioid Analgesics

Cullen L Schmid et al. Cell. .

Abstract

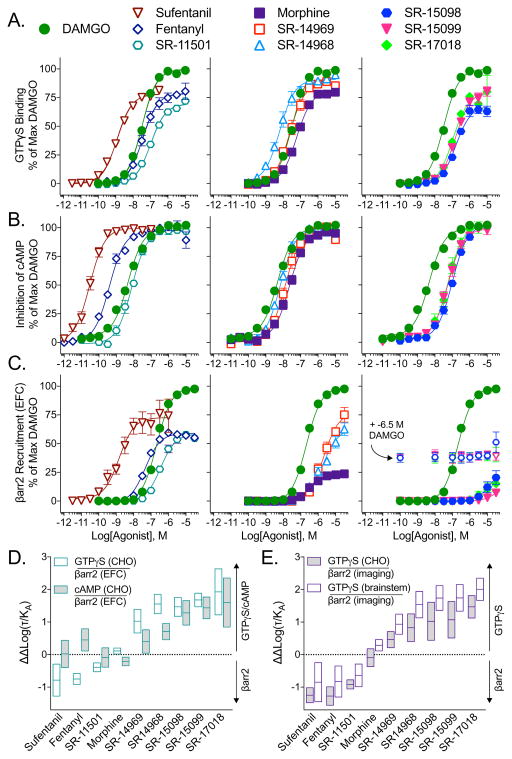
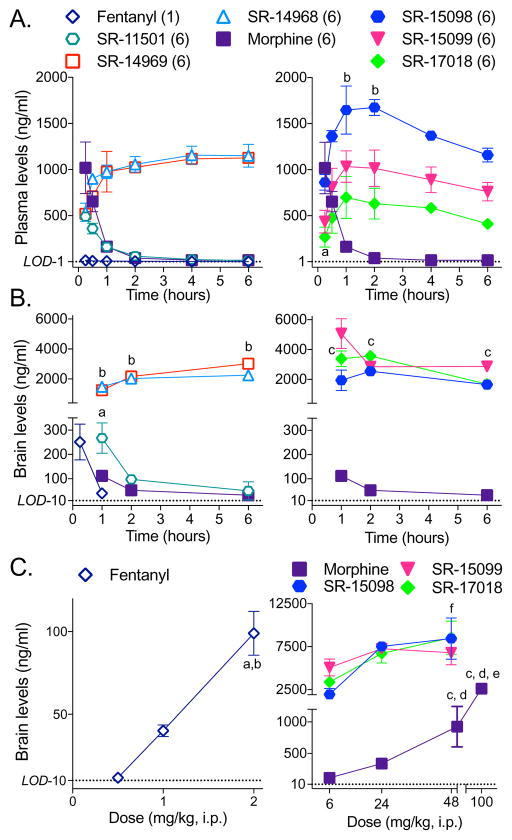
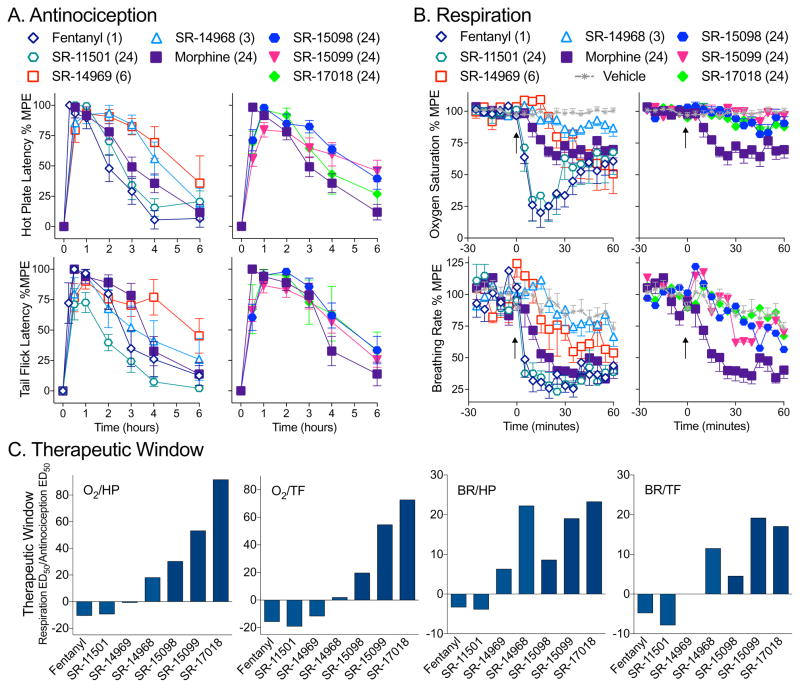
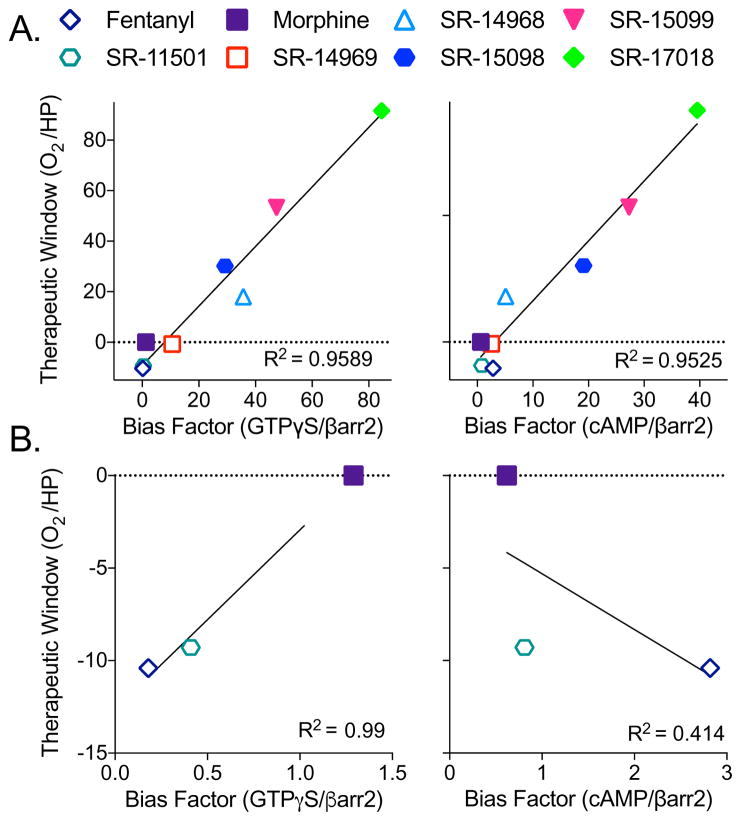
Biased agonism has been proposed as a means to separate desirable and adverse drug responses downstream of G protein-coupled receptor (GPCR) targets. Herein, we describe structural features of a series of mu-opioid-receptor (MOR)-selective agonists that preferentially activate receptors to couple to G proteins or to recruit βarrestin proteins. By comparing relative bias for MOR-mediated signaling in each pathway, we demonstrate a strong correlation between the respiratory suppression/antinociception therapeutic window in a series of compounds spanning a wide range of signaling bias. We find that βarrestin-biased compounds, such as fentanyl, are more likely to induce respiratory suppression at weak analgesic doses, while G protein signaling bias broadens the therapeutic window, allowing for antinociception in the absence of respiratory suppression.

Keywords: G protein-coupled receptor (GPCR); biased agonism; fentanyl; functional selectivity; morphine; mu opioid receptor; pain; respiration; side effects; βarrestin.


Figures

Figure 1
Figure 1. SR compounds are potent activators of GTPγS binding, but have differential βarrestin2 signaling profiles at the human MOR
(A–C) Cell-based assays assessing (A) stimulation of GTPγS binding in membranes and (B) inhibition of forskolin-stimulated cAMP accumulation in CHO-hMOR cells and (C) stimulation of βarrestin2 recruitment in the U2OS-βarrestin-hMOR-PathHunter via the EFC assay. For SR-15098, SR-15099 and SR-17018, βarrestin2 EFC concentration response curves were also performed in the presence of e-6.5 M DAMGO (open symbols) to test for partial agonism. For all three assays, the data were normalized to the % maximal response for DAMGO and are presented as mean ± S.E.M. of 3 or more assays run in duplicate or triplicate. (D–E) The ΔΔLog(τ/KA) bias values with 95% confidence intervals with for the (D) human MOR and (E) mouse MOR. The G protein signaling was determined by either the GTPγS binding assay in CHO-hMOR or CHO-mMOR cells or mouse brainstem or by inhibition of forskolin-stimulated cAMP in CHO-hMOR cells. βarrestin2 recruitment to the MOR was determined by the EFC assay in U2OS-βarrestin-hMOR-PathHunter cells for the human receptor and by the βarrestin2 imaging based assay using the U2OS-βarrestin2-GFP-mMOR cell line for the mouse receptor. In all assays, DAMGO served as the reference agonist. See also: Table 2 for the Log(τ/KA) and ΔΔLog(τ/KA) values with statistical comparison and Figure S3 for the concentration response curves for the mouse MOR assays (cells and brainstem).
Figure 2
Figure 2. SR agonists cross the blood brain barrier and are present in plasma 6 hours after injection
C57BL/6J mice were systemically (i.p.) injected with 6 mg/kg of each agonist (or 1 mg/kg for fentanyl) and (A) plasma and (B) brain levels were determined at the indicated time-points by LC/MS analysis. (A) While morphine and SR-11501 levels decrease over time, the other SR compounds remain at elevated levels up to 6 hours after injection (Dunnett’s multiple comparisons test: morphine (15 minutes) vs: aSR-15099 or SR-17018, p < 0.05; bSR-15098, p < 0.05). (B) The SR compounds can be detected in the brain at higher concentrations than morphine which persist 6 hours following treatment (Dunnett’s multiple comparisons test: morphine (1 hour) vs: aSR-11501, p < 0.01; bSR-14968 or SR-14969, p < 0.0001; cSR-15098 or SR-15099 or SR-17018, p < 0.01). (C) C57BL/6J mice were administered the indicated dose of compound and brain levels were determined 1 hour after injection (i.p.). Increasing the dose of morphine or fentanyl increases the amount of drug in the brain, but there is no difference between the amount of drug in the brain at the 24 and 48 mg/kg doses of the SR compounds tested (One-way ANOVA, followed by Tukey’s post-hoc analysis within each treatment: p < 0.05 when compared to a0.5 mg/kg, b1 mg/kg, c6 mg/kg, d24 mg/kg, e50 mg/kg; ffor SR15-098, 6 versus 48 p < 0.5). Data are presented as mean ± S.E.M. of 3 or more mice. The limits of detection (LOD) are indicated for plasma (1 ng/mL) and brain homogenates (10 ng/mL). See also: Table S3 for the plasma protein binding and estimated free plasma concentrations and Figure S4 for the antinociceptive and respiratory responses that correspond to these doses of the drugs.
Figure 3
Figure 3. Agonists that displayed G protein signaling bias in the cell based assays promote antincocicpetion without respiratory suppression
(A) Antinociceptive responses were measured in male C57BL/6J mice in (A, top) hot plate (52 °C, top) and (A, bottom) warm water tail flick (49 °C) assays over 6 hours at doses (mg/kg, i.p.) of compounds that produce antinociceptive responses on par with morphine in male C57BL/6J mice. (B) Respiratory responses were tested at the same doses in male C57BL/6J mice fit with a pulse oximeter to detect (B, top) % arterial oxygen saturation and (B, bottom) breath rate changes over 1 hour. The data are presented as mean ± S.E.M. of the % maximal possible effect (100% MPE), with basal responses determined for each mouse (A) prior to injection or (B) as the average response for 30 minutes prior to injection (at time 0, arrow) and setting the maximum thresholds at 20 sec for hot plate, 30 seconds for tail flick, 70% for oxygen saturation and 75 breaths per minute for breath rate measures. (C) Therapeutic windows were calculated by dividing the ED50 values for the respiratory measures (%O2, arterial oxygen saturation or BR, breath rate) by the ED50 values for the antinociception measures (HP, hot plate or TF, tail flick) presented in SFig4 and Table 2. To show comparison to morphine, the values for morphine were then subtracted from each compound (morphine therapeutic window = 0). See also: Figure S4 for dose response curves for all the compounds in both the antinociceptive and respiratory assays, as well as single dose in MOR-KO mice and in female mice; Table S4 for the number of mice used in each study; and Table 3 for the calculated ED50 values and therapeutic windows.
Figure 4
Figure 4. Bias factors positively correlate with therapeutic window
(A) The bias factors determined in the hMOR cell lines (GTPγS binding in CHO-hMOR membranes (left) or inhibition of forskolin-stimulated cAMP accumulation in the CHO-hMOR cells (right), versus βarrestin2 recruitment in the U2OS-βarrestin-hMOR-PathHunter EFC assay) when plotted against the therapeutic windows calculated from the in vivo studies (O2 ED50: % arterial oxygen saturation over HP ED50: hot plate antinociception) produce linear correlations: GTPγS/βarr2: R2= 0.9589; cAMP/βarr2: R2= 0.9525. (B) Correlation analysis of compounds that display bias towards βarrestin2 from (A) (i.e., fentanyl and SR-11501) with morphine when plotted against the therapeutic window (HP/O2) produce reveals a strong correlation when GTPγS/βarr2 bias factors (R2=0.99) are plotted, but not with cAMP/βarr2 bias factors (R2=0.4140). See also: Table S5 for the correlation analysis between bias factor and therapeutic window for the other bias factors calculated for the compounds (CHO-mMOR and brainstem) and the therapeutic windows for the other behavioral measures (breath rate and tail flick).

Comment in

References

    1. Ananthan S, Saini SK, Dersch CM, Xu H, McGlinchey N, Giuvelis D, Bilsky EJ, Rothman RB. 14-Alkoxy- and 14-acyloxypyridomorphinans: mu agonist/delta antagonist opioid analgesics with diminished tolerance and dependence side effects. J Med Chem. 2012;55:8350–8363. - PMC - PubMed
    1. Black JW, Leff P. Operational models of pharmacological agonism. Proc R Soc Lond B Biol Sci. 1983;220:141–162. - PubMed
    1. Bohn LM, Gainetdinov RR, Lin FT, Lefkowitz RJ, Caron MG. Mu-opioid receptor desensitization by beta-arrestin-2 determines morphine tolerance but not dependence. Nature. 2000;408:720–723. - PubMed
    1. Bohn LM, Lefkowitz RJ, Gainetdinov RR, Peppel K, Caron MG, Lin FT. Enhanced morphine analgesia in mice lacking beta-arrestin 2. Science. 1999;286:2495–2498. - PubMed
    1. Brust TF, Morgenweck J, Kim SA, Rose JH, Locke JL, Schmid CL, Zhou L, Stahl EL, Cameron MD, Scarry SM, et al. Biased agonists of the kappa opioid receptor suppress pain and itch without causing sedation or dysphoria. Sci Signal. 2016;9:ra117. - PMC - PubMed

MeSH terms