. 2017 Nov 16;171(5):1191-1205.e28.
doi: 10.1016/j.cell.2017.10.017.

Chronic Stress Alters Striosome-Circuit Dynamics, Leading to Aberrant Decision-Making

Affiliations

Chronic Stress Alters Striosome-Circuit Dynamics, Leading to Aberrant Decision-Making

Alexander Friedman et al. Cell. .

Abstract

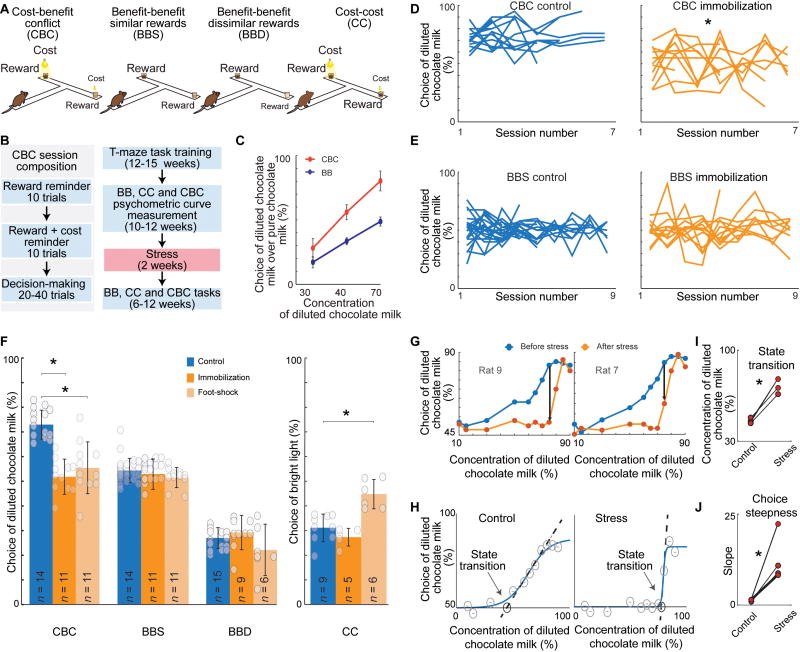
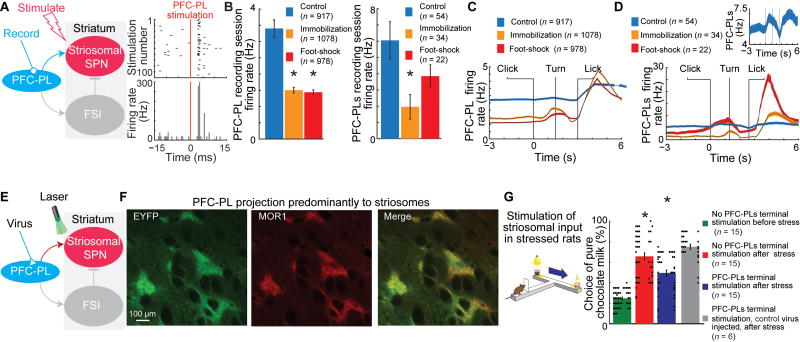
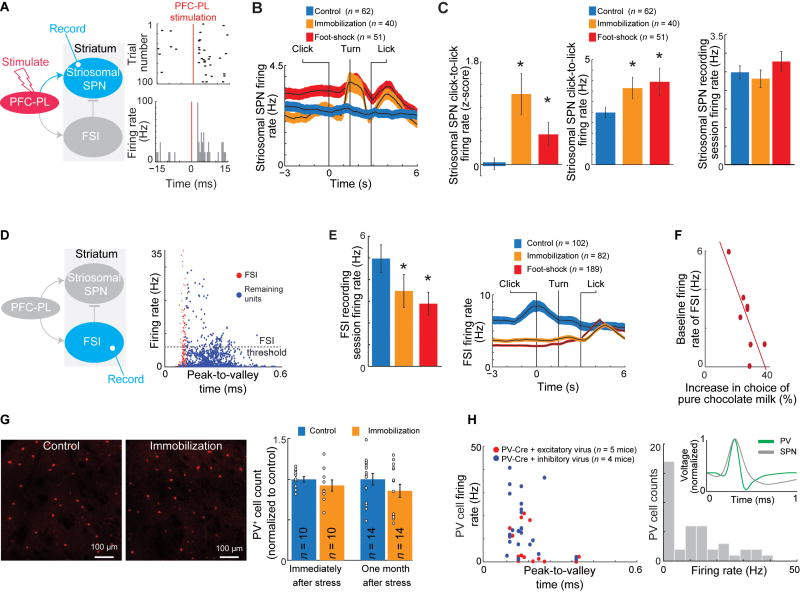
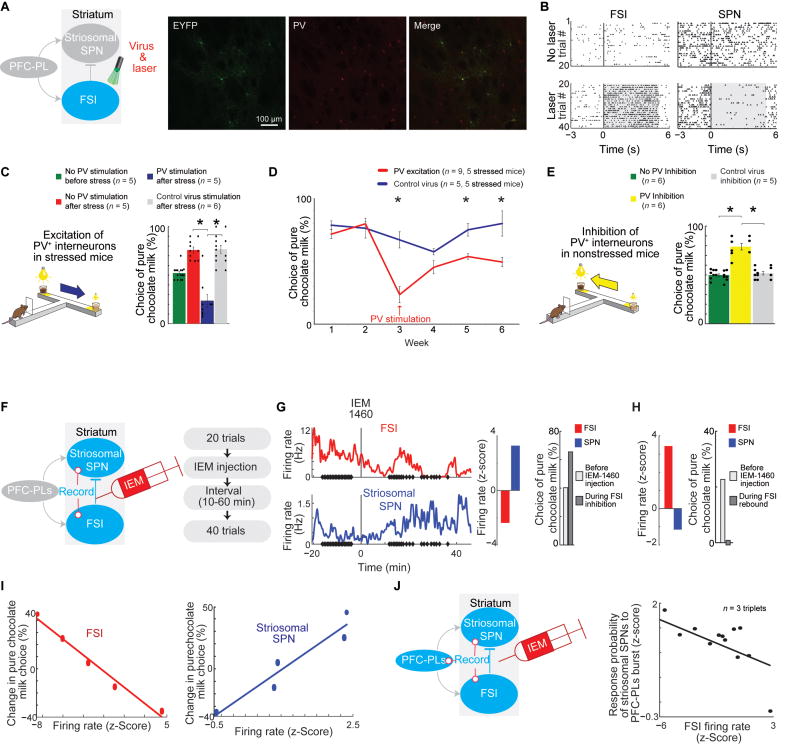
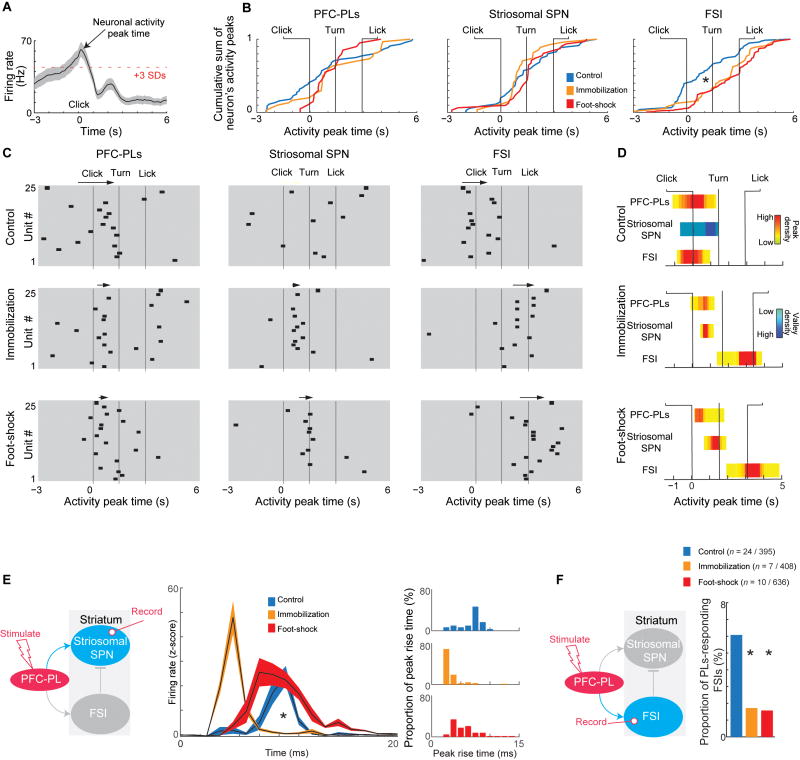
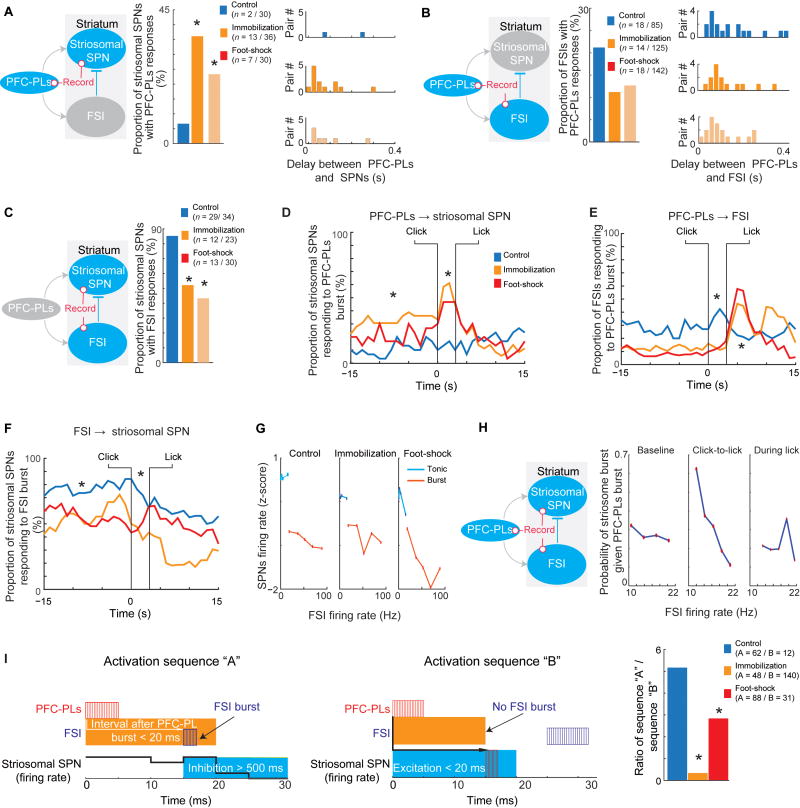
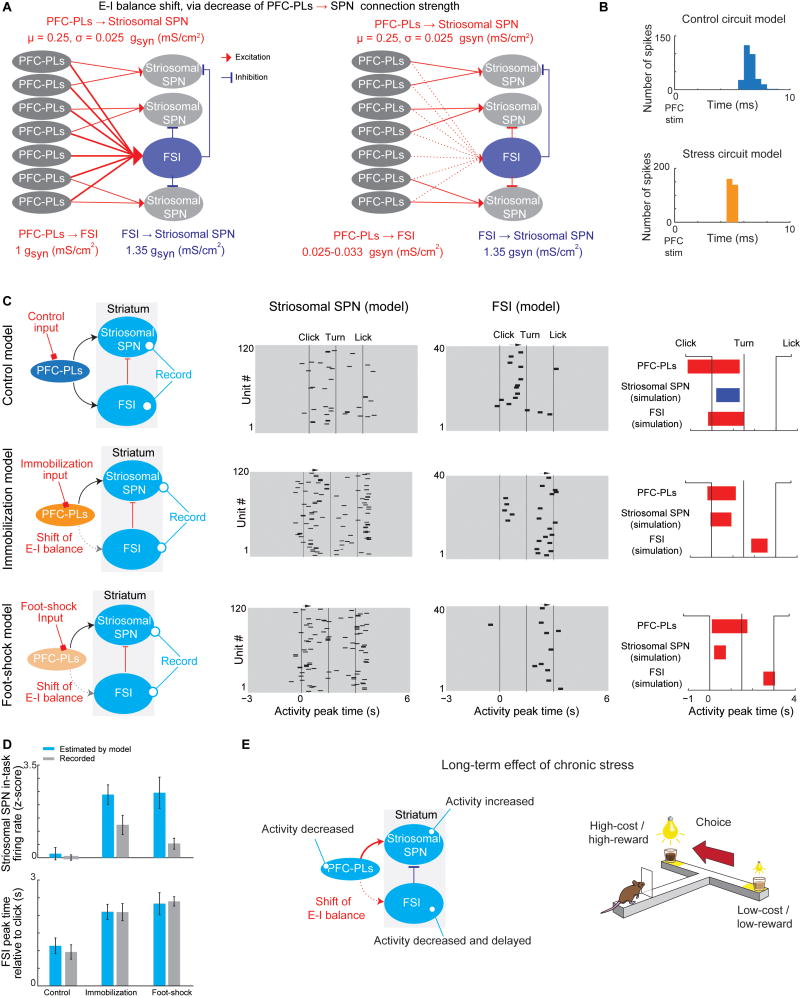
Effective evaluation of costs and benefits is a core survival capacity that in humans is considered as optimal, "rational" decision-making. This capacity is vulnerable in neuropsychiatric disorders and in the aftermath of chronic stress, in which aberrant choices and high-risk behaviors occur. We report that chronic stress exposure in rodents produces abnormal evaluation of costs and benefits resembling non-optimal decision-making in which choices of high-cost/high-reward options are sharply increased. Concomitantly, alterations in the task-related spike activity of medial prefrontal neurons correspond with increased activity of their striosome-predominant striatal projection neuron targets and with decreased and delayed striatal fast-firing interneuron activity. These effects of chronic stress on prefronto-striatal circuit dynamics could be blocked or be mimicked by selective optogenetic manipulation of these circuits. We suggest that altered excitation-inhibition dynamics of striosome-based circuit function could be an underlying mechanism by which chronic stress contributes to disorders characterized by aberrant decision-making under conflict. VIDEO ABSTRACT.

Keywords: basal ganglia; cost-benefit; excitation-inhibition balance; fast-spiking interneurons; optogenetics; parvalbumin-positive interneurons; prefrontal cortex; prelimbic cortex; striatum.


Figures

Figure 1
Figure 1. Chronic Stress Selectively Affects CBC Decision-Making
(A) The four decision-making tasks. (B) Single session diagram (left) and experimental timeline (right). For immobilization stress, rats and mice were immobilized, respectively, for 4 and 1 hr/day. For foot-shock stress, rats received 50 shocks, each lasting 3 s, over 1 hr. Both stress protocols were repeated on 14 consecutive days. (C) Mean (± SD) psychometric function for a single rat performing CBC and BB tasks. See also Figures S1A and S1B. (D and E) Performance in CBC (D) and BBS (E) tasks by individual control (left) and immobilization stressed (right) rats over 6–12 weeks. *p < 0.001 (CBC control vs. CBC immobilization, ANOVA repeated measures with Bonferroni correction). Intervals between two consecutive sessions were 1–2 weeks. See also Figure S1C. (F) Decision-making by control and stressed rats performing the 4 tasks. Mean was calculated for each rat (dots), then mean and SD were calculated for each group. *p < 0.001 (one-way ANOVA with Bonferroni correction). See also Figure S1D. (G) Psychometric functions of two rats for CBC task before (blue) and after (orange) stress. See also Figures S1G and S1H. (H) Single rat’s psychometric function before (left) and after (right) chronic stress, modeled using a four-parameter sigmoid. The concentration of diluted milk was varied across sessions (circles), and a logistic curve was fitted to the data. Arrows show the onset of linear cost-benefit integration. The dashed lines show the linear trend of the choice behavior. (I and J) Stress delayed the onset (I) and increased the slopes (J) of linear cost-benefit integration. *p < 0.05 (paired t-test).
Figure 2
Figure 2. Effect of Chronic Stress and Optogenetic Manipulation of the PFC-PLs
(A) Antidromic stimulation to identify PFC-PL neurons that project to the striatum (PFC-PLs neurons, left), and raster plot (top) and histogram (bottom) for an identified PFC-PLs neuron (right). (B) PFC-PL (left) and PFC-PLs (right) firing rates in control and stressed rats. *p < 0.01 (Kolmogorov–Smirnov test and t-test). Error bars, SEM. (C and D) PFC-PL (C) and PFC-PLs (D) activity in stressed and control rats during CBC task. Inset, magnified activity of control group. (E) Manipulating PFC-PLs terminals in dorsomedial striatum. (F) PFC-PL corticostriatal projections virally labeled with enhanced yellow fluorescent protein (EYFP, green), striosomes immunostained for mu-opioid receptor 1 (MOR1, red), and a merged image (yellow). In targeted dorsomedial striatal region, the EYFP signal intensity was 4.71 ± 0.68 fold higher in MOR1+ striosomes than in matrix. (G) Optogenetic excitation of PFC-PLs terminals normalizes CBC choice of stressed rats. Dots show choice in each session. *p < 0.001 (one-way ANOVA with Bonferroni correction).
Figure 3
Figure 3. Striatal Activity after Chronic Stress
(A) Orthodromic stimulation to identify striosomes (left) and an identified striosomal SPN (right). (B) Mean (± SEM) firing rates of striosomal SPNs during CBC task. (C) Stress significantly increased normalized (left) and raw (middle) firing rates of striosomal SPNs during click-to-lick period, but not over full recording session (right) *p < 0.01 (Kolmogorov–Smirnov test and t-test). (D) FSI recording (left) and classification (right). (E) FSI activity during the entire session (left) and click-to-turn period (right). *p < 0.01 (Kolmogorov–Smirnov test and t-test). (F) FSI firing rates were inversely correlated with increases in choice of pure chocolate milk in CBC task (p < 0.01, Pearson correlation). (G) PV-immunostained striatal sections from control and stressed (immobilization) mice (left), and numbers of PV+ neurons (right). (H) Peak-to-valley times (left) and firing rate distribution (right) of optogenetically identified PV+ neurons. Inset, spike waveforms.
Figure 4
Figure 4. Causal Relationship between PV+ Neuron Activity and Stress
(A) Optogenetic manipulation experiment (left), and, from left to right, virus-expressing (green, EYFP) and PV+ (red) neurons in PV-Cre mice, and merged image (yellow). (B) A PV+ neuron (left) and SPN (right) recorded during 20 CBC trials without (top) and with (bottom) optogenetic PV excitation (shading). (C) Optogenetic excitation of PV+ neurons in stressed mice reverses the effects of stress. *p < 0.001 (one-way ANOVA with Bonferroni correction). Error bars, SEM. (D) Long-term effect of optogenetic PV excitation in stressed mice (p < 0.001, repeated measures ANOVA with Bonferroni correction). *p < 0.001 (post hoc Tukey’s). (E) Optogenetic inhibition of PV+ neurons in non-stressed mice mimics the stress effects. *p < 0.001 (one-way ANOVA with Bonferroni correction). (F) Intrastriatal IEM-1460 injections to test the causal relationship between FSI and striosomal SPN activity. (G) IEM-1460 injection reduced FSI activity (top) and increased striosomal SPN activity (bottom). Dots show trial start. Z-score quantification of the firing rate changes (middle). Choice of pure chocolate milk (right). (H) FSI activity rebound and striosomal SPN activity reduction (left), and choice of pure chocolate milk (right) about 40–120 min after IEM-1460 injection. (I) FSI (left) and striosomal SPN (right) firing rates after IEM-1460 injection correlated with choice of pure chocolate milk (p < 0.01, Pearson correlation test). (J) Simultaneous recordings of a PFC-PL, FSI and striosomal SPN after IEM-1460 injection (left), and probability that PFC-PLs bursts evoke striosomal SPN bursts, given FSI firing rates (right, p < 0.01, Pearson correlation test).
Figure 5
Figure 5. Stress Effect on Corticostriatal Circuit Dynamics
(A) Activity peak (> 3 SDs) identified for each neuron. (B) Cumulative sum of activity peak times. FSI activity peaks were significantly delayed after stress. *p < 0.001 (Kolmogorov–Smirnov test). See also Figure S5B. (C) Dynamics of PFC-PL-striosomal circuit components. Individual neurons are shown horizontally. Black squares, activity peak time. Arrows, high-activity periods (see Figure S5C). See also Figures S5E and S5G. (D) Relative activity (high: yellow to red; low: blue) of PFC-PLs neurons, striosomal SPNs and FSIs measured by concentration of maxima or minima across time windows. See also Figure S5C. (E) Recording of striosomal SPN and FSI responses to PFC-PL microstimulation (left), striosomal SPN responses (middle) and earlier striosomal peak times in stressed animals (right). See also Figures S5J and S5K. *p < 0.001 (Kolmogorov–Smirnov test and t-test). Shading, SEM. See also Figures S5J and S5K. (F) Stress significantly reduces the number of FSIs that respond to PFC-PL stimulation. *p < 0.01 (chi-square test).
Figure 6
Figure 6. Stress Effect on the Relationships between PFC-PLs neurons, FSIs and Striosomal SPNs
(A) Simultaneous recording of PFC-PLs neuron and striosomal SPN to measure delays between PFC-PLs and striosomal bursts (left), proportion of PFC-PLs-striosomal interacting pairs (middle) and delays between striosomal SPN and PFC-PLs bursts (right). *p < 0.01 (chi-square test). (B) Simultaneously recorded PFC-PLs neuron and FSI, shown as in A. (C) Simultaneous recording of striosomal SPNs and FSI (left), and proportion of FSI-striosomal SPN interacting pairs (right). *p < 0.01 (chi-square test). (D–F) Stress increased interaction (see Figures S6C–S6E) between PFC-PLs and striosomal SPN bursting during the baseline and click-to-lick periods (D), but decreased interaction between PFC-PLs neurons and FSIs during the baseline and click-to-turn periods, with an increase during the licking period (E). Striosomal SPN inhibition by FSIs was smaller after stress (F). *p < 0.05 (Kolmogorov–Smirnov and chi-square tests). (G) Burst FSI activity inhibited striosomal SPNs more than tonic FSI activity (p < 0.001, bootstrap vs. shuffled time recordings) in both control and stressed rats (p = 0.1). (H) Triplets of PFC-PLs neuron, striosomal SPN, and FSI simultaneously recorded in a control rat. Probability of striosomal burst given PFC-PLs burst depended on FSI firing rate only during the click-to-lick period (p < 0.01, Pearson correlation test). (I) Two firing sequences identified by Granger causality in triplets recorded in control and stressed rats performing CBC task. In sequence A, an FSI burst succeeded a PFC-PLs burst by <20 ms, reducing striosomal activity for >500 ms, ending with a striosomal burst, suggesting feed-forward inhibition (left). In sequence B, a PLC-PLs burst was succeeded by a striosomal burst by <20 ms, leading to an FSI burst, suggesting an absence of feed-forward inhibition (middle). Stress reduced feed-forward inhibition (the ratio of sequences A to B, right). *p <0.001 (chi-square test).
Figure 7
Figure 7. Modeling the Stress Effect on E–I Balance of the Cortico-Striosomal Circuit
(A) The cortico-striosomal E–I balance modeled by the Hodgkin-Huxley method. Seven PFC-PLs neurons excite an FSI and 3 striosomal SPNs, and the FSI inhibits the striosomal SPNs (left). After stress, the FSI and PFC-PLs neurons have weaker connection, causing a shift in E–I balance (right). (B) Connectivity values between circuit elements were calibrated so that synchronous input to PFC-PLs would cause an SPN to spike with a delay observed in PFC-PL microstimulation experiment (see Figure 5E). (C) Model successfully reproduces the dynamics of the PFC-PLs-striosomal pathway components, as shown in Figures 5B and 5C. (D) Model reproduced the increased striosomal response (top) and FSI activity peak times (bottom) after stress (mean ± SEM). (E) Summary of major findings.

Comment in

References

    1. Amat J, Baratta MV, Paul E, Bland ST, Watkins LR, Maier SF. Medial prefrontal cortex determines how stressor controllability affects behavior and dorsal raphe nucleus. Nat Neurosci. 2005;8:365–371. - PubMed
    1. Amemori K, Graybiel AM. Localized microstimulation of primate pregenual cingulate cortex induces negative decision-making. Nat Neurosci. 2012;15:776–785. - PMC - PubMed
    1. Ampuero E, Luarte A, Santibanez M, Varas-Godoy M, Toledo J, Diaz-Veliz G, Cavada G, Rubio FJ, Wyneken U. Two chronic stress models based on movement restriction in rats respond selectively to antidepressant drugs: Aldolase c as a cotential biomarker. Int J Neuropsychopharmacol. 2015;8:pyv038. - PMC - PubMed
    1. Arnsten AF. Stress weakens prefrontal networks: molecular insults to higher cognition. Nat Neurosci. 2015;18:1376–1385. - PMC - PubMed
    1. Aupperle RL, Paulus MP. Neural systems underlying approach and avoidance in anxiety disorders. Dialogues Clin Neurosci. 2010;12:517–531. - PMC - PubMed

LinkOut - more resources