. 2018 Feb:62:130-145.
doi: 10.1016/j.neurobiolaging.2017.10.009. Epub 2017 Nov 14.

Prostaglandin J2 promotes O-GlcNAcylation raising APP processing by α- and β-secretases: relevance to Alzheimer's disease

Affiliations

Prostaglandin J2 promotes O-GlcNAcylation raising APP processing by α- and β-secretases: relevance to Alzheimer's disease

Teneka Jean-Louis et al. Neurobiol Aging. 2018 Feb.

Abstract

Regulation of the amyloid precursor protein (APP) processing by α- and β-secretases is of special interest to Alzheimer's disease (AD), as these proteases prevent or mediate amyloid beta formation, respectively. Neuroinflammation is also implicated in AD. Our data demonstrate that the endogenous mediator of inflammation prostaglandin J2 (PGJ2) promotes full-length APP (FL-APP) processing by α- and β-secretases. The decrease in FL-APP was independent of proteasomal, lysosomal, calpain, caspase, and γ-secretase activities. Moreover, PGJ2-treatment promoted cleavage of secreted APP, specifically sAPPα and sAPPβ, generated by α and β-secretase, respectively. Notably, PGJ2-treatment induced caspase-dependent cleavage of sAPPβ. Mechanistically, PGJ2-treatment selectively diminished mature (O- and N-glycosylated) but not immature (N-glycosylated only) FL-APP. PGJ2-treatment also increased the overall levels of protein O-GlcNAcylation, which occurs within the nucleocytoplasmic compartment. It is known that APP undergoes O-GlcNAcylation and that the latter protects proteins from proteasomal degradation. Our results suggest that by increasing protein O-GlcNAcylation levels, PGJ2 renders mature APP less prone to proteasomal degradation, thus shunting APP toward processing by α- and β-secretases.

Keywords: APP; Apoptosis; O-GlcNAcylation; Prostaglandin J2; Secretases.


Conflict of interest statement

Disclosure Statement: The authors declare no conflicts of interest.

Figures

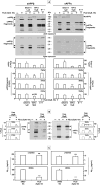
FIGURE 1
FIGURE 1. PGJ2-treatment diminishes APP levels more effectively than PGD2 or PGE2, but does not alter APP mRNA levels in rat cerebral cortical neurons
Neurons were treated as follows: (A and B) for 24h with DMSO (vehicle, control), PGJ2 (J2, 10μM), CAY10410 (10μM, CAY, a PGJ2 analog), PGD2 (D2, 15μM and 30μM) or PGE2 (E2, 75μM); (C and D) with10 μM PGJ2 for different times; (E – G) with increasing concentrations of PGJ2 for 16h. In (A, C and E), total neuronal lysates were analyzed by western blotting (30μg of protein/lane) probed with the respective antibodies to detect full length (FL) APP (22C11 antibody) and β-tubulin (loading control). Molecular mass markers in kDa are shown on the right (A) or in the center (C and E). APP levels were semi-quantified by densitometry. Data in graphs A, C, and E represent pixel ratio values for each treatment condition, expressed as percent control (100%, DMSO treatment). The pixel ratio value for each condition, was obtained by dividing pixel numbers for mature (top or middle) or immature (bottom) FL-APP bands by the pixel numbers for the β-tubulin band (loading control). In graphs B, D, and F, cell viability for each treatment condition is expressed as percent control (100%, DMSO treatment). Neuronal viability was assessed with the MTT assay. Data in graph G represent (left) pixel ratio values, or (right) Ct ratio values for each treatment condition, expressed as percent control (100%, DMSO treatment). The pixel ratio value for each condition, was obtained by dividing pixel numbers for the APP mRNA band by the pixel numbers for the GAPDH mRNA band (control). The Ct ratio value for each condition, was obtained by dividing the Ct value for the APP mRNA by the Ct value for the GAPDH mRNA (control). In (G), total RNA isolated from the neurons was analyzed by Endpoint (left, 2% agarose gel) and quantitative (right) RT-PCR. Values shown in all graphs (A – G) are means ± s.d. (standard deviation) from two independent experiments (A), and ± s.e. (standard error) from two (6 determinations, B), four (C and E), at least three (D and F), and three (G) independent experiments per group. FL-APP, full length APP695; N, N-glycosylated; O, O-glycosylated. Asterisks identify the values that are significantly different from the control (* p<0.05; ** p<0.01; *** p<0.001); ns, no significant difference from control.
FIGURE 2
FIGURE 2. The decline in mature APP levels induced by PGJ2 is independent of proteasomal, lysosomal, caspase and calpain-mediated degradation in rat cerebral cortical neurons
Neurons were treated with DMSO (vehicle, control) or PGJ2 (10 μM) alone or in combination with Epoxomicin (5 nM, Epox, proteasome inhibitor), calpeptin (20 μM, Cpt, calpain inhibitor), pan caspase inhibitor (20 μM, Casp), and chloroquine (10 μM, CQ, lysosomal inhibitor). For comparison, neurons were also treated with each inhibitor alone. Total neuronal lysates were analyzed by western blotting (30μg of protein/lane) probed with the respective antibodies to detect in (A) full length APP (FL-APP, 22C11 antibody) and β-tubulin (loading control), and in (B) full length APP and its C-terminal fragment (FL-APP, 110kDa, APP-CTF, 15kDa, with the anti-CTF antibody) and actin (loading control). Molecular mass markers in kDa are shown in the center (A) and on the right (B). In (A) APP levels were semi-quantified by densitometry. Data in graphs represent the percentage of the pixel ratio for each of the three APP forms corresponding to mature (top and middle bands) and immature (bottom band) APP over β-tubulin for each condition compared to control (100%). Values are means ± s.e. from three independent experiments. Asterisks identify the values that are significantly different from PGJ2-treatment alone (** p<0.01; *** p<0.001). FL-APP, full length APP695; N, N-glycosylated; O, O-glycosylated; ns, non-significant.
FIGURE 3
FIGURE 3. The decline in mature APP levels induced by PGJ2 is mimicked by treatment with a β-secretase inhibitor but not by α or γ-secretase inhibitors in rat cerebral cortical neurons
In (A and B) neurons were treated with DMSO (vehicle, control) or PGJ2 (10 μM) alone or in combination with β-secretase inhibitor 2 (1 μM, BACE1-2), α-secretase inhibitor (10 μM, TAPI-2), or γ-secretase inhibitor (0.5 μM, GSI). For comparison, neurons were also treated with each inhibitor alone. Total neuronal lysates were analyzed by western blotting (30μg of protein/lane) probed with the respective antibodies to detect in (A) full length APP (FL-APP, 22C11 antibody) and β-tubulin (loading control), and in (B) full length APP and its C-terminal fragment (FL-APP, 110kDa, APP-CTF, 15kDa, with the anti-CTF antibody) and actin (loading control). (C) - Neurons were treated with DMSO or 10 μM PGJ2 for different times (left), or with increasing concentrations of PGJ2 (16 h, right). Total neuronal lysates were analyzed by western blotting (30μg of protein/lane) probed with an antibody to detect β-secretase (BACE1) and actin (loading control). In (A) APP levels were semi-quantified by densitometry. Data in graphs (A) represent the percentage of the pixel ratio for each of the three APP forms corresponding to mature (top and middle bands) and immature (bottom band) APP over β-tubulin for each condition compared to control (100%). Data in graphs (C) represent the percentage of the pixel ratio for BACE1 over actin for each condition compared to control (100%). Values are means ± s.e. from three independent experiments. Asterisks in (A) identify the values that are significantly different from the PGJ2-treatment alone, (** p<0.01; *** p<0.001). Both schemes represent membrane-bound FL-APP with its E1, E2 and Aβ domains, and its N- and O-linked glycans. In addition, the right scheme depicts the APP cleavage sites of the canonical (α, β, γ) secretase pathway, while the left scheme shows the APP products generated by cleavage via the canonical secretase pathway. FL-APP, full length APP695; N, N-glycosylated; O, O-glycosylated; BACE1, β-secretase; CTF, C-terminal fragment; ns, non-significant.
FIGURE 4
FIGURE 4. PGJ2-treatment does not mimic inhibition of N or O-Glycosylation in the ER or Golgi, but increases the levels of O-GlcNAcylated proteins in rat cerebral cortical neurons
Neurons were treated as follows: (A) with DMSO (vehicle, control) or PGJ2 (10 μM) alone or in combination with tunicamycin (2 μM, Tunic, N-glycosylation inhibitor), or brefeldin A (15 μM, Bref. A, ER to Golgi protein transport inhibitor). For comparison, neurons were also treated with each drug alone. In (B) with DMSO (vehicle, control) or PGJ2 (10 μM), and the resulting neuronal lysates (30μg) were then treated with DMSO or with an O-deglycosylation mix containing neuroaminidase and O-glycosidase. In (C) with increasing concentrations of PGJ2 for 16h. In (D) with DMSO (vehicle, control), PGJ2 (10 μM), β-secretase inhibitor 2 (1 μM, BACE1-2), epoxomicin (5 nM, Epox, proteasome inhibitor), calpeptin (20 μM, Cpt, calpain inhibitor), or chloroquine (10 μM, CQ, lysosomal inhibitor) alone. Total neuronal lysates were analyzed by western blotting (30μg of protein/lane) probed with the respective antibodies to detect in: (A and B) full length APP (FL-APP, 22C11 antibody) and β-tubulin (loading control). In (C and D) O-GlcNAc and actin (loading control). Molecular mass markers in kDa are shown at the right. In (A and B) APP levels, and in (C and D) O-GlcNAcylated protein levels, were semi-quantified by densitometry. For (A and B), data in graphs represent the percentage of the pixel ratio for each of the three APP forms corresponding to mature (top and middle bands) and immature (bottom band) APP (unglycosylated APP also in A) over β-tubulin for each condition compared to control (100%). Values are means ± s.e. from four (A) and three (B) independent experiments. For (C and D) data in graphs represent the percentage of the pixel ratio for the levels of O-GlcNAcylated proteins (O-GlcNac/actin) over actin for each condition compared to control (100%). Values are means ± s.e. from four (C) and three (D) independent experiments. Asterisks identify the values that are significantly different from the control, (* p<0.05; ** p<0.01; *** p<0.001). FL-APP, full length APP695; N, N-glycosylated; O, O-glycosylated; O-GlcNAc, O-linked β-N-acetylglucosamine; unglyc., unglycosylated APP; ns, non-significant.
FIGURE 5
FIGURE 5. PGJ2-treatment decreases APP levels in the ER and Golgi, disrupts APP trafficking, and induces neurite dystrophy in rat cerebral cortical neurons
Neurons were treated with DMSO (vehicle, control) or PGJ2 (10 μM) for 16h followed by immunofluorescence analyses as described under materials and methods to detect APP (22C11 and Cell Signaling antibodies), TGN38 (Golgi marker), calreticulin (ER maker), and β-tubulin (marker for neuronal processes). Merged images are shown in the right panels in (A) through (C). (D) shows magnified images of the areas delineated by white boxes in (C). Arrows in (D) point to bulb-like structures within dystrophic neurites. Similar results were obtained in duplicate (A) and triplicate (B) experiments (A, DMSO, N = 47 cells; PGJ2, N = 42 cells) and (B, DMSO, N = 69 cells; PGJ2, N = 61 cells). Immunofluorescence was quantified in each image field using Image J as explained under materials and methods. Values (co-localization threshold area, amount of overlapping pixels between the green and red channels) indicate means and s.e. from images pooled over two or three independent experiments for each group, and normalized to time-matched DMSO (vehicle) control. Asterisks identify values that are significantly different from control (* p< 0.05; ** p< 0.01).
FIGURE 6
FIGURE 6. PGJ2-treatment increases the levels of sAPPα and sAPPβ fragments, including caspase-dependent sAPP (α and β) fragments, in human neuroblastoma SY5Y cells overexpressing APP695 (APP-SY5Y)
In (A) cells were treated with DMSO (vehicle, control, 16h) or PGJ2 (25 μM, 16h) alone or in combination with β-secretase inhibitor 4 (1 μM, BACE1-4) or α-secretase inhibitor (15 μM, TAPI-2). In (B) cells were treated with DMSO (vehicle, control, 16h) or PGJ2 (25 μM, 16h) alone or in combination with the pan caspase inhibitor (20 μM, Casp). For comparison, cells in (A) and (B) were also treated with each inhibitor alone. Conditioned media obtained as described under materials and methods, were analyzed by western blotting (20μg of protein/lane) probed with the respective antibodies to detect on the left sAPPβ and on the right sAPPα, and their fragments. Molecular mass markers in kDa are shown in the middle. sAPP levels were semi-quantified by densitometry. Data in graphs represent the percentage of the pixel ratio for sAPPβ or sAPPα and their fragments (marked by white asterisks), for each condition compared to control (100%). Values are means ± s.e. from three (A) and two (B) independent experiments. In (C) cells were treated with DMSO (vehicle, control, 16h) or PGJ2 (25μM, 16h) alone. Cell lysates (4μg protein/sample for Aβ1–40 and 10μg protein/sample for Aβ1–42), and conditioned media (50μl from 20-fold concentrated samples) as described under materials and methods were analyzed by ELISA to assess the levels of Aβ1–40 (left) and Aβ1–42 (right). Values (pg of the respective Aβ peptide/ml of lysate or media) are means ± s.e. from four independent experiments. Asterisks identify the values that are significantly different from control, (* p< 0.05; ** p< 0.01, *** p<0.001). sAPPβ and sAPPα, secreted (soluble) forms of APP generated by β and α-secretases, respectively; ns, non-significant.
Figure 7
Figure 7. Scheme depicting the effects of PGJ2 (black arrows) on FL-APP processing
Under control conditions (white arrows), full length APP (FL-APP) can be processed via various pathways that include secretases, the ubiquitin/proteasome pathway (UPP), cathepsins (lysosomes), calpains, and others. The secretase pathway, includes FL-APP processing by canonical (α, β, γ) secretases to generate secreted (soluble) APP (sAPPα and sAPPβ), Aβ, and C-terminal fragments (CTFs). The non-canonical secretase pathway involves FL-APP processing by non-canonical (δ, η) secretases and meprin β to generate different forms of secreted (soluble) APP and C-terminal fragments (CTFs) that are not shown. Our data suggest that upon PGJ2-treatment, which induces protein O-GlcNAcylated, a fraction of FL-APP processing (black arrows) is shunted from proteasomal (UPP) degradation (shorter black arrow) to the canonical α and β-secretases (longer black arrow) to give rise to higher levels of sAPPα and sAPPβ. The latter are further cleaved, in most cases by caspases, to generate fragments (thinner arrows) that potentially bind to death receptors (DRs) and induce apoptosis ( formula image). PGJ2-treatment did not alter the intracellular levels of Aβ, while it decreased the levels of secreted Aβ. The scheme depicts the complexity of APP metabolism, rendering it difficult to analyze stoichiometrically. For simplicity, the CTF fragments are not shown under PGJ2-treatment. O-GlcNAc, O-linked β-N-acetylglucosamine.

Similar articles

Cited by

References

    1. Aoki T, Narumiya S. Prostaglandins and chronic inflammation. Trends Pharmacol Sci. 2012;33:304–311. - PubMed
    1. Arnaud LT, Myeku N, Figueiredo-Pereira ME. Proteasome-caspase-cathepsin sequence leading to tau pathology induced by prostaglandin J2 in neuronal cells. J Neurochem. 2009;110:328–342. - PMC - PubMed
    1. Bateman RJ, Xiong C, Benzinger TL, Fagan AM, Goate A, Fox NC, Marcus DS, Cairns NJ, Xie X, Blazey TM, Holtzman DM, Santacruz A, Buckles V, Oliver A, Moulder K, Aisen PS, Ghetti B, Klunk WE, McDade E, Martins RN, Masters CL, Mayeux R, Ringman JM, Rossor MN, Schofield PR, Sperling RA, Salloway S, Morris JC. Clinical and biomarker changes in dominantly inherited Alzheimer’s disease. N Engl J Med. 2012;367:795–804. - PMC - PubMed
    1. Benzing WC, Mufson EJ, Armstrong DM. Alzheimer’s disease-like dystrophic neurites characteristically associated with senile plaques are not found within other neurodegenerative diseases unless amyloid beta-protein deposition is present. Brain Res. 1993;606:10–18. - PubMed
    1. Berridge MV, Tan AS. Characterization of the cellular reduction of 3-(4,5-dimethylthiazol-2-yl)-2,5-diphenyltetrazolium bromide (MTT): subcellular localization, substrate dependence, and involvement of mitochondrial electron transport in MTT reduction. Arch Biochem Biophys. 1993;303:474–482. - PubMed

Publication types

MeSH terms

Substances