Review
. 2017 Nov 17;21(1):279.
doi: 10.1186/s13054-017-1866-z.

Pearls and pitfalls in comprehensive critical care echocardiography

Affiliations
Review

Pearls and pitfalls in comprehensive critical care echocardiography

Sam Orde et al. Crit Care. .

Abstract

Critical care echocardiography is developing rapidly with an increasing number of specialists now performing comprehensive studies using Doppler and other advanced techniques. However, this imaging can be challenging, interpretation is far from simple in the complex critically ill patient and mistakes can be easy to make. We aim to address clinically relevant areas where potential errors may occur and suggest methods to hopefully improve accuracy of imaging and interpretation.

Keywords: Advanced; Critical care; Doppler; Echocardiography; Intensive care.


Conflict of interest statement

Consent for publication

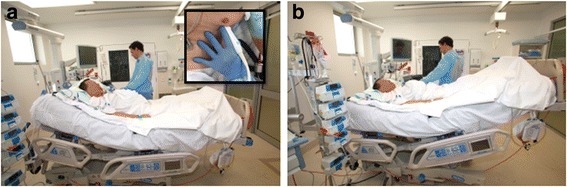
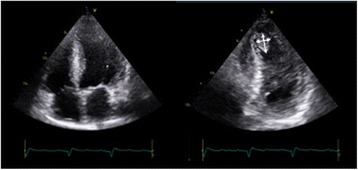
Written informed consent was obtained from the patient for publication of their individual details and accompanying images (the photograph shown in Fig. 4) in this manuscript. The consent form is held by the authors and is available for review by the Editor-in-Chief.

Competing interests

The authors declare that they have no competing interests.

Publisher’s Note

Springer Nature remains neutral with regard to jurisdictional claims in published maps and institutional affiliations.

Figures

Fig. 1
Fig. 1
Accurate stroke volume (SV) estimation: SV = LVOTarea × LVOTVTI. a Accurate SV assessment = [0.785 × 2.1 cm2] × 27.2 cm = 94 ml. LVOTarea estimation: use of zoomed in parasternal long-axis view of the aortic valve with LVOT diameter measured at mid-systole at the site of aortic valve cusp entry along with accurate Doppler settings for LVOT VTI assessment using high sweep speed, low wall filters and reduced gain for modal velocity estimation (brightest portion of spectral tracing) as well as seeing the aortic valve closing click. b Inaccurate SV assessment = [0.785 × 2.4 cm2] × 32.7 cm = 148 ml. Potential pitfalls leading to inaccurate SV estimation include mistakes in 2D image acquisition as well as Doppler pitfalls: estimating LVOTarea from non-zoomed aortic valve analysis, foreshortened or oblique plane of LVOT interrogation in 2D mode and LVOT spectral Doppler VTI assessment with the sample volume in a wrong position or being too large, with too high gain or too high wall filter settings, low sweep speed and baseline inappropriately low. Note overestimation or underestimation of SV assessment with inappropriate measures
Fig. 2
Fig. 2
Consideration of stroke volume in valvular lesion severity assessment. In a hyperdynamic state trans-valvular gradients are commonly elevated, as in this example where aortic valve flows could indicate moderate stenosis if considered in isolation. A raised stroke volume and LVOTVTI can help identify falsely elevated flows. In aortic stenosis the VTI ratio between the LVOT and aortic valve can also be of use (Dimensionless Severity Index)
Fig. 3
Fig. 3
Upstream and downstream flow assessment in moderate or severe valvular lesions. a Systolic flow blunting in a pulmonary vein from severe mitral valve regurgitation (upstream). b Systolic flow reversal in the hepatic vein from severe tricuspid regurgitation (upstream). c Diastolic flow reversal in the descending aorta from severe aortic regurgitation (downstream)
Fig. 4
Fig. 4
How to perform a passive leg raise correctly: move the patient and the bed from a semi-recumbent position with the head at 30–45° (a) to a supine position with the legs raised by 30–45° (b) and not by manually raising the patient’s legs alone. NB: ensure that the torso of the patient is horizontal. a Inset: Pearl = anchor your imaging hand on the patients torso to ensure efficient imaging and the same pulsed Doppler gate position and angle of Doppler interrogation
Fig. 5
Fig. 5
Additional information provided by Doppler flow pattern analysis. a Flying ‘W’ sign with pulsed wave Doppler analysis of right ventricle outflow tract: a highly specific sign of pulmonary hypertension. b L-wave on mitral valve inflow: seen in relatively bradycardic patients with normal hearts or in a pathological setting in those with elevated left ventricle preload and moderate diastolic dysfunction
Fig. 6
Fig. 6
Left ventricular cavity obstruction. Obstruction of the left ventricular cavity can be due to anatomical factors and/or precipitated by LV cavity obstruction from hypovolaemia, excessive inotropic agents, predisposing anatomical abnormalities, etc., a systolic anterior motion of theanteiror mitral valve leafelet is frequently seen, often with resulting mitral regurgitation. Accurate imaging to determine location of the obstruction is required. b Continuous wave Doppler can identify an obstruction through recognition of the classic ‘dagger’ shaped curve with its peak in late systole. c Pulsed wave Doppler can identify the point of restriction by sequentially moving the gate from the left ventricle outflow tract to the apex looking for the point of maximal flow (note that aliasing is frequently seen where the maximum gradient is too high for the pulsed wave Doppler scale)
Fig. 7
Fig. 7
Utility of using non-standard imaging windows. Apical right ventricle-centric views (probe positioned more medially than standard apical view): enables better Doppler angle for tricuspid regurgitation assessment
Fig. 8
Fig. 8
Imaging the apex: off-axis imaging. Standard apical views can miss an anteriorly placed thrombus. If there is a degree of suspicion (e.g. akinetic apical segments), off-axis imaging (i.e. tilting imaging plane or imaging more medially) can be used to identify an apical thrombus (indicated by arrows)

Similar articles

Cited by

References

    1. Pulido JN, Afessa B, Masaki M, Yuasa T, Gillespie S, Herasevich V, et al. Clinical spectrum, frequency, and significance of myocardial dysfunction in severe sepsis and septic shock. JMCP. 2012;87:620–8. - PMC - PubMed
    1. Orde S, McLean A. Bedside myocardial perfusion assessment with contrast echocardiography. Crit Care. 2016;20:58. doi: 10.1186/s13054-016-1215-7. - DOI - PMC - PubMed
    1. Vieillard-Baron A, Schmitt JM, Augarde R, Fellahi JL, Prin S, Page B, et al. Acute cor pulmonale in acute respiratory distress syndrome submitted to protective ventilation: incidence, clinical implications, and prognosis. Crit Care Med. 2001;29:1551–5. doi: 10.1097/00003246-200108000-00009. - DOI - PubMed
    1. Vieillard-Baron A. Assessment of right ventricular function. Curr Opin Crit Care. 2009;15:254–60. doi: 10.1097/MCC.0b013e32832b70c9. - DOI - PubMed
    1. Quiñones MA, Otto CM, Stoddard M, Waggoner A, Zoghbi WA. Doppler quantification task force of the nomenclature and standards committee of the American society of echocardiography. Recommendations for quantification of Doppler echocardiography: a report from the Doppler quantification task force of the nomenclature and standards committee of the American society of echocardiography. JASE. 2002;15(2):167–84. - PubMed