

Nations within a nation: variations in epidemiological transition across the states of India, 1990-2016 in the Global Burden of Disease Study
- PMID: 29150201
- PMCID: PMC5720596
- DOI: 10.1016/S0140-6736(17)32804-0
Nations within a nation: variations in epidemiological transition across the states of India, 1990-2016 in the Global Burden of Disease Study
Erratum in
-
Department of Error.Lancet. 2017 Dec 2;390(10111):e49. doi: 10.1016/S0140-6736(17)33053-2. Epub 2017 Dec 1. Lancet. 2017. PMID: 29208307 Free PMC article. No abstract available.
Abstract
Background: 18% of the world's population lives in India, and many states of India have populations similar to those of large countries. Action to effectively improve population health in India requires availability of reliable and comprehensive state-level estimates of disease burden and risk factors over time. Such comprehensive estimates have not been available so far for all major diseases and risk factors. Thus, we aimed to estimate the disease burden and risk factors in every state of India as part of the Global Burden of Disease (GBD) Study 2016.
Methods: Using all available data sources, the India State-Level Disease Burden Initiative estimated burden (metrics were deaths, disability-adjusted life-years [DALYs], prevalence, incidence, and life expectancy) from 333 disease conditions and injuries and 84 risk factors for each state of India from 1990 to 2016 as part of GBD 2016. We divided the states of India into four epidemiological transition level (ETL) groups on the basis of the ratio of DALYs from communicable, maternal, neonatal, and nutritional diseases (CMNNDs) to those from non-communicable diseases (NCDs) and injuries combined in 2016. We assessed variations in the burden of diseases and risk factors between ETL state groups and between states to inform a more specific health-system response in the states and for India as a whole.
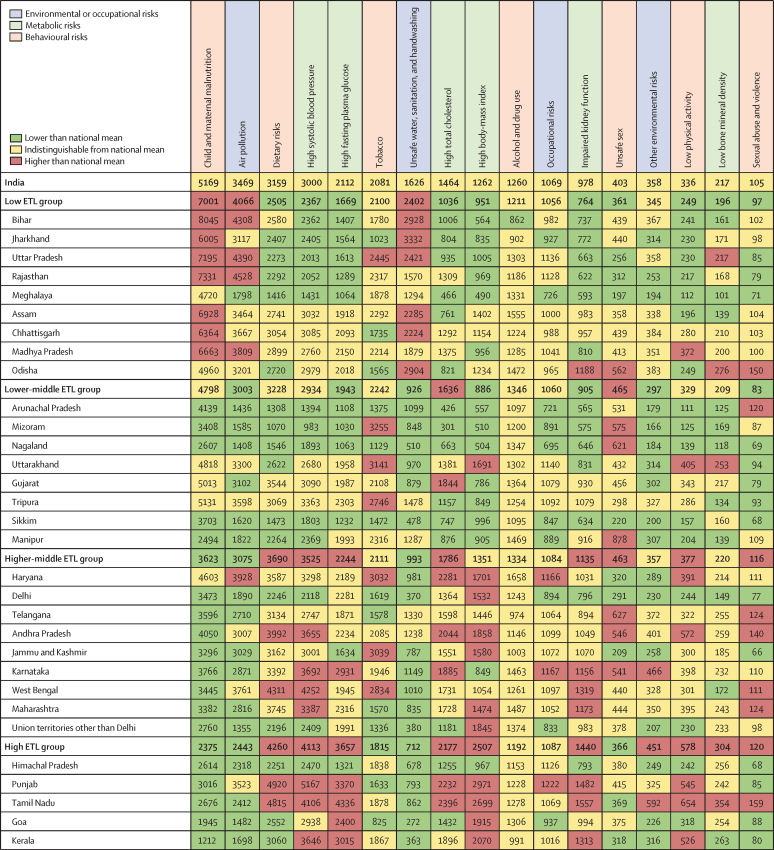
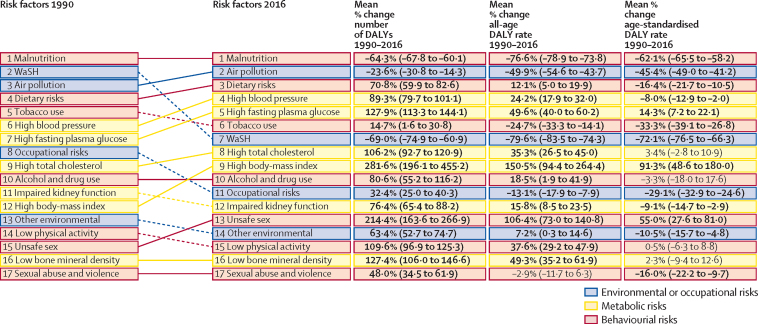
Findings: DALYs due to NCDs and injuries exceeded those due to CMNNDs in 2003 for India, but this transition had a range of 24 years for the four ETL state groups. The age-standardised DALY rate dropped by 36·2% in India from 1990 to 2016. The numbers of DALYs and DALY rates dropped substantially for most CMNNDs between 1990 and 2016 across all ETL groups, but rates of reduction for CMNNDs were slowest in the low ETL state group. By contrast, numbers of DALYs increased substantially for NCDs in all ETL state groups, and increased significantly for injuries in all ETL state groups except the highest. The all-age prevalence of most leading NCDs increased substantially in India from 1990 to 2016, and a modest decrease was recorded in the age-standardised NCD DALY rates. The major risk factors for NCDs, including high systolic blood pressure, high fasting plasma glucose, high total cholesterol, and high body-mass index, increased from 1990 to 2016, with generally higher levels in higher ETL states; ambient air pollution also increased and was highest in the low ETL group. The incidence rate of the leading causes of injuries also increased from 1990 to 2016. The five leading individual causes of DALYs in India in 2016 were ischaemic heart disease, chronic obstructive pulmonary disease, diarrhoeal diseases, lower respiratory infections, and cerebrovascular disease; and the five leading risk factors for DALYs in 2016 were child and maternal malnutrition, air pollution, dietary risks, high systolic blood pressure, and high fasting plasma glucose. Behind these broad trends many variations existed between the ETL state groups and between states within the ETL groups. Of the ten leading causes of disease burden in India in 2016, five causes had at least a five-times difference between the highest and lowest state-specific DALY rates for individual causes.
Interpretation: Per capita disease burden measured as DALY rate has dropped by about a third in India over the past 26 years. However, the magnitude and causes of disease burden and the risk factors vary greatly between the states. The change to dominance of NCDs and injuries over CMNNDs occurred about a quarter century apart in the four ETL state groups. Nevertheless, the burden of some of the leading CMNNDs continues to be very high, especially in the lowest ETL states. This comprehensive mapping of inequalities in disease burden and its causes across the states of India can be a crucial input for more specific health planning for each state as is envisioned by the Government of India's premier think tank, the National Institution for Transforming India, and the National Health Policy 2017.
Funding: Bill & Melinda Gates Foundation; Indian Council of Medical Research, Department of Health Research, Ministry of Health and Family Welfare, Government of India; and World Bank.
Copyright © 2017 The Author(s). Published by Elsevier Ltd. This is an Open Access article under the CC BY 4·0 license. Published by Elsevier Ltd.. All rights reserved.
Figures


References
-
- Population of India 2017 IndiaOnlinePages. http://www.indiaonlinepages.com/population/india-current-population.html (accessed Sept 1, 2017).
-
- United Nations Department of Economic and Social Affairs. Population Division . United Nations; New York: 2017. World population prospects: the 2017 revision, key findings and advance tables. ESA/P/WP/248.https://esa.un.org/unpd/wpp/Publications/Files/WPP2017_KeyFindings.pdf (accessed Sept 1, 2017).
-
- Bose ML. 2nd edn. Concept Publishing Company; New Delhi: 1998. Social and cultural history of ancient India.
-
- International Monetary Fund World economic outlook update. July 2017. http://www.imf.org/en/Publications/WEO/Issues/2017/07/07/world-economic-... (accessed Sept 1, 2017).
-
- John TJ, Dandona L, Sharma VP, Kakkar M. Continuing challenge of infectious diseases in India. Lancet. 2011;377:252–269. - PubMed
MeSH terms
LinkOut - more resources
Full Text Sources
Other Literature Sources
Miscellaneous
