. 2017 Nov 21;47(5):913-927.e6.
doi: 10.1016/j.immuni.2017.10.006. Epub 2017 Nov 14.

Tissue-Resident Macrophages Are Locally Programmed for Silent Clearance of Apoptotic Cells

Affiliations

Tissue-Resident Macrophages Are Locally Programmed for Silent Clearance of Apoptotic Cells

Allison W Roberts et al. Immunity. .

Abstract

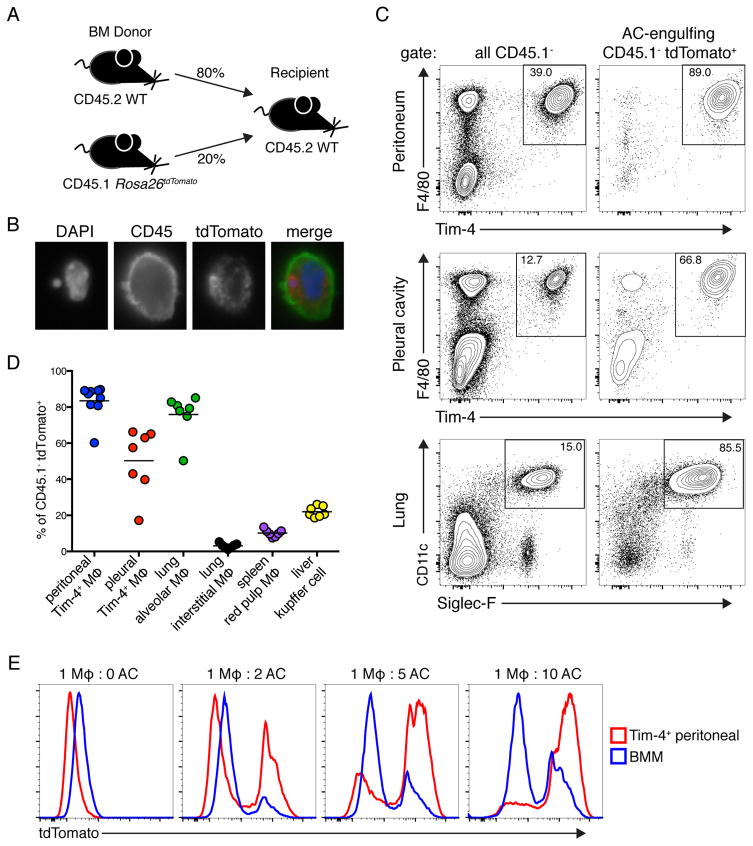
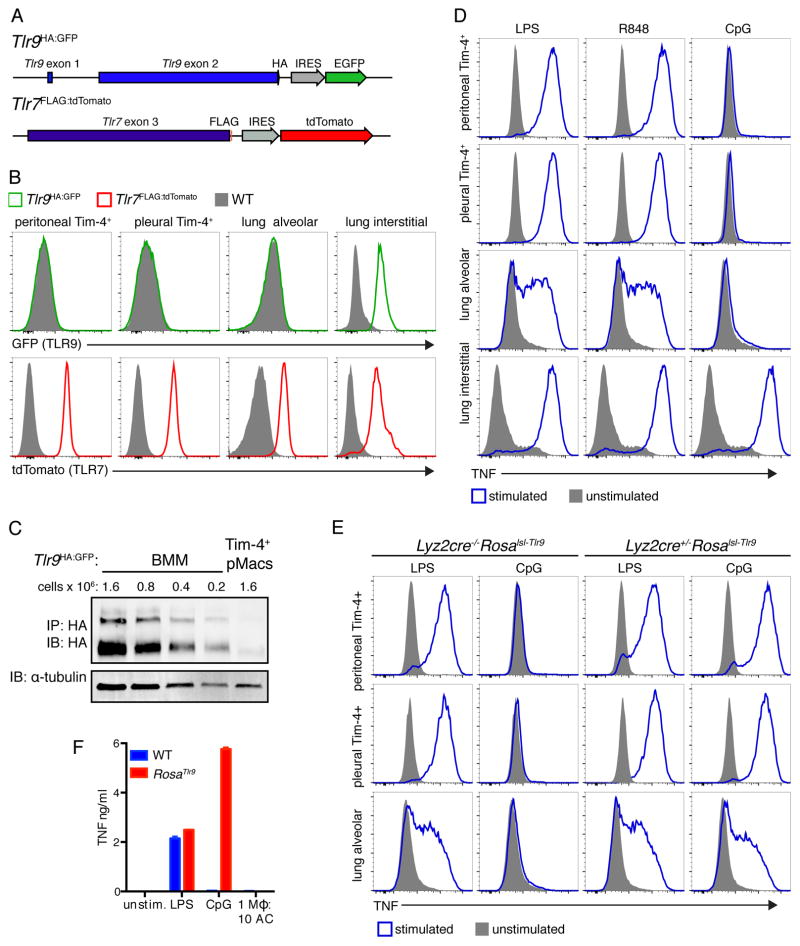
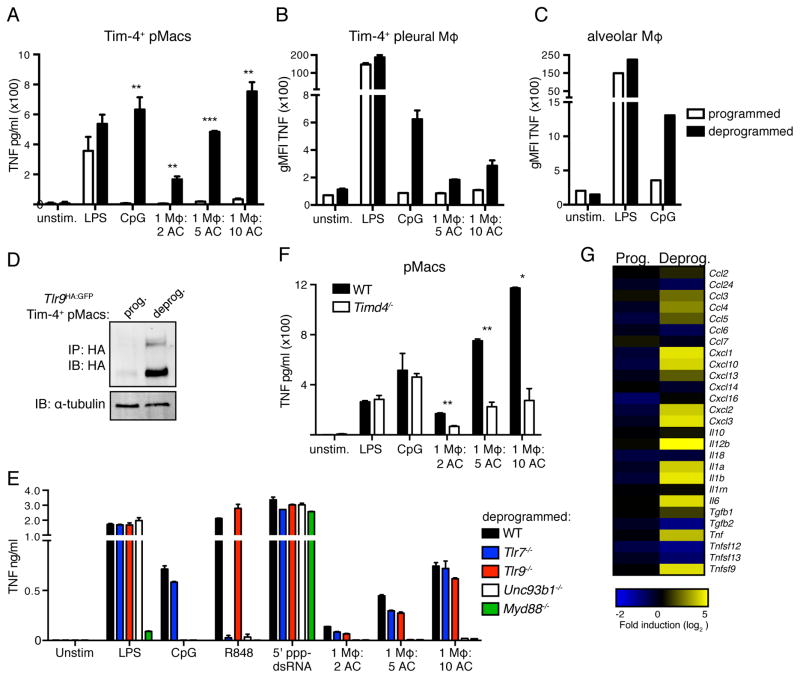
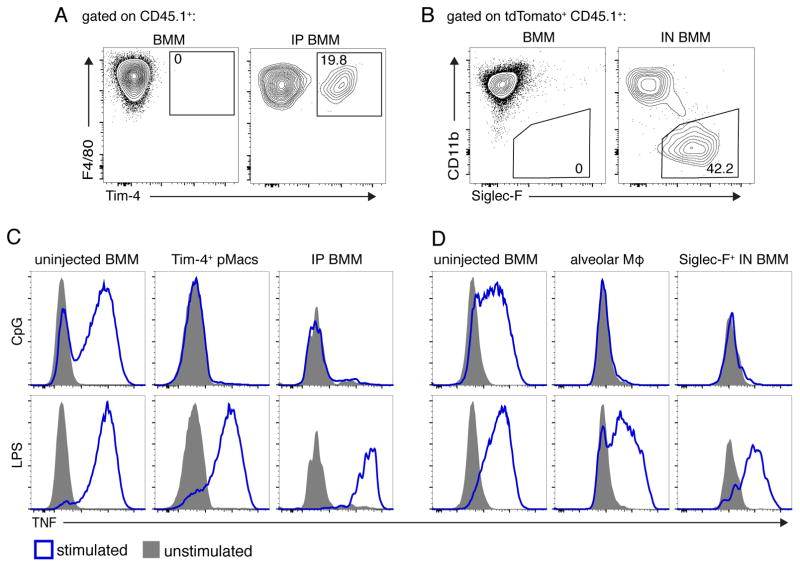
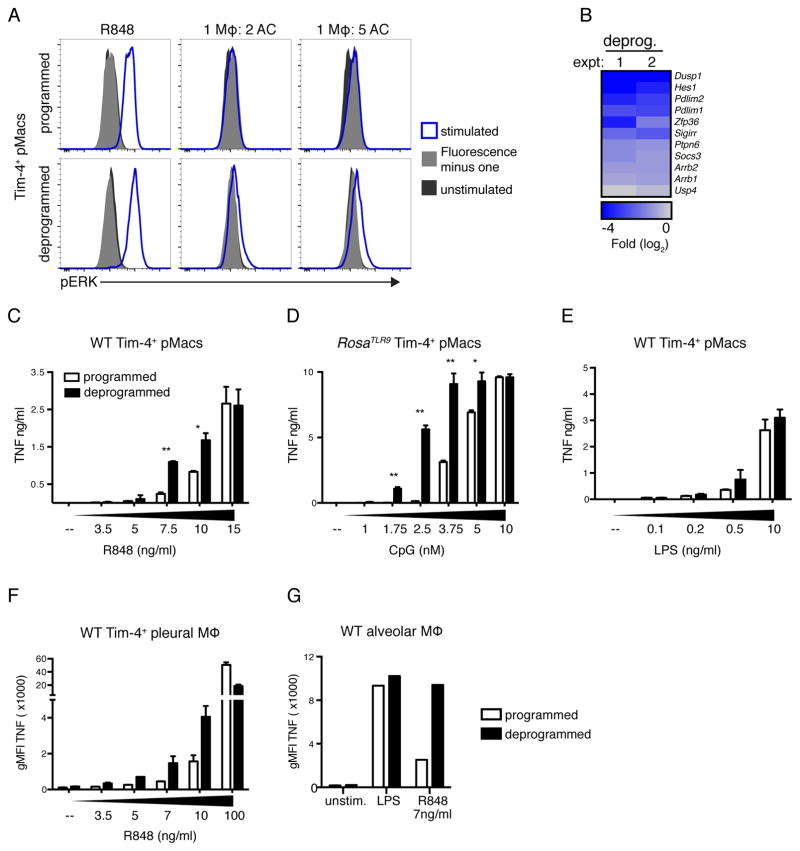
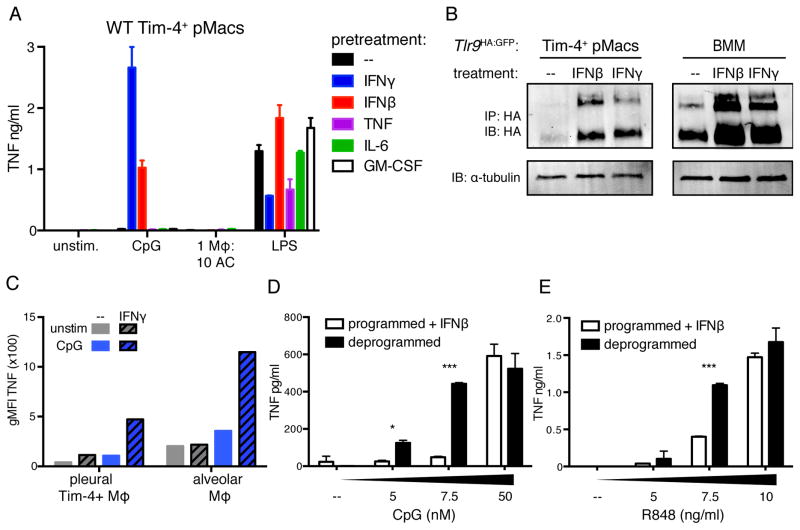
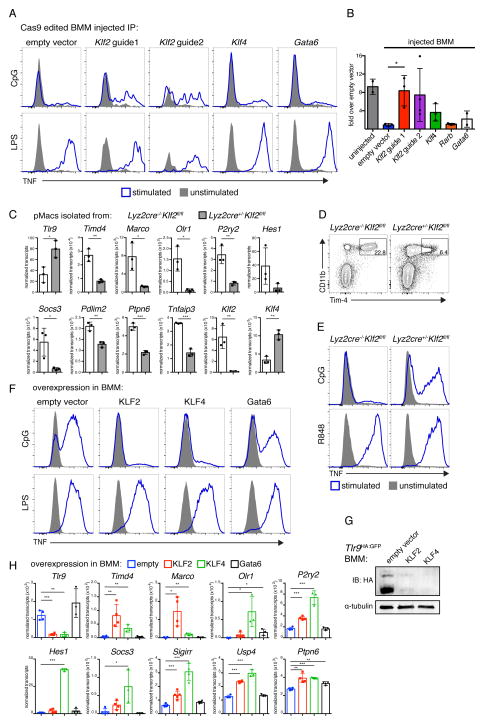
Although apoptotic cells (ACs) contain nucleic acids that can be recognized by Toll-like receptors (TLRs), engulfment of ACs does not initiate inflammation in healthy organisms. Here we identified macrophage populations that continually engulf ACs in distinct tissues and found that these macrophages share characteristics compatible with immunologically silent clearance of ACs; such characteristics include high expression of AC recognition receptors, low expression of TLR9, and reduced TLR responsiveness to nucleic acids. Removal of the macrophages from tissues resulted in loss of many of these characteristics and the ability to generate inflammatory responses to AC-derived nucleic acids, suggesting that cues from the tissue microenvironment program macrophages for silent AC clearance. The transcription factors KLF2 and KLF4 control the expression of many genes within this AC clearance program. The coordinated expression of AC receptors with genes that limit responses to nucleic acids might ensure maintenance of homeostasis and thus represent a central feature of tissue macrophages.

Keywords: KLF2; KLF4; Toll-like receptors; apoptotic cell clearance; autoinflammation; macrophage.


Figures

Figure 1
Figure 1. Identification of tissue resident macrophage populations that clear apoptotic cells in vivo
(A) Diagram of bone marrow chimeras used to identify AC-engulfing cells at steady state. (B) Representative immunofluorescence image of AC-engulfing cells isolated from chimeras. Cells were stained with DAPI and antibody against CD45. (C) Representative flow cytometric analyses of tissues from bone marrow chimeras. Cells were gated on CD45.1 cells or AC-engulfing cells (CD45.1 tdTomato+), as indicated. (D) Quantification of AC engulfment by the indicated macrophage populations in tissues. (E) CD45.2+ Tim-4+ pMacs and CD45.2+ BMMs were incubated with CD45.1+ tdTomato+ ACs at indicated ratios and analyzed by flow cytometry. All data are representative of at least three independent experiments. See also Figure S1.
Figure 2
Figure 2. AC-engulfing macrophages do not express TLR9
(A) Diagram of reporter mice generated to examine TLR expression. (B) Representative histograms of fluorescent protein expression by gated macrophages harvested from Tlr9HA:GFP, Tlr7FLAG:tdTomato, or WT mice. Peritoneal and pleural Tim-4+ macrophages are live F4/80+Tim-4+ cells. Alveolar macrophages are live SiglecF+CD11c+CD64+CD11b cells. Lung interstitial macrophages are live CD11b+F4/80+MHCII+ cells. (C) Cell lysates from Tim-4+ pMacs and BMMs from Tlr9HA:GFP mice were immunoprecipitated with anti-HA resin and eluted protein was analyzed by anti-HA western. The two bands represent ER localized TLR9 (larger band) and endosomal cleaved TLR9 (smaller band). An anti-tubulin immunoblot was performed on lysates. (D) TNF production by macrophages from WT mice stimulated ex vivo with TLR ligands. (E) TNF production by macrophages from Lyz2cre+/−Rosalsl-Tlr or littermate control Lyz2cre−/−Rosalsl-Tlr9 mice stimulated ex vivo with the indicated TLR ligands (F). TNF production by RosaTlr9 Tim-4+ pMacs stimulated with TLR ligands or ACs. All data are representative of at least three independent experiments. See also Figure S2.
Figure 3
Figure 3. AC-engulfing macrophages removed from their tissue environment generate inflammatory responses to ACs
(A) TNF production by Tim-4+ pMacs cultured overnight (programmed) or for 60h (deprogrammed) before stimulation with TLR ligands or ACs. Data are representative of at least three independent experiments. (B) TNF production by programmed or deprogrammed pleural cells from WT mice stimulated with TLR ligands or ACs. Data are representative of at least three independent experiments. (C) TNF production by programmed or deprogrammed lung cells from WT mice stimulated with TLR ligands. Data are representative of at least three independent experiments. (D) Lysates from programmed and deprogrammed Tlr9HA:GFP Tim-4+ pMacs were immunoprecipitated with anti-HA resin and eluted protein was analyzed by anti-HA western. An anti-tubulin immunoblot was performed on lysates. Data are representative of three independent experiments (E) TNF production by deprogrammed Tim-4+ pMacs from WT, Tlr7−/−, Tlr9−/−,Unc93b1−/−, or Myd88−/− mice stimulated with TLR ligands, RIG-I ligand, or ACs. Data are representative of at least two independent experiments. (F) TNF production by deprogrammed pMacs from WT or Timd4−/− mice stimulated with TLR ligands and ACs. Data are representative of two independent experiments. (G) RNA sequencing analysis of programmed and deprogrammed Tim-4+ pMacs stimulated with ACs. Data are presented as fold stimulated over unstimulated and are results from one experiment with technical duplicates averaged so only one value is shown. See also Figure S3 and S4.
Figure 4
Figure 4. BMMs gain AC-clearance programming in tissue environments
(A) Flow cytometric analyses of uninjected CD45.1+ WT BMMs (left) or BMMs transferred into the peritoneum for three weeks (right). (B) Flow cytometric analyses of uninjected CD45.1+ tdTomato+ cells (left) or BMMs transferred intranasally (IN) and analyzed after 39d (right). (C) TNF production by BMMs transferred as described in (A), harvested, and stimulated with TLR ligands. (D) TNF production by BMMs transferred as described in (B), harvested, and stimulated with TLR ligands. SiglecF+ cells are gated as shown in panel B. All data are representative of three independent experiments. See also Figure S4.
Figure 5
Figure 5. Programmed macrophages have a higher activation threshold for TLR7 and TLR9 responses
(A) Tim-4+ pMacs were stimulated with R848 or ACs for 30min, and phospho-ERK1/2 signal was measured by flow cytometry. Data are representative of three independent experiments. (B) Negative regulators of TLR signaling that are significantly (p < 0.05) reduced in deprogrammed Tim-4+ pMacs relative to programmed Tim-4+ pMacs as measured by RNA sequencing. Results of two independent experiments are shown with replicates averaged. (C–E) TNF production by programmed and deprogrammed Tim-4+ pMacs stimulated with increasing doses of TLR ligands. Data are representative of at least three independent experiments. (D) To compare CpG responses, Tim-4+ pMacs were isolated from RosaTlr9 mice. (F and G) Pleural (F) or lung (G) cells from WT mice were harvested and incubated overnight or for 60h before stimulation. Data are representative of two independent experiments. See also Figure S5.
Figure 6
Figure 6. Inflammatory cues induce TLR9 expression in AC-engulfing macrophages
(A) TNF production by Tim-4+ pMacs treated overnight with the indicated cytokines before stimulation with TLR ligands or ACs. Data are representative of at least three independent experiments. (B) Tim-4+ pMacs and BMMs from Tlr9HA:GFP mice were cultured overnight ± IFNγ or IFNβ, and TLR9 levels in lysates were measured by anti-HA immunoprecipitation and immunoblot. An anti-tubulin immunoblot was performed on lysates. Wells of Tim-4+ pMacs correspond to lysate of 1.6e6 cell equivalents, and wells of BMMs correspond to lysate of 0.4e6 cell equivalents. Data are representative of at least three independent experiments. (C) TNF production by lung and pleural cells harvested from WT mice and incubated overnight ± 100ng/ml IFNγ before stimulation with CpG ODN. Data are representative of two independent experiments. (D–E) TNF production by programmed Tim-4+ pMacs incubated overnight with IFNβ or by untreated deprogrammed Tim-4+ pMacs stimulated with increasing doses of CpG (D) or R848 (E). Data are representative of three independent experiments. See also Figure S6.
Figure 7
Figure 7. KLF2 and KLF4 imprint an AC-clearance program on macrophages
(A and B) BMMs from Cas9 expressing mice were transduced with vectors encoding guide RNAs targeting the indicated transcription factors and injected IP into congenically marked mice. 14d after injection peritoneal cells were harvested and stimulated with TLR ligands. Uninjected BMMs transduced with empty vector were stimulated as a control. (B) Quantification of IP injected BMMs responses to CpG displayed relative to injected empty vector response. Data are the combined results from two independent experiments with n = 2–4 per group. (C) F4/80+ pMacs were isolated from Lyz2cre+/−Klf2fl/fl mice and littermate control Lyz2cre−/−Klf2fl/fl mice. Levels of mRNA were quantified using a Nanostring nCounter. n = 3 per group from independent experiments. (D and E) Peritoneal cells from Lyz2cre+/−Klf2fl/fl mice and littermate control Lyz2cre−/−Klf2fl/fl mice were harvested and (D) analyzed by flow cytometry for expression of the indicated markers or (E) stimulated with TLR ligands. Data are representative of three independent experiments. (F) TNF production by WT BMMs transduced with retroviral vectors encoding KLF2, KLF4, Gata6 or with empty vector and stimulated with the indicated TLR ligands. Data are representative of at least two independent experiments. (G) Tlr9HA:GFP BMMs were transduced with retroviral vectors encoding KLF2, KLF4, or empty vector. Lysates were subjected to immunoprecipitation with anti-HA resin and eluted TLR9 protein was visualized by anti-HA immunoblot. An anti-tubulin immunoblot was performed on lysates. Data are representative of at least two independent experiments. (H) WT BMMs were transduced with retroviral vectors encoding KLF2, KLF4, Gata6, or with empty vector. Levels of mRNA were quantified using a Nanostring nCounter. n = 3–4 per group from independent experiments. See also Figure S7.

References

    1. A-Gonzalez N, Bensinger SJ, Hong C, Beceiro S, Bradley MN, Zelcer N, Deniz J, Ramirez C, Diaz M, Gallardo G, et al. Apoptotic cells promote their own clearance and immune tolerance through activation of the nuclear receptor LXR. Immunity. 2009;31:245–258. - PMC - PubMed
    1. Asano K, Miwa M, Miwa K, Hanayama R, Nagase H, Nagata S, Tanaka M. Masking of phosphatidylserine inhibits apoptotic cell engulfment and induces autoantibody production in mice. J Exp Med. 2004;200:459–467. - PMC - PubMed
    1. Baratin M, Simon L, Jorquera A, Ghigo C, Dembele D, Nowak J, Gentek R, Wienert S, Klauschen F, Malissen B, et al. T Cell Zone Resident Macrophages Silently Dispose of Apoptotic Cells in the Lymph Node. Immunity. 2017;47:349–362. e5. - PubMed
    1. Barbalat R, Ewald SE, Mouchess ML, Barton GM. Nucleic acid recognition by the innate immune system. Annu Rev Immunol. 2011;29:185–214. - PubMed
    1. Barrat FJ, Elkon KB, Fitzgerald KA. Importance of Nucleic Acid Recognition in Inflammation and Autoimmunity. Annu Rev Med. 2016;67:323–336. - PubMed