

The IKK-related kinase TBK1 activates mTORC1 directly in response to growth factors and innate immune agonists
- PMID: 29150432
- PMCID: PMC5753041
- DOI: 10.15252/embj.201696164
The IKK-related kinase TBK1 activates mTORC1 directly in response to growth factors and innate immune agonists
Abstract
The innate immune kinase TBK1 initiates inflammatory responses to combat infectious pathogens by driving production of type I interferons. TBK1 also controls metabolic processes and promotes oncogene-induced cell proliferation and survival. Here, we demonstrate that TBK1 activates mTOR complex 1 (mTORC1) directly. In cultured cells, TBK1 associates with and activates mTORC1 through site-specific mTOR phosphorylation (on S2159) in response to certain growth factor receptors (i.e., EGF-receptor but not insulin receptor) and pathogen recognition receptors (PRRs) (i.e., TLR3; TLR4), revealing a stimulus-selective role for TBK1 in mTORC1 regulation. By studying cultured macrophages and those isolated from genome edited mTOR S2159A knock-in mice, we show that mTOR S2159 phosphorylation promotes mTORC1 signaling, IRF3 nuclear translocation, and IFN-β production. These data demonstrate a direct mechanistic link between TBK1 and mTORC1 function as well as physiologic significance of the TBK1-mTORC1 axis in control of innate immune function. These data unveil TBK1 as a direct mTORC1 activator and suggest unanticipated roles for mTORC1 downstream of TBK1 in control of innate immunity, tumorigenesis, and disorders linked to chronic inflammation.
Keywords: IFN‐β; TBK1; mTOR; mTORC1.
© 2017 The Authors.
Figures
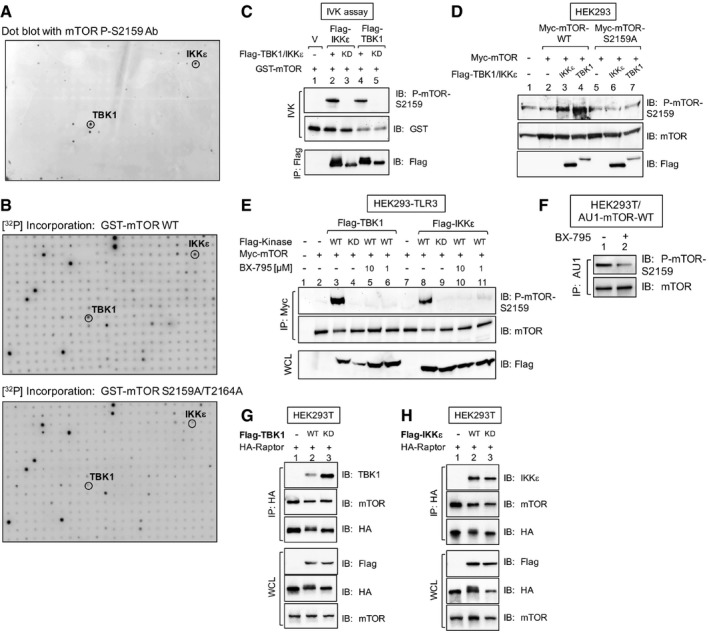
- A
In vitro kinome screen with recombinant GST‐mTOR substrate and ˜300 recombinant active kinases. Substrate phosphorylation was detected with mTOR P‐S2159 antibodies.
- B
Similar to (A), except that GST‐mTOR wild type (WT) or GST‐mTOR S2159A/T2164A (AA) was used as substrate, and [γ‐32P]‐ATP was included in the reactions. [32P] incorporation was detected by autoradiography.
- C
TBK1 and IKKε immune complex in vitro kinase (IVK) assays. Flag‐TBK1 or Flag‐IKKε WT (+) or kinase dead (KD) was immunoprecipitated from transfected HEK293 cells and incubated with GST‐mTOR substrate. IVK reactions were performed by incubating the Flag‐TBK1 or Flag‐IKKε immunoprecipitates (IP) with GST‐mTOR substrate [200 ng] for 30 min at 30°C. Immunoprecipitates (IPs) were immunoblotted (IB) as indicated.
- D
Cellular overexpression of TBK1 and IKKε in cells increases mTOR P‐S2159. HEK293 cells were co‐transfected with Myc‐mTOR (WT or S2159A) together with Flag‐IKKε or Flag‐TBK1 or plasmids. Whole‐cell lysate (WCL) was immunoblotted as indicated.
- E
Overexpression of TBK1 and IKKε in cells increases mTOR P‐S2159 in a BX‐795‐sensitive manner. HEK293‐TLR3 cells were co‐transfected with Myc‐mTOR and Flag‐TBK1 or Flag‐IKKε wild type (+) or kinase dead (KD) and then treated with BX‐795 [10 μM or 1 μM] (2 h). Myc‐mTOR was immunoprecipitated, and IPs and WCL were immunoblotted as indicated.
- F
Cellular BX‐795 treatment decreases mTOR S2159 phosphorylation. HEK293T cells stably expressing AU1‐mTOR were pre‐treated with BX‐795 [10 μM] (2 h). AU1‐mTOR was immunoprecipitated and immunoblotted as indicated.
- G, H
Flag‐TBK1 and Flag‐IKKε co‐immunoprecipitate with HA‐raptor and mTOR. HEK293T cells stably expressing AU1‐mTOR were transfected with Flag‐TBK1 (G) or Flag‐IKKε (H) wild‐type (+) or kinase‐dead (KD) plasmids together with HA‐raptor. HA‐raptor was immunoprecipitated and immunoblotted as indicated.
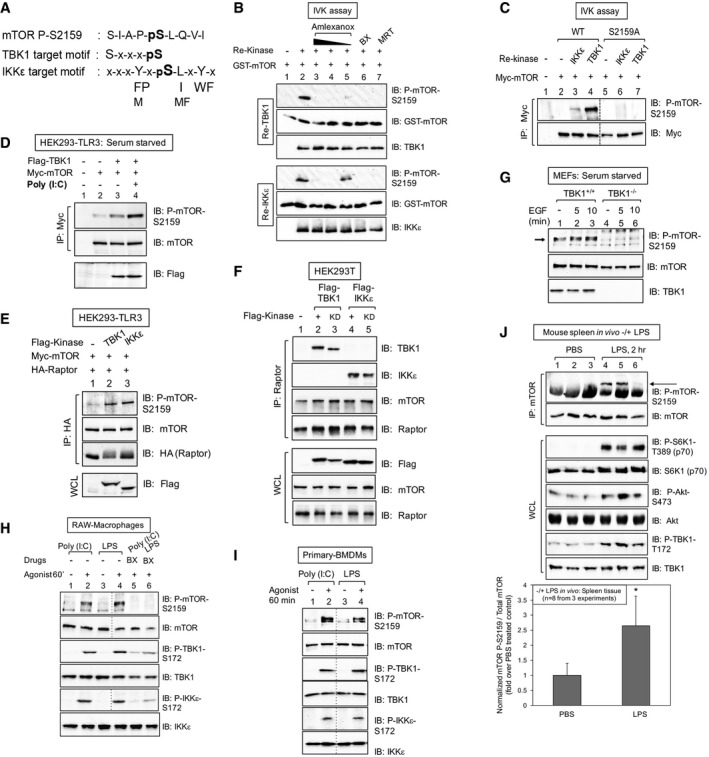
The mTOR S2159 sequence fits TBK1 and IKKε consensus phosphorylation motifs.
TBK1/IKKε phosphorylate mTOR S2159 directly in vitro. In vitro kinase (IVK) assays with recombinant (re) active TBK1 or IKKε [50 ng] (Invitrogen) and recombinant GST‐mTOR substrate [200 ng] for 30 min at 30°C. Reactions were pre‐incubated on ice 30 min with amlexanox [500, 250 or 50 μM], BX‐795 [10 μM] or MRT‐67307 [10 μM] and immunoblotted (IB) as indicated.
TBK1/IKKε phosphorylate full‐length mTOR on S2159. Myc‐mTOR wild type (WT) and S2159A were immunoprecipitated (IP) from transfected HEK293 cells and incubated with re‐TBK1 or re‐IKKε. IVK assays were performed as above and immunoblotted (IB) as indicated.
TBK1 overexpression increases mTOR P‐S2159, and poly(I:C) boosts this phosphorylation further. HEK293‐TLR3 cells were co‐transfected with Flag‐TBK1 and Myc‐mTOR. Cells were serum‐starved (20 h) and stimulated −/+ poly(I:C) [50 μg/ml] (2 h). Myc‐mTOR immunoprecipitates were immunoblotted (IB) as indicated.
TBK1 and IKKε overexpression increases mTOR P‐S2159 within mTORC1. HEK293‐TLR3 cells were co‐transfected with Flag‐TBK1 or Flag‐IKKε, Myc‐mTOR, and HA‐raptor. HA‐raptor immunoprecipitates and whole‐cell lysates (WCL) were immunoblotted (IB) as indicated.
Flag‐TBK1 and Flag‐IKKε co‐immunoprecipitate with endogenous mTORC1. HEK293T cells were transfected with Flag‐TBK1 or Flag‐IKKε wild type (+) or kinase dead (KD). Endogenous raptor immunoprecipitates and WCL were immunoblotted (IB) as indicated.
mTOR is phosphorylated on S2159 in wild type but not TBK1 null MEFs. TBK1+/+ and TBK1−/− MEFs were serum‐starved (20 h) and stimulated ± EGF [25 ng/ml]. WCL was immunoblotted (IB) as indicated. The arrow indicates mTOR phosphorylated on S2159.
The TBK1‐ and IKKε‐activating agonists poly(I:C) and LPS increase mTOR P‐S2159 in a BX‐795‐sensitive manner in cultured macrophages. RAW264.7 macrophages were pre‐treated with BX‐795 [10 μM] (2 h) and stimulated −/+ poly(I:C) [30 μg/ml] or LPS [100 ng/ml] (60 min).
Poly(I:C) and LPS increase mTOR P‐S2159 in primary bone marrow‐derived macrophages (BMDMs). BMDMs were stimulated −/+ poly(I:C) [30 μg/ml] or LPS [100 ng/ml] (60 min).
LPS increases mTOR P‐S2159 in vivo. Mice (C57BL6, 6 weeks old) were injected intraperitoneally with PBS or LPS [1 mg/kg BW] (2 h). mTOR was immunoprecipitated from spleen tissue, and IPs and WCL were immunoblotted as indicated. The graph depicts levels of mTOR P‐S2159 relative to total mTOR in spleen tissue −/+ LPS. n = 8 from 3 independent experiments ± SD. *P = 0.004 relative to PBS‐treated control mice by paired t‐test (two‐tailed).
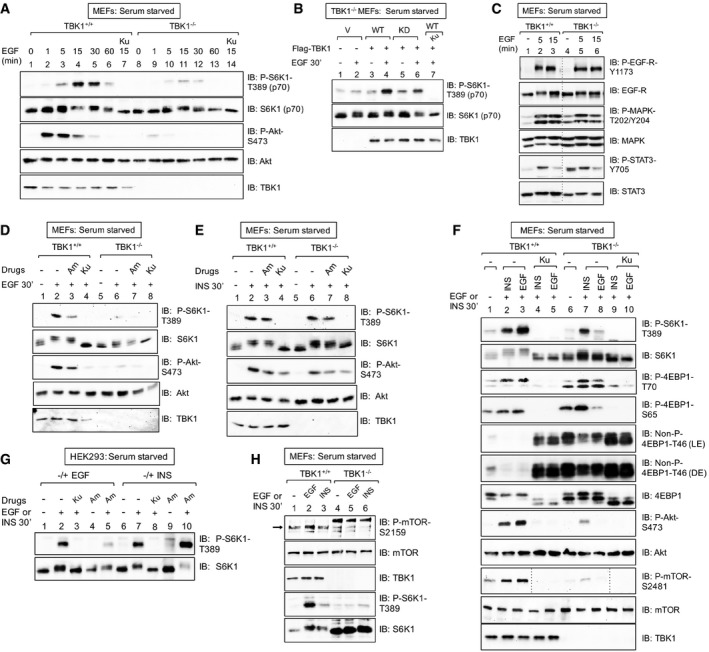
EGF increases mTORC1 signaling in a TBK1‐dependent manner. TBK1+/+ and TBK1−/− MEFs were serum‐starved (20 h), pre‐treated with Ku‐0063794 [1 μM] (30 min), and stimulated −/+ EGF [25 ng/ml] (0–60 min). Whole‐cell lysates (WCL) were immunoblotted (IB) as indicated.
Ectopic expression of TBK1 rescues mTORC1 signaling in TBK1−/− MEFs. TBK1−/− MEFs were transiently transfected with vector control (V), wild type (WT), or kinase‐dead (KD) Flag‐TBK1, serum‐starved (20 h), and analyzed as above.
EGF‐receptor signaling remains intact in TBK1−/− MEFs. TBK1+/+ and TBK1−/− MEFs were serum‐starved (20 h) and stimulated −/+ EGF [25 ng/ml] (0, 5, or 15 min).
TBK1 is required for EGF‐stimulated mTORC1 and mTORC2 signaling. TBK1+/+ and TBK1−/− MEFs were stimulated with EGF as in (A).
TBK1 is not required for insulin‐stimulated mTORC1 signaling. TBK1+/+ and TBK1−/− MEFs were stimulated with insulin as in (C).
Side‐by‐side comparison of EGF‐ vs. insulin‐stimulated mTORC1 and mTORC2 signaling in TBK1+/+ vs. TBK1−/− MEFs. MEFs were treated as in (C).
Pharmacologic TBK1 inhibition reduces EGF‐induced mTORC1 signaling. HEK293 cells were serum‐starved (20 h), pre‐treated with Ku‐0063794 [1 μM] (30 min) or amlexanox [50 μM] (2 h), and stimulated −/+ EGF [25 ng/ml] (30 min) or insulin (INS) [100 nM] (30 min).
EGF but not insulin increases mTOR P‐S2159. TBK1+/+ vs. TBK1−/− MEFs: MEFs were treated as in (C). The arrow indicates mTOR phosphorylated on S2159.
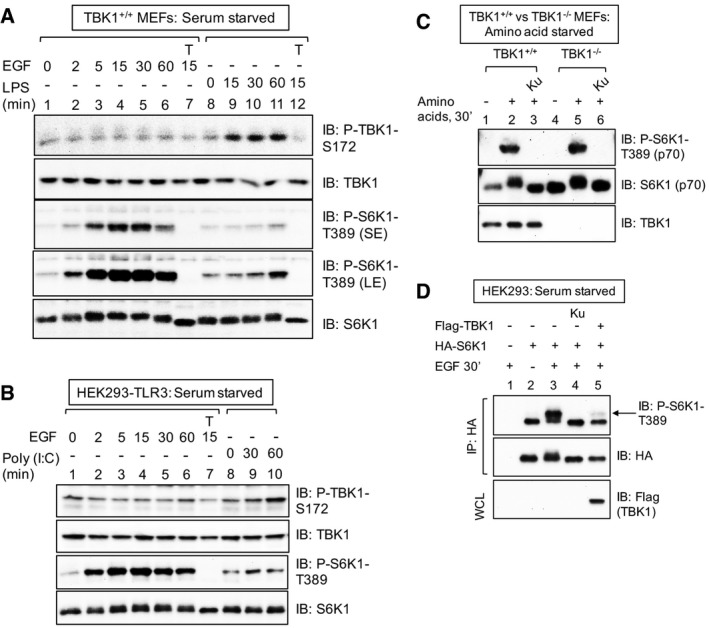
EGF fails to increase TBK1 S172 phosphorylation in MEFs. Cells were serum deprived (20 h) and stimulated −/+ EGF [25 ng/ml] or LPS [100 ng/ml] for the times indicated. Whole‐cell lysate (WCL) was immunoblotted as indicated. SE: short exposure; LE: long exposure.
EGF fails to increase TBK1 S172 phosphorylation in HEK293/TLR3 cells. Cells were serum deprived (20 h) and stimulated −/+ EGF [25 ng/ml] or poly(I:C) [50 ng/ml] for the times indicated.
TBK1 is not required for amino acid‐stimulated mTORC1 signaling. TBK1+/+ and TBK1−/− MEFs were deprived of amino acids by incubation in D‐PBS + glucose + dialyzed FBS [10%] (60 min). Amino acids were added back by incubating the cells in DMEM/FBS [10%] (30 min).
Cellular overexpression of TBK1 inhibits mTORC1 signaling. HEK293 cells were co‐transfected with HA‐S6K1 together with Flag‐TBK1, serum‐starved (20 h), pre‐treated with Ku‐0063794 [1 μM] (30 min), and stimulated −/+ EGF [25 ng/ml] (30 min). HA‐S6K1 was immunoprecipitated, and IPs and WCL were immunoblotted (IB) as indicated.
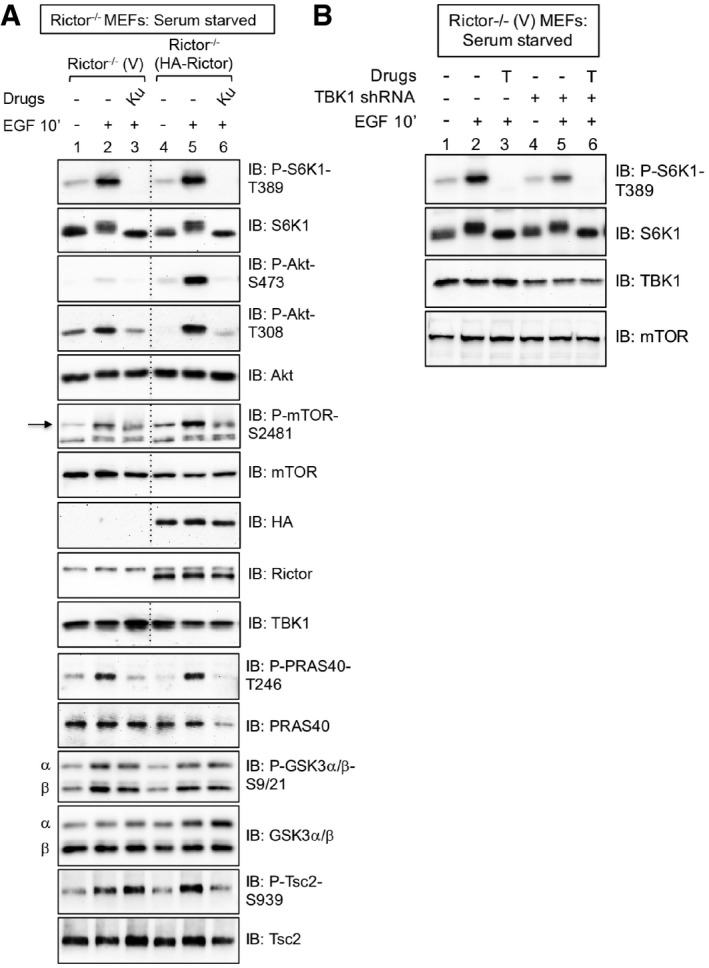
mTORC1 signaling remains intact in MEFs lacking mTORC2 function. Rictor−/− MEFs stably expressing vector control (V) or rescued stably with HA‐rictor were serum‐starved (20 h), pre‐treated with Ku‐0063794 [1 μM] (30 min), and stimulated −/+ epidermal growth factor (EGF) [25 ng/ml] (30 min). Whole‐cell lysates (WCL) were immunoblotted as indicated. The arrow indicates mTOR auto‐phosphorylated on S2481.
TBK1 is required for mTORC1 signaling in MEFs with reduced Akt S473 phosphorylation. TBK1 expression was reduced using lentivirally delivered TBK1 shRNA in Rictor−/− MEFs stably expressing vector control (V). Cells were EGF stimulated as above, except Torin1 [100 nM] (T) was used to inhibit mTOR.
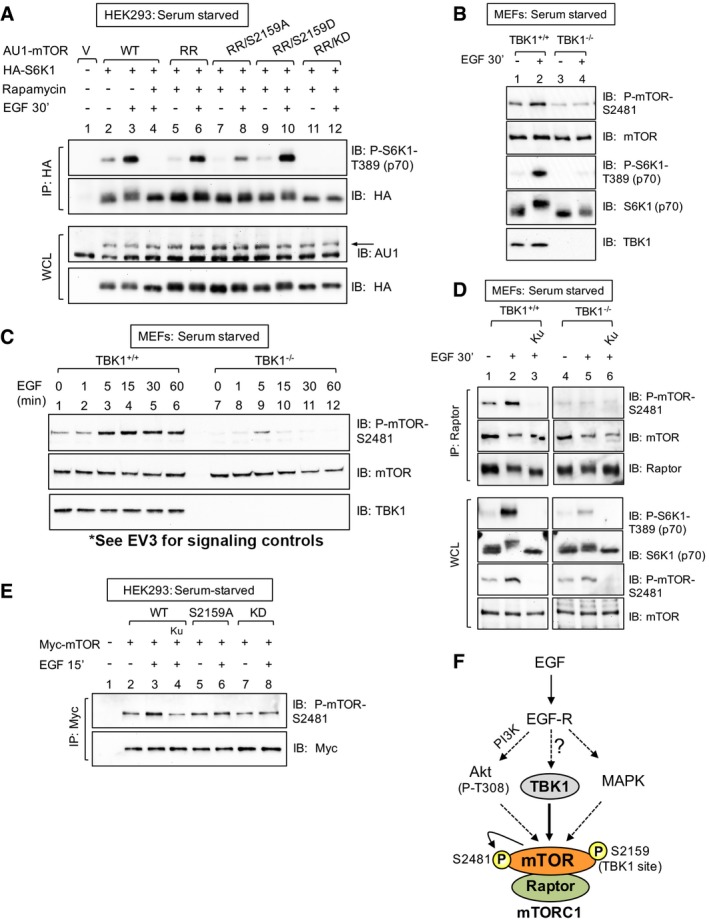
mTOR S2159 phosphorylation is required for EGF‐stimulated mTORC1 signaling. HEK293 cells were co‐transfected with vector control, wild‐type, or rapamycin‐resistant (RR) AU1‐mTOR alleles (RR or RR/S2159A) together with HA‐S6K1. Cells were serum‐starved (20 h), treated −/+ rapamycin (30 min) to ablate endogenous mTORC1 function, and stimulated −/+ EGF [25 ng/ml] (30 min). HA‐S6K1 was immunoprecipitated, and immunoprecipitates (IP) and whole‐cell lysates (WCL) were immunoblotted (IB) as indicated. The arrow indicates AU1‐mTOR.
TBK1 is required for EGF‐stimulated mTOR auto‐phosphorylation. TBK1+/+ and TBK1−/− MEFs were serum‐starved, EGF stimulated, and analyzed as in (A).
EGF time course analysis of mTOR auto‐phosphorylation. TBK1+/+ and TBK1−/− MEFs were serum‐starved, EGF stimulated for 0‐60 min, and analyzed as in (A).
TBK1 is required for EGF‐stimulated mTOR auto‐phosphorylation within mTORC1. TBK1+/+ and TBK1−/− MEFs were serum‐starved, pre‐treated with Ku‐0063794 [1 μM], and EGF stimulated as in (A). Raptor was immunoprecipitated, and IPs and WCL were analyzed.
mTOR S2159 phosphorylation is required for EGF‐stimulated mTOR auto‐phosphorylation. HEK293 cells were transfected with Myc‐mTOR wild type (WT), S2159A, and kinase dead (KD). Cells were then serum‐starved, pre‐treated with Ku‐0063794 (30 min), and stimulated −/+ EGF as in (A).
Model. EGF‐receptor signaling increases mTORC1 signaling through at least three pathways in MEFs: the PI3K/Akt, MAPK, and TBK1 pathways.
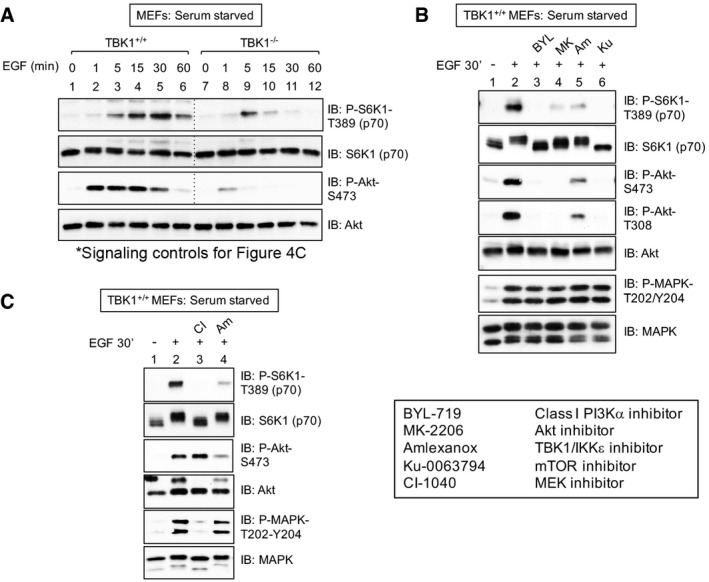
mTORC1 signaling controls for Fig 4C. TBK1+/+ and TBK1−/− MEFs were serum‐starved (20 h) and stimulated without (−) or with (+) EGF [25 ng/ml] for 0–60 min. WCL was immunoblotted as indicated.
PI3Kα, Akt, and TBK1 activity is required for EGF‐stimulated mTORC1 signaling. TBK1+/+ MEFs were serum‐starved (20 h), pre‐treated with the PI3Kα class I inhibitor BYL‐719 [10 μM] (30 min), the Akt inhibitor MK‐2206 [10 μM] (30 min), amlexanox [100 μM] (2 h), or Ku‐0063794 [1 μM] (30 min), and stimulated −/+ epidermal growth factor (EGF) [50 ng/ml] (30 min).
MAPK and TBK1 activity is required for EGF‐stimulated mTORC1 signaling: TBK1+/+ MEFs were treated as above except they were pre‐treated with the MEK inhibitor CI‐1040 [10 μM] or amlexanox [100 μM] (30 min).
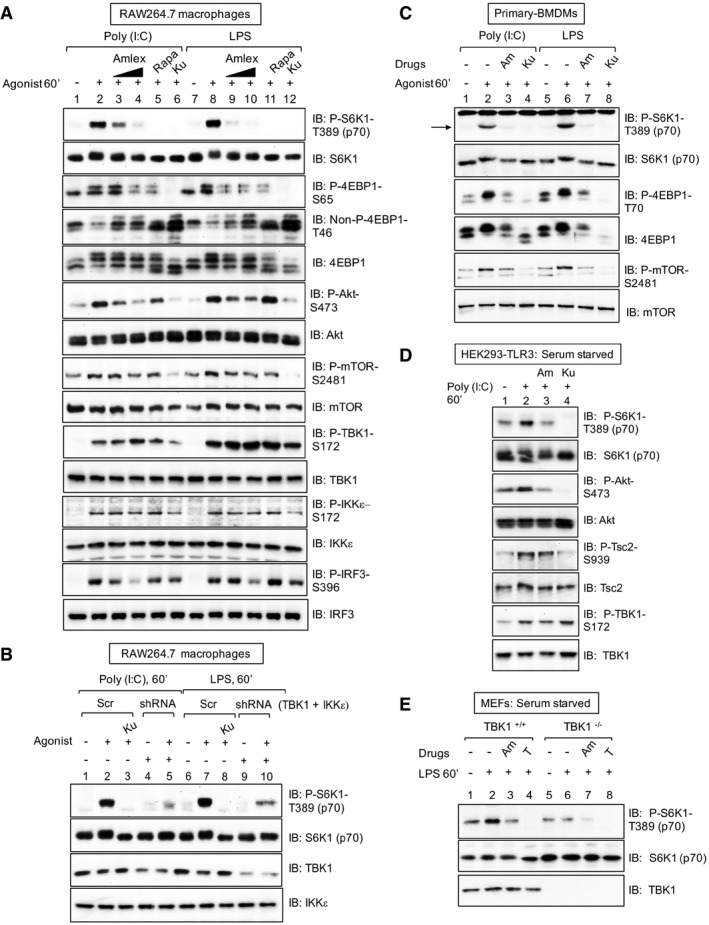
Pharmacologic TBK1 inhibition reduces mTORC1 signaling upon activation of TLR3 and TLR4 in cultured macrophages. RAW264.7 cells cultured in full serum were pre‐treated with amlexanox [50 μM or 100 μM] (2 h), rapamycin [20 ng/ml] (30 min), or Ku‐0063794 [1 μM] (30 min) and stimulated −/+ poly(I:C) [30 μg/ml] or LPS [100 ng/ml] (60 min). Whole‐cell lysate (WCL) was immunoblotted as indicated.
Knockdown of TBK1 with shRNA reduces TLR3‐ and TLR4‐stimulated mTORC1 signaling. RAW264.7 macrophages were co‐infected with shRNA‐containing lentiviruses targeting TBK1 and IKKε shRNA or infected with scrambled control (Scr), selected in puromycin, and treated as in (A).
Pharmacologic TBK1 inhibition reduces mTORC1 signaling upon activation of TLR3 and TLR4 in primary macrophages. BMDMs were pre‐treated with amlexanox [100 μM] (2 h) or Ku‐0063794 [1 μM] (30 min) and stimulated −/+ poly(I:C) or LPS as in (A). The arrow indicates S6K1 phosphorylated on T389.
Pharmacologic TBK1 inhibition reduces mTORC1 signaling upon activation of TLR3 in HEK293‐TLR3 cells. Cells were serum‐starved (20 h), pre‐treated with amlexanox or Ku‐0063794 as in (C) above, and stimulated −/+ poly(I:C) [50 μg/ml] (60 min).
TLR4/LPS‐stimulated mTORC1 signaling requires TBK1. TBK1+/+ and TBK1−/− MEFs were serum‐starved (20 h), pre‐treated with amlexanox [50 μM] (2 h) or Torin1 [100 nM] (30 min), and stimulated −/+ LPS as in (A).
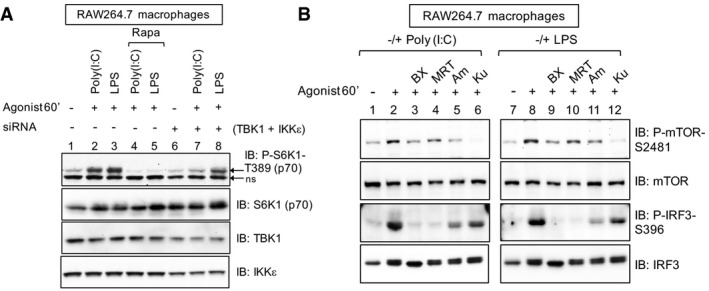
siRNA‐mediated knockdown of TBK1/IKKε reduces TLR3/4‐stimulated mTORC1 signaling. RAW264.7 macrophages were transfected with siRNAs targeting TBK1 and IKKε. After 5 days, cells were pre‐treated with rapamycin [20 ng/ml] (30 min) and stimulated −/+ poly(I:C) [30 μg/ml] or LPS [100 ng/ml] (60 min). ns = non‐specific band.
Pharmacologic inhibition of TBK1 reduces mTOR catalytic activity as measured by mTOR S2481 auto‐phosphorylation. RAW264.7 macrophages were pre‐treated with the TBK1 inhibitors BX‐795 [10 μM] (30 min), MRT‐67307 [10 μM] (30 min), amlexanox [100 μM] (2 h) or with the mTOR inhibitor Ku‐0063794 [1 μM] (30 min) and stimulated −/+ poly(I:C) [30 μg/ml] or LPS [100 ng/ml] (60 min). WCL was immunoblotted as indicated.
- A, B
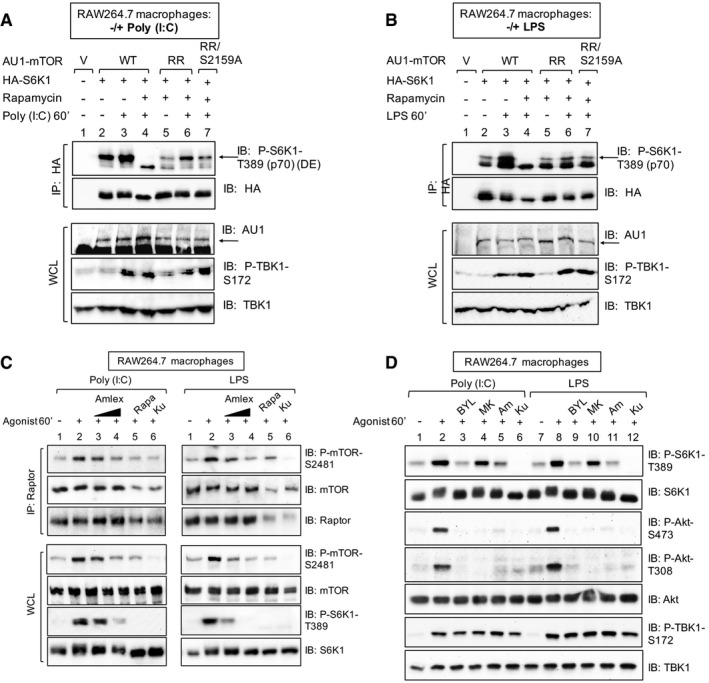
mTOR S2159 phosphorylation is required for TLR3‐ and TLR4‐stimulated mTORC1 signaling. RAW264.7 macrophages were co‐transfected with vector control, wild‐type, or rapamycin‐resistant (RR) AU1‐mTOR alleles (RR or RR/S2159A) together with HA‐S6K1. Cells were treated with rapamycin (+) to ablate endogenous mTORC1 function and stimulated with poly(I:C) (A) or LPS (B) as in (C). HA‐S6K1 was immunoprecipitated, and IPs and WCL was immunoblotted as indicated. The arrows indicate S6K1 phosphorylated on T389.
- C
TBK1 activity is required for TLR3‐ and TLR4‐stimulated mTORC1 catalytic activity. RAW264.7 macrophages were pre‐treated with amlexanox [50 μM] or [100 μM] (2 h), rapamycin [20 ng/ml] (30 min), or Ku‐0063794 [1 μM] (30 min) and treated −/+ poly(I:C) [30 μg/ml] or LPS [100 ng/ml] (60 min). Raptor was immunoprecipitated (IP), and IPs and whole‐cell lysates (WCL) were immunoblotted (IB) as indicated.
- D
Pharmacologic inhibition of PI3Kα but not Akt reduces TLR3‐ and TLR4‐stimulated mTORC1 signaling. RAW264.7 macrophages were pre‐treated with the PI3Kα class I inhibitor BYL‐719 [10 μM], the Akt inhibitor MK‐2206 [10 μM], amlexanox [100 μM], or Ku‐0063794 [1 μM] (30 min) and stimulated −/+ poly(I:C) or LPS as in (C).
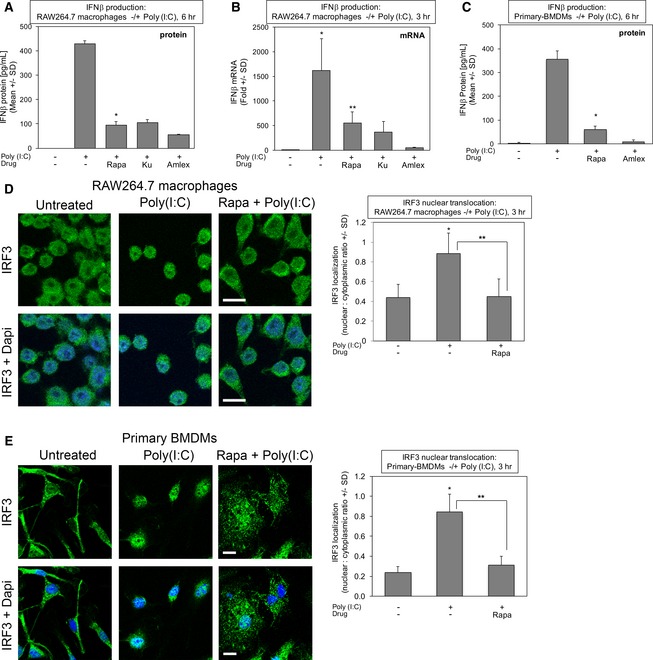
Rapamycin suppresses TLR3‐stimulated IFN‐β protein production in cultured macrophages. RAW264.7 macrophages were pre‐treated with rapamycin [20 ng/ml] (30 min), Ku‐0063794 [1 μM] (30 min), or amlexanox [50 μM] (2 h) and stimulated −/+ poly(I:C) [30 μg/ml] for 6 h. The secretion of IFN‐β was measured by ELISA. Results represent the mean ± SD of quadruplicate samples from one experiment. *P = 0.0009 relative to +poly(I:C) by paired t‐test (two‐tailed).
Rapamycin suppresses TLR3‐stimulated IFN‐β mRNA production in cultured macrophages. RAW264.7 macrophages were treated as above but stimulated −/+ poly(I:C) [30 μg/ml] for 3 h. IFN‐β gene expression was measured by qRT–PCR. Results represent the mean ± SD of triplicate samples from one experiment. *P = 0.03 relative to no poly(I:C) by paired t‐test (one‐tailed); **P = 0.04 relative to +poly(I:C) by paired t‐test (one‐tailed).
Rapamycin suppresses TLR3‐stimulated IFN‐β protein production in primary macrophages. BMDMs were pre‐treated with rapamycin or amlexanox and analyzed as in (A). Results represent the mean ± SD of triplicate samples from one experiment. *P = 0.002 relative to +poly(I:C) by paired t‐test (two‐tailed).
Rapamycin suppresses TLR3‐stimulated IRF3 nuclear translocation in RAW264.7 macrophages. Cells were pre‐treated with rapamycin and stimulated −/+ poly(I:C) for 3 h as in (A), fixed, and processed for confocal immunofluorescence microscopy using an anti‐IRF3‐Alexa 488 antibody and DAPI staining. The graph represents the mean ± SD of at least 400 cells total from three independent experiments. *P = 0.002 relative to no poly(I:C) by paired t‐test (two‐tailed); **P = 0.003 relative to +poly(I:C) by paired t‐test (two‐tailed). Scale bar = 10 μm.
Rapamycin suppresses TLR3‐stimulated IRF3 nuclear translocation in primary BMDMs. Cells were pre‐treated with rapamycin and stimulated −/+ poly(I:C) for 3 h as in (A), fixed, and processed for confocal immunofluorescence microscopy using an anti‐IRF3‐Alexa 488 antibody and DAPI stain. The graph represents the mean ± SD of at least 380 cells total from three independent experiments. *P = 0.003 relative to no poly(I:C) by paired t‐test (two‐tailed); **P = 0.005 relative to +poly(I:C) by paired t‐test (two‐tailed). Scale bar = 10 μm. Note: the untreated control image is the same as the untreated control image in Fig EV5E.
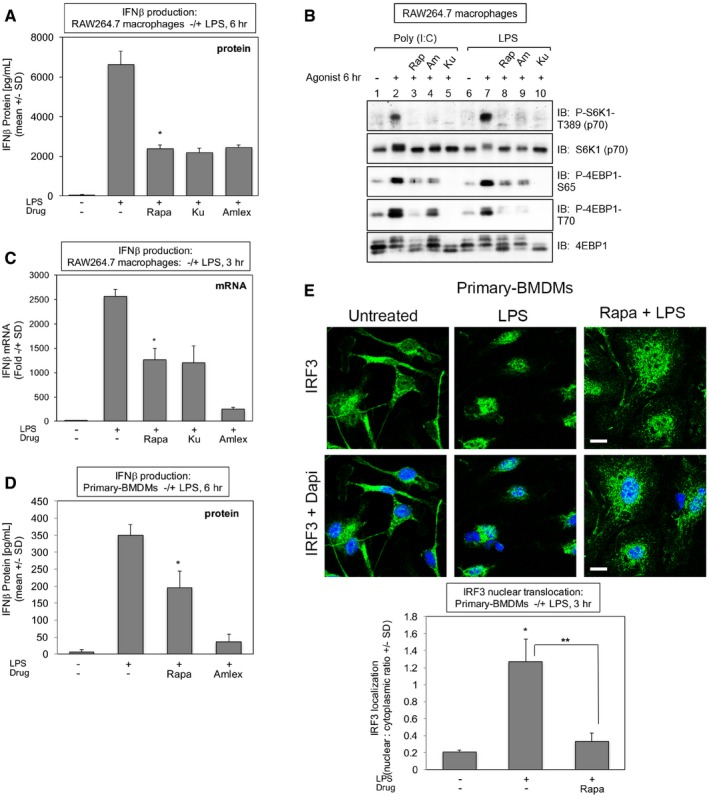
mTORC1 inhibition with rapamycin suppresses TLR4‐induced IFN‐β protein production in RAW264.7 macrophages. Cells were pre‐treated with rapamycin [20 ng/ml] (30 min), Ku‐0063794 [1 μM] (30 min), or amlexanox [50 μM] (2 h) and stimulated −/+ LPS [100 ng/ml] (6 h). The secretion of IFN‐β into the culture media was measured by ELISA. Results represent the mean ± SD of quadruplicate samples from one experiment. *P = 0.007 relative to +LPS by paired t‐test (two‐tailed).
Rapamycin maintains suppression of TLR3/4‐induced mTORC1 signaling at 6 h of treatment in RAW264.7 macrophages. Cells were treated as in (A). WCL was immunoblotted as indicated.
Rapamycin suppresses TLR4‐induced IFN‐β mRNA production in RAW264.7 macrophages. Cells were treated as in (A) but LPS treatment lasted 3 h. IFN‐β gene expression was measured by qRT–PCR. Results represent the mean ± SD of triplicate samples from one experiment. *P = 0.002 relative to +LPS by paired t‐test (two‐tailed).
Rapamycin suppresses TLR4‐stimulated IFN‐β protein production in primary macrophages. BMDMs were pre‐treated with rapamycin or amlexanox and analyzed as in (A). Results represent the mean ± SD of triplicate samples from one experiment. *P = 0.02 relative to +LPS no rapamycin by paired t‐test (two‐tailed).
Rapamycin suppresses TLR4‐stimulated IRF3 nuclear translocation in primary macrophages. BMDMs were treated with LPS for 3 h as in (A), fixed, and processed for confocal immunofluorescence microscopy using an anti‐IRF3‐Alexa488 antibody and DAPI staining. The graph represents the mean ± SD of at least 95 cells from one experiment. *P = 0.002 relative to no LPS by paired t‐test (two‐tailed); **P = 0.005 relative to +LPS by paired t‐test (two‐tailed). Scale bar = 10 μm. Note: the control image is the same as the control image shown in Fig 7E.
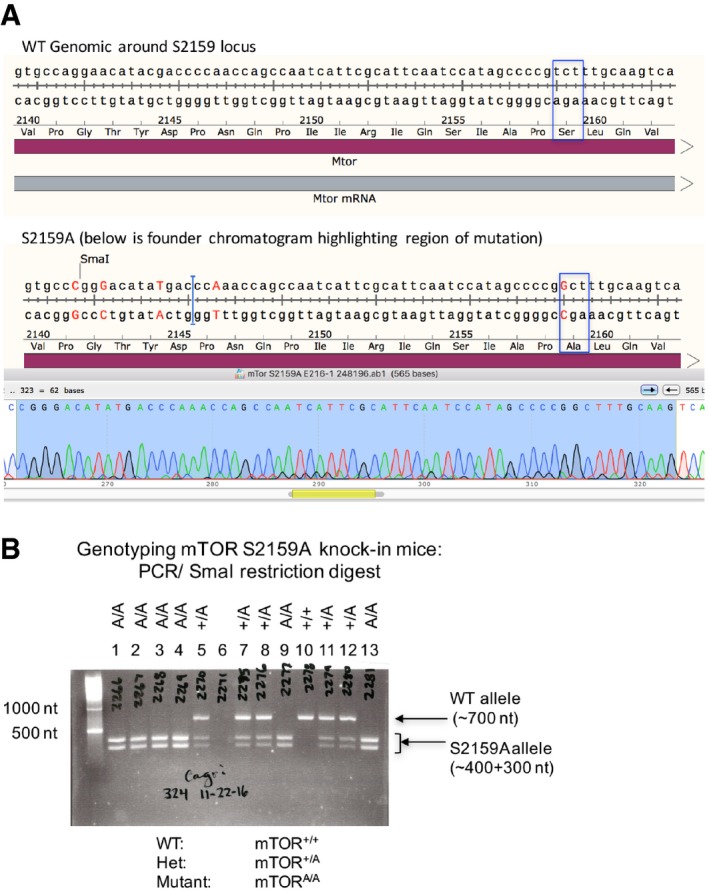
TOPO cloning and DNA sequencing of founder mTORA/A mice. Sequence analysis confirmed the presence of an edited mTOR gene containing an Ala substitution at Ser2159. The blue box highlights the S2159A point mutation. Sequencing also confirmed the introduction of a new SmaI restriction site to facilitate genotyping and several silent mutations to prevent re‐targeting of edited genomic DNA.
Representative DNA agarose gel depicting genotyping of wild‐type (mTOR+/+), heterozygous (mTOR+/A), and homozygous mutant S2159A knock‐in mice (mTORA/A). A ˜700 nt fragment of genomic DNA surrounding the mTOR S2159 locus was PCR amplified and digested with SmaI. Restriction products of ˜400 nt and ˜300 nt indicate the presence of the S2159A knock‐in allele.
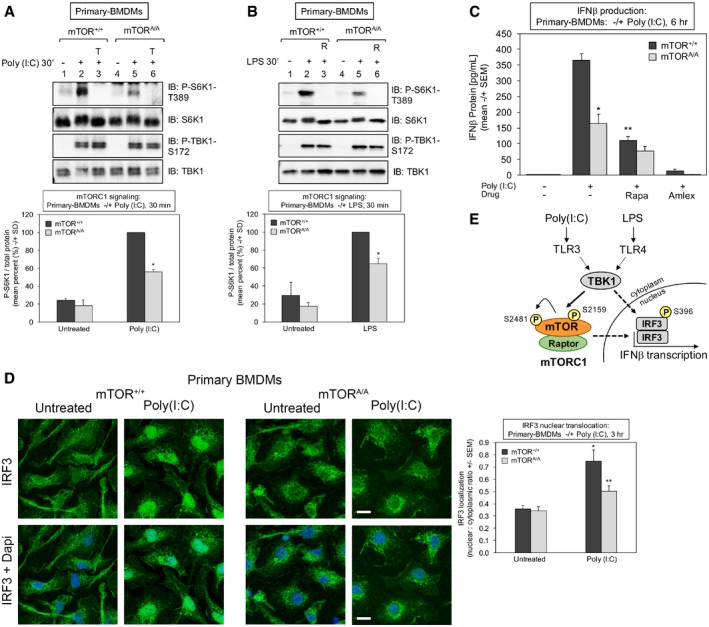
Reduced TLR3‐induced mTORC1 signaling in mTOR S2159A knock‐in primary macrophages (mTORA/A) relative to wild type (mTOR+/+): BMDMs were pre‐treated with Torin 1 [100 nM] (30 min) and stimulated −/+ poly(I:C) [30 μg/ml] for 30 min. Whole‐cell lysate (WCL) was immunoblotted as indicated. The graph quantitates three independent experiments each with n = 1 (n = 3 total). The level of P‐S6K1‐T389 normalized to total protein in mTOR+/+ macrophages stimulated with poly(I:C) was set at 100%. The other bars represent mean ± SD as a relative percent. *The confidence interval at 95% (52.7–59.1) indicates statistical significance between mTOR+/+ vs. mTORA/A BMDMs.
Reduced TLR4‐induced mTORC1 signaling in mTORA/A primary macrophages. BMDMs were treated as in (A) except stimulated −/+ LPS [100 ng/ml] (30 min). The graph quantitates three independent experiments each with n = 1 (n = 3 total). The level of P‐S6K1‐T389 normalized to total protein in mTOR+/+ macrophages stimulated with LPS was set at 100%. The other bars represent mean ± SD as a relative percent. *The confidence interval at 95% (58.6–71.2%) indicates statistical significance between mTOR+/+ vs. mTORA/A BMDMs.
Reduced TLR3‐stimulated IFN‐β protein production in mTORA/A primary macrophages. BMDMs were serum‐starved for 6 h and stimulated −/+ poly(I:C) [30 μg/ml] for 6 h. The secretion of IFN‐β was measured by ELISA. Results represent the mean ± SEM from three independent experiments, n = 8 samples total. *P = 0.0002 relative to mTOR+/+ + poly(I:C) by unpaired t‐test (equal variance; two‐tailed). **P = 0.0001 relative to mTOR+/+ + poly(I:C) by paired t‐test (two‐tailed).
Reduced TLR3‐stimulated IRF3 nuclear translocation in mTORA/A primary macrophages. BMDMs were treated −/+ poly(I:C) for 3 h as in (A), fixed, and processed for confocal immunofluorescence microscopy using an anti‐IRF3‐Alexa 488 antibody and DAPI stain. The graph represents the mean ± SEM of at least 270 cells total from four independent experiments. *P = 0.001 relative to mTOR+/+ no poly(I:C) by unpaired t‐test (equal variance; two‐tailed). **P = 0.02 relative to mTOR+/+ + poly(I:C) by unpaired t‐test (equal variance; two‐tailed). Scale bar = 10 μm.
Model. TLR3 and TLR4 signaling increases TBK1‐mediated mTOR S2159 phosphorylation, resulting in increased mTORC1 catalytic activity, mTORC1 downstream signaling, IRF3 nuclear translocation, and IFN‐β production.
References
-
- Alain T, Lun X, Martineau Y, Sean P, Pulendran B, Petroulakis E, Zemp FJ, Lemay CG, Roy D, Bell JC, Thomas G, Kozma SC, Forsyth PA, Costa‐Mattioli M, Sonenberg N (2010) Vesicular stomatitis virus oncolysis is potentiated by impairing mTORC1‐dependent type I IFN production. Proc Natl Acad Sci USA 107: 1576–1581 - PMC - PubMed
-
- Alessi DR, Pearce LR, Garcia‐Martinez JM (2009) New insights into mTOR signaling: mTORC2 and beyond. Sci Signal 2: pe27 - PubMed
-
- Barbie DA, Tamayo P, Boehm JS, Kim SY, Moody SE, Dunn IF, Schinzel AC, Sandy P, Meylan E, Scholl C, Frohling S, Chan EM, Sos ML, Michel K, Mermel C, Silver SJ, Weir BA, Reiling JH, Sheng Q, Gupta PB et al (2009) Systematic RNA interference reveals that oncogenic KRAS‐driven cancers require TBK1. Nature 462: 108–112 - PMC - PubMed
-
- Boehm JS, Zhao JJ, Yao J, Kim SY, Firestein R, Dunn IF, Sjostrom SK, Garraway LA, Weremowicz S, Richardson AL, Greulich H, Stewart CJ, Mulvey LA, Shen RR, Ambrogio L, Hirozane‐Kishikawa T, Hill DE, Vidal M, Meyerson M, Grenier JK et al (2007) Integrative genomic approaches identify IKBKE as a breast cancer oncogene. Cell 129: 1065–1079 - PubMed
Publication types
MeSH terms
Substances
Grants and funding
LinkOut - more resources
Full Text Sources
Other Literature Sources
Molecular Biology Databases
Miscellaneous
