. 2018 Feb;93(2):90-100.
doi: 10.1124/mol.117.110569. Epub 2017 Nov 17.

GABA Type A Receptor Activation in the Allosteric Coagonist Model Framework: Relationship between EC50 and Basal Activity

Affiliations

GABA Type A Receptor Activation in the Allosteric Coagonist Model Framework: Relationship between EC50 and Basal Activity

Gustav Akk et al. Mol Pharmacol. 2018 Feb.

Abstract

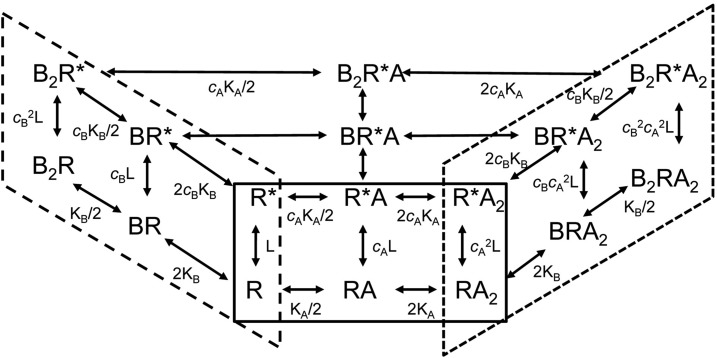
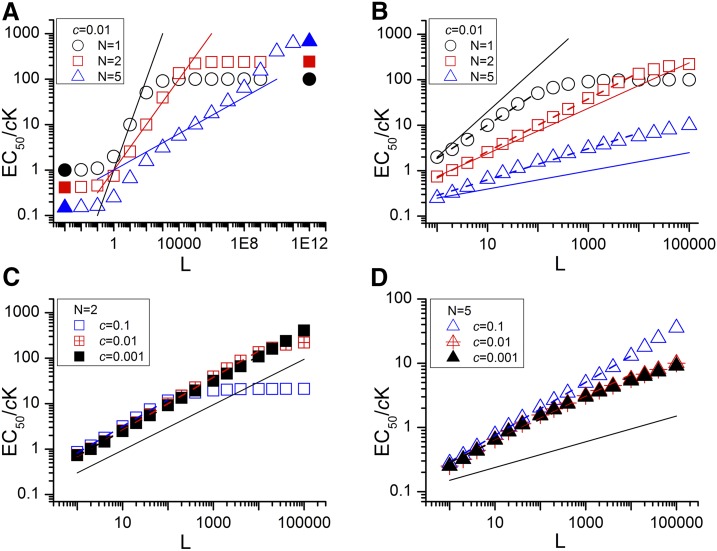
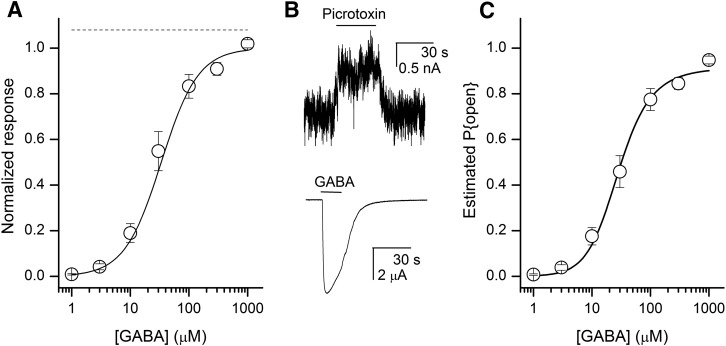
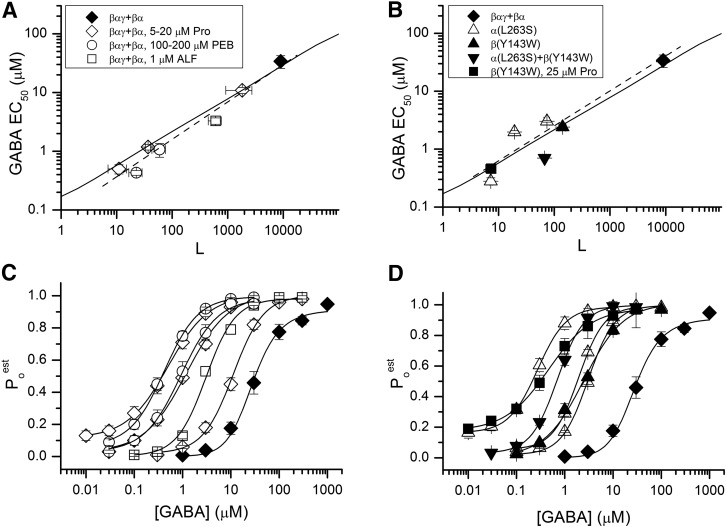
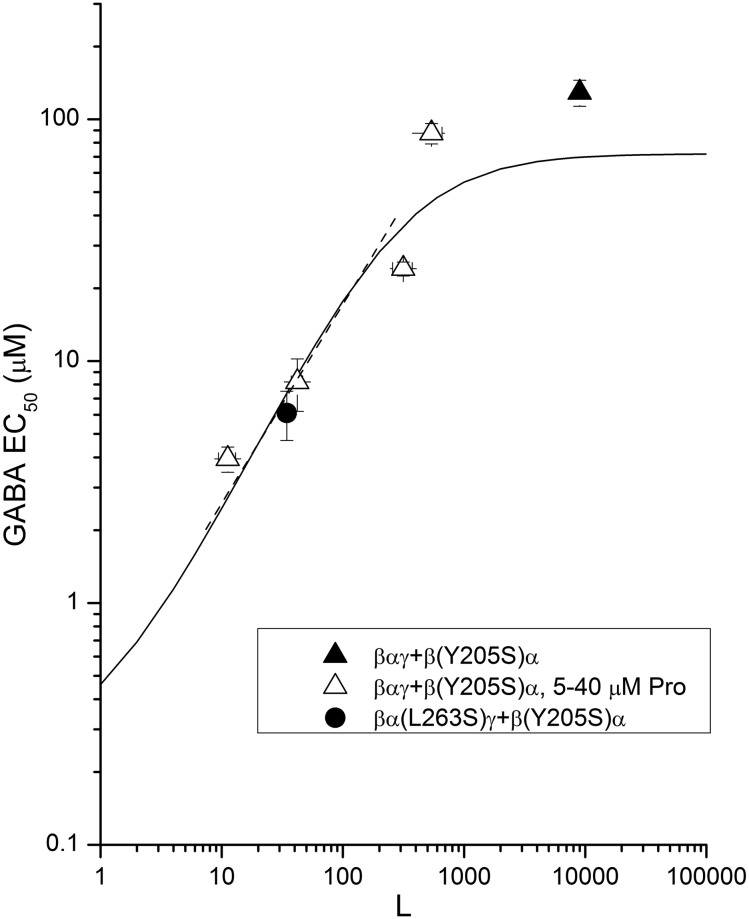
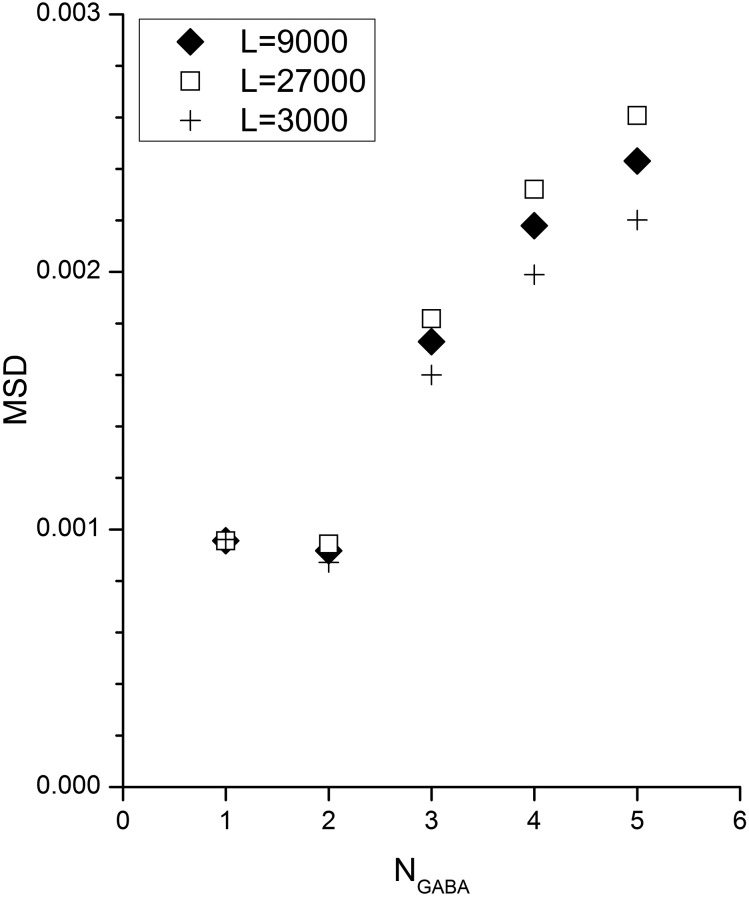
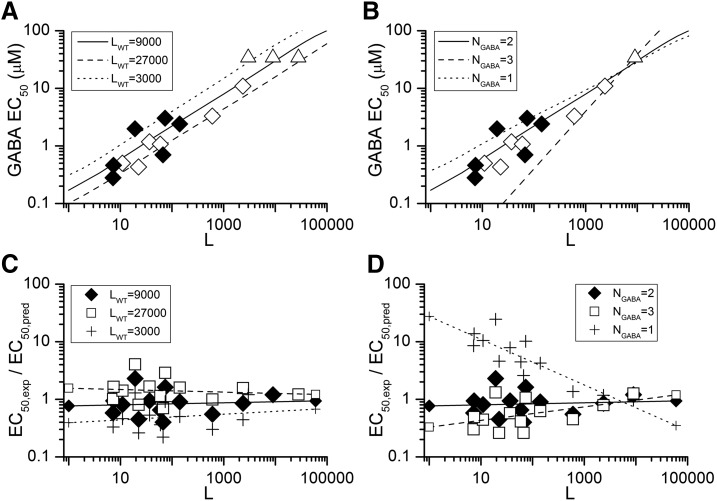
The concerted transition model for multimeric proteins is a simple formulation for analyzing the behavior of transmitter-gated ion channels. We used the model to examine the relationship between the EC50 for activation of the GABA type A (GABAA) receptor by the transmitter GABA and basal activity employing concatemeric ternary GABAA receptors expressed in Xenopus oocytes. Basal activity, reflecting the receptor function in the absence of the transmitter, can be changed either by mutation to increase constitutive activity or by the addition of a second agonist (acting at a different site) to increase background activity. The model predicts that either mechanism for producing a change in basal activity will result in identical effects on the EC50 We examined receptor activation by GABA while changing the level of basal activity with the allosterically acting anesthetics propofol, pentobarbital, or alfaxalone. We found that the relationship between EC50 and basal activity was well described by the concerted transition model. Changes in the basal activity by gain-of-function mutations also resulted in predictable changes in the EC50 Finally, we altered the number of GABA-binding sites by a mutation and again found that the relationship could be well described by the model. Overall, the results support the idea that interactions between the transmitter GABA and the allosteric agonists propofol, pentobarbital, or alfaxalone can be understood as reflecting additive and independent free energy changes, without assuming any specific interactions.


Figures

Fig. 1.
Fig. 1.
Partial state diagram for two drugs (A and B, each with two sites) acting on a receptor following the concerted transition scheme. Closed receptor states (R) occupy the plane at the bottom (note that some states are obscured such as B2RA) while open states (R*) occupy the plane at the top. The diagram is distorted to show states with only agonist A bound (solid line box at front), only agonist B bound (long dashed line box at left), and some states with both agonists bound (short dash box at right). In the absence of both A and B the receptor activates constitutively with L = R/R*. The value of the parameter L is a property of the receptor, not of any agonist. Agonist A binds to its site with dissociation constant KA on the closed receptor and KA* on the open receptor, with cA = KA*/KA. Note that the presence of bound B does not affect binding of A nor vice versa. The equilibrium between R and R* states is determined by the respective values for c, as dictated by detailed mass action in the coupled cycles (e.g., B2R/B2R* = cB2L and B2RA2/B2R*A2 = cB2cA2L).
Fig. 2.
Fig. 2.
The theoretical relationship between normalized EC50 and L. The figure shows the predicted EC50 plotted logarithmically against the value for L. The values for EC50 are normalized to the dissociation constant for the open state. (A) Relationships for N values of 1 (○), 2 (□), and 5 (▵) for c = 0.01 over a wide range of values for L (10−2 to 1012). The filled symbols show the predicted asymptotic values (see Results). The lines show slopes of 1/N. (B) Same as A but over a range of L values previously reported for the GABAA receptor to illustrate results that might be obtained experimentally. The dashed lines show the linear regression on the logarithmically transformed data; the slopes of the regression lines are 0.75 for N = 1, 0.58 for N = 2 and 0.37 for N = 5. The solid lines show slopes of 1/N. (C and D) Relationships between predicted EC50 and L for N = 2 (C) and N = 5 (D). Three values for c were used—c = 0.1, c = 0.01, and c = 0.001—to cover the range appropriate for the GABAA receptor (L = 1 to 100,000). The solid lines show lines with slope of 1/N. Table 1 provides slopes for the linear regression on the logarithmically transformed data for a number of combinations for N, L, and c.
Fig. 3.
Fig. 3.
Properties of the wild-type βαγ+βα concatemeric receptor. (A) Mean current responses elicited by GABA (○) normalized to the maximal fitted response. The line shows predictions of eq. 1 to the data. The mean values of the fit were EC50,GABA = 34 ± 8 µM and nH,GABA = 1.38 ± 0.07 (n = 5 cells). (B) Responses to 300 μM picrotoxin and 1000 μM GABA. The current traces are from the same cell. (C) Concentration–response data expressed as the estimated probability of being open plotted against the agonist concentration. The lines show the predictions of the MWC model (eq. 4) fitted to the data with the parameters LWT = 9000, NGABA = 2, KGABA = 72 ± 15 μM, and cGABA = 0.0033 ± 0.0004.
Fig. 4.
Fig. 4.
Effect of change in L on activation by GABA. The measured EC50 for GABA is plotted logarithmically against the value for L. (A) Data for receptors composed of wild-type concatemers in the absence of any other drug (LWT; ♦) or in the presence of propofol (◇; concentrations of 20, 10, and 5 µM from lower to higher L), pentobarbital (○; 200 and 100 µM), or alfaxalone (□; 1 µM). The symbols show mean values, and the error bars indicate ± 1 S.E.M. The solid line shows the predicted relationship between the EC50 and L using the values estimated for the wild-type: LWT = 9000, NGABA = 2, KGABA = 72 µM, and cGABA = 0.0033. The dashed line shows the linear regression of log(EC50) on log(L) (slope = 0.63 ± 0.05). (B) Data for receptors containing the α1(L263S) mutation (▵; from lower L to higher L mutation is in both constructs, in βαγ, or in βα), the β2(Y143W) mutation (▴; mutation is in both constructs), or the combination of β2(Y143W) in βαγ and α1(L263S) in βα (▾). The plot also shows data for the β(Y143W)αγ+βα receptor in the presence of 25 μM propofol (▪). The solid line shows the predicted relationship using the values from fits of data from the wild-type receptor. The dashed line shows the linear regression of log(EC50) on log(L) (slope = 0.60 ± 0.11). The data are summarized in Table 2. (C and D) Corresponding concentration–response relationships. The symbols show the mean ± S.E.M. The symbols are as in graphs A and B. The curves show fits to the Hill equation incorporating a low-concentration offset. The EC50 values are given in Table 2.
Fig. 5.
Fig. 5.
Effect of change in NGABA on activation by GABA. The figure shows data for receptors composed of a βαγ concatemer and a β(Y205S)α concatemer in the absence of propofol (▴) and in the presence of four different concentrations of propofol (▵; 40, 20, 10, and 5 µM from lower to higher L). The filled circle shows data from a receptor containing two mutations: βα(L263S)γ and β(Y205S)α. The solid line shows the predicted values for the EC50 assuming that LWT = 9000, KGABA = 72 µM, and cGABA = 0.0033 (unchanged from wild-type receptor values), while NGABA = 1. The dashed line shows the logarithmic regression from the linear region of the predicted line (slope = 0.74 ± 0.1).
Fig. 6.
Fig. 6.
Quality of description of concentration–response data with different assumed values for LWT and NGABA. The mean squared differences (MSD) between the predicted and measured concentration–response data are shown for different values of LWT and NGABA. The concentration–response data (see Fig. 3B) were fit with various values for NGABA as indicated on the abscissa and three values for LWT (9000 ♦, 27,000 □, and 3000 +). An F test on the ratio of MSD values indicated that the difference between NGABA = 2 and NGABA = 4 or 5 was marginally statistically significant (P < 0.04 for all L values, uncorrected for multiple comparisons).
Fig. 7.
Fig. 7.
Predictions of EC50 values made using parameters generated with different values for L and N. (A and B) Data for EC50,GABA and L replotted from Fig. 4, A and B. (A) Lines show the predicted relationships for three different assumed values of LWT with NGABA = 2. (B) Lines show predicted relationships for three assumed values for NGABA with LWT = 9000. (▵) Data for wild-type receptors in the absence of other agonists; note that ▵▵▵ are shown in A, corresponding to the assumed values for LWT. (◇) Values in the presence of a background drug. (♦) Values in the presence of an α1(L263S) mutation. (C and D) Quality of the descriptions assessed by calculating the ratio of the experimental EC50,GABA to the predicted EC50,GABA, which is plotted against L. (C) Data when the value of LWT was changed while NGABA = 2. (D) Changes in NGABA with LWT = 9000.The lines identified by the symbols at the ends of the lines show the linear regression of log(ratio) on log(L). Comparison of (A–C) indicates that an LWT value of 3000 (NGABA = 2) provides predictions that consistently lie above the observed values (ratio < 1), for LWT = 27,000 consistently lie below, and for LWT = 9000 are relatively close to the observed EC50. Similarly, the predictions for NGABA = 1 or 3 (B and D) demonstrate increasing large inaccuracies relative to the experimental EC50 values as L departs further from the value for wild-type receptors in the absence of agonists, while the predictions for NGABA = 2 have a relatively constant relationship to the observed EC50. The results are summarized in Table 3.

References

    1. Akk G, Bracamontes J, Steinbach JH. (2001) Pregnenolone sulfate block of GABA(A) receptors: mechanism and involvement of a residue in the M2 region of the α subunit. J Physiol 532:673–684. - PMC - PubMed
    1. Akk G, Li P, Bracamontes J, Steinbach JH. (2009) Activation and modulation of concatemeric GABA-A receptors expressed in human embryonic kidney cells. Mol Pharmacol 75:1400–1411. - PMC - PubMed
    1. Amin J, Weiss DS. (1993) GABAA receptor needs two homologous domains of the β-subunit for activation by GABA but not by pentobarbital. Nature 366:565–569. - PubMed
    1. Auerbach A. (2012) Thinking in cycles: MWC is a good model for acetylcholine receptor-channels. J Physiol 590:93–98. - PMC - PubMed
    1. Baumann SW, Baur R, Sigel E. (2002) Forced subunit assembly in α1β2γ2 GABAA receptors. Insight into the absolute arrangement. J Biol Chem 277:46020–46025. - PubMed

Publication types

MeSH terms

LinkOut - more resources