. 2018 Jan;176(1):596-610.
doi: 10.1104/pp.17.01497. Epub 2017 Nov 17.

A Program for Iron Economy during Deficiency Targets Specific Fe Proteins

Affiliations

A Program for Iron Economy during Deficiency Targets Specific Fe Proteins

Laura J Hantzis et al. Plant Physiol. 2018 Jan.

Abstract

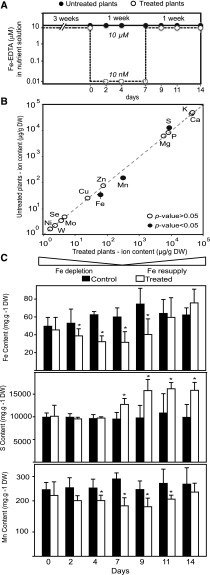
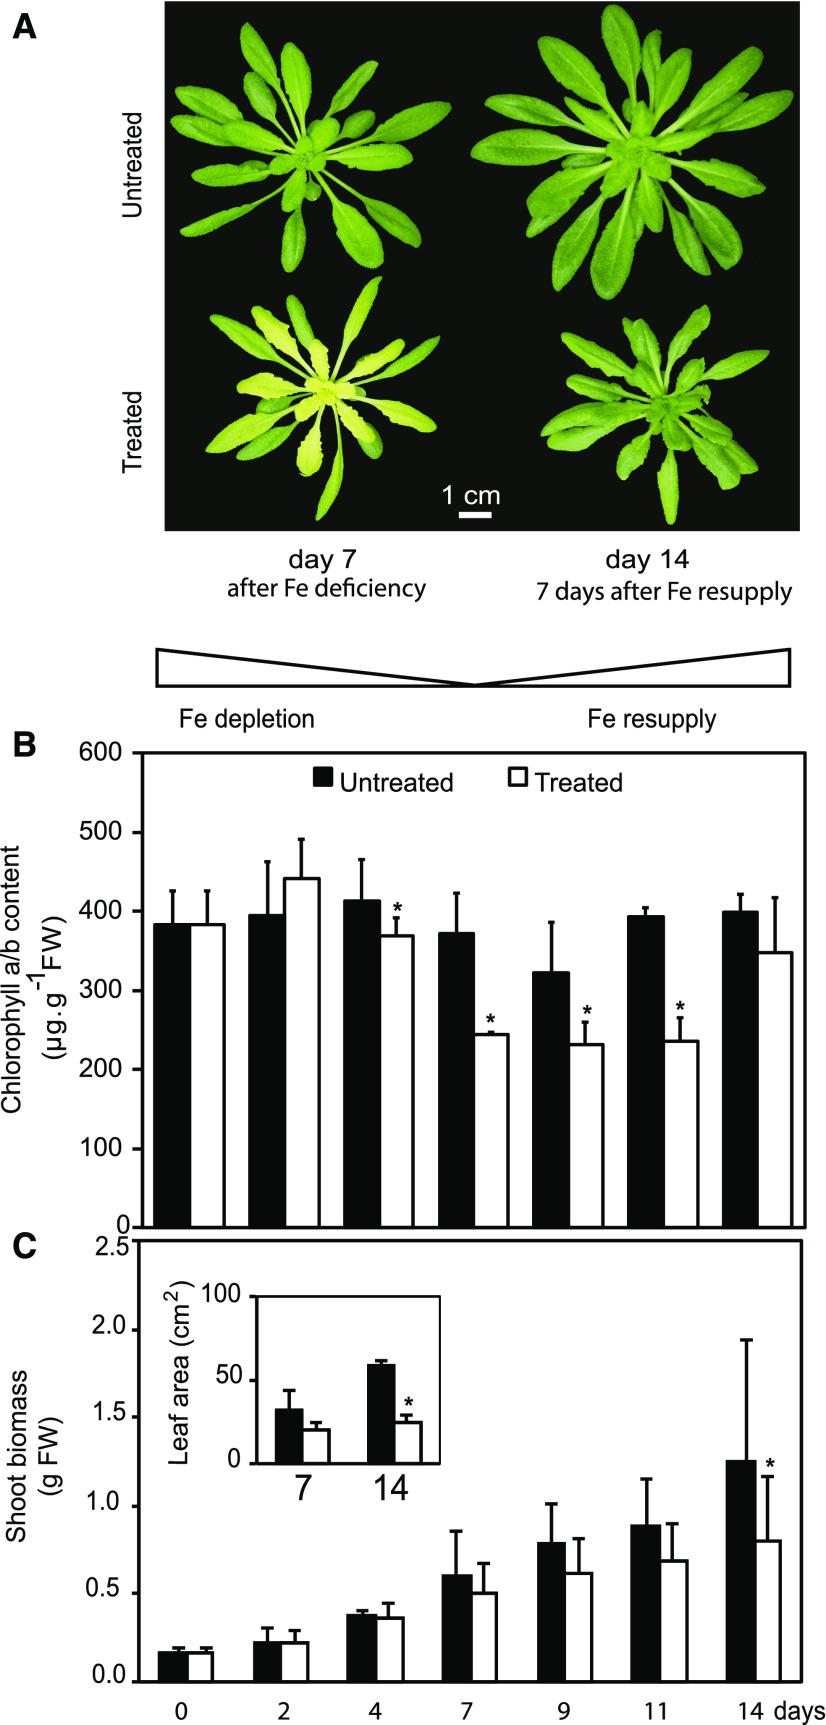
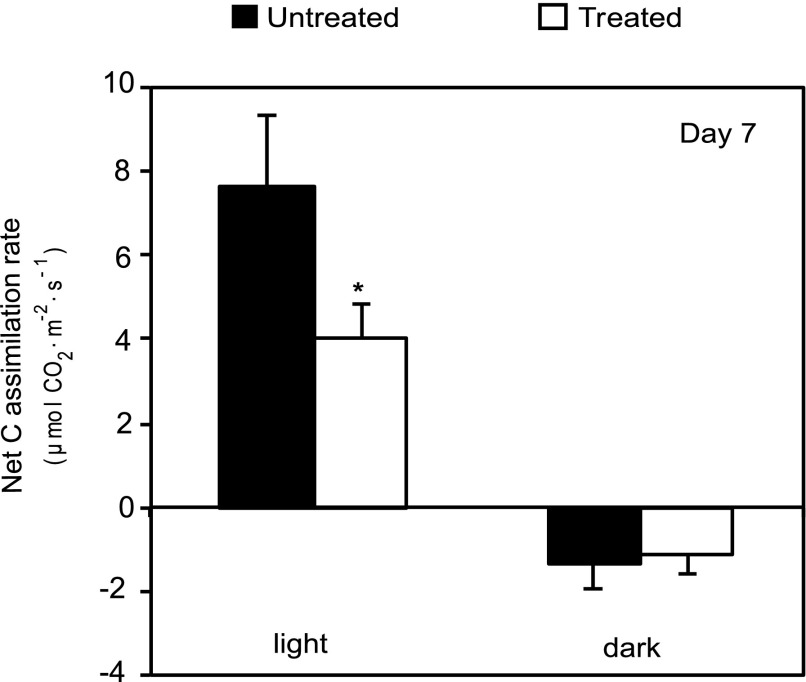
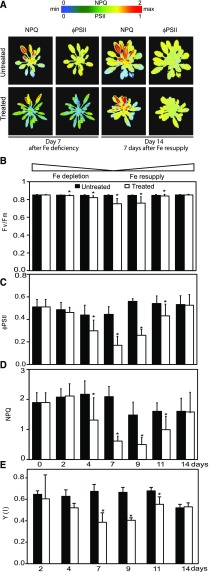
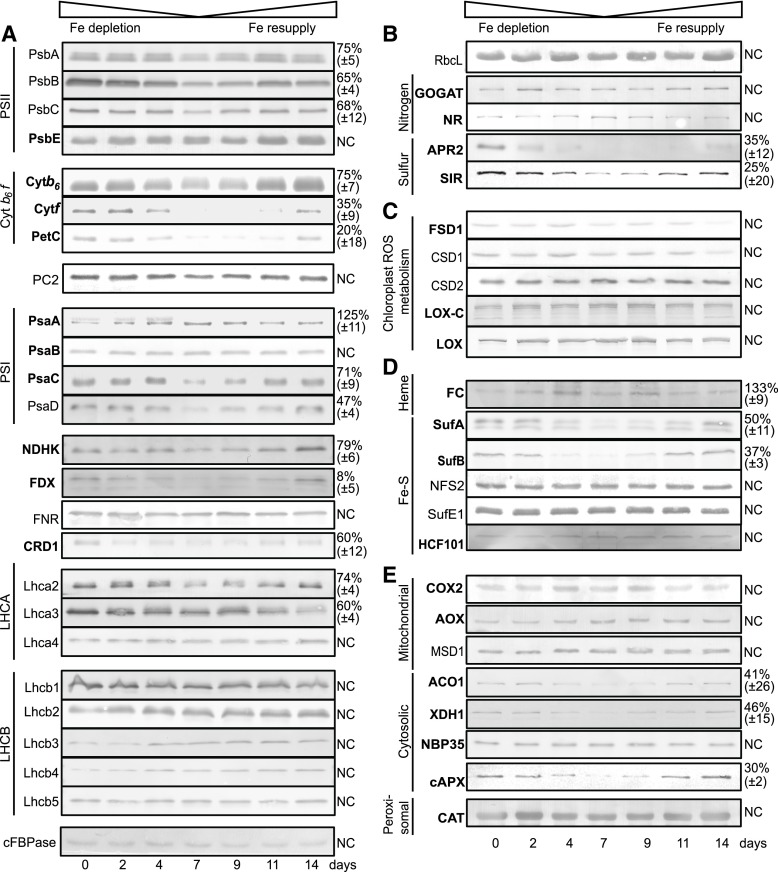
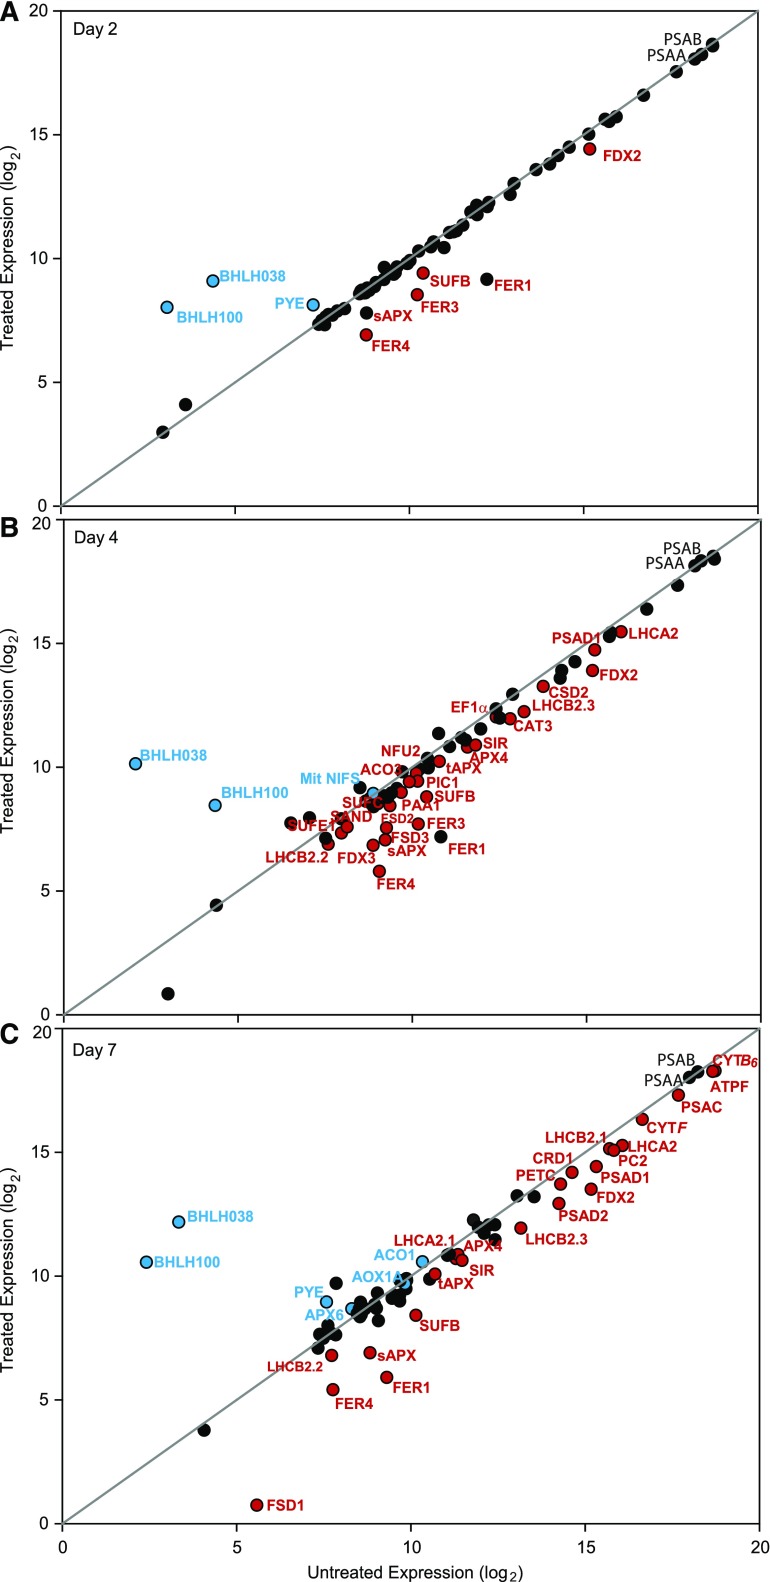
Iron (Fe) is an essential element for plants, utilized in nearly every cellular process. Because the adjustment of uptake under Fe limitation cannot satisfy all demands, plants need to acclimate their physiology and biochemistry, especially in their chloroplasts, which have a high demand for Fe. To investigate if a program exists for the utilization of Fe under deficiency, we analyzed how hydroponically grown Arabidopsis (Arabidopsis thaliana) adjusts its physiology and Fe protein composition in vegetative photosynthetic tissue during Fe deficiency. Fe deficiency first affected photosynthetic electron transport with concomitant reductions in carbon assimilation and biomass production when effects on respiration were not yet significant. Photosynthetic electron transport function and protein levels of Fe-dependent enzymes were fully recovered upon Fe resupply, indicating that the Fe depletion stress did not cause irreversible secondary damage. At the protein level, ferredoxin, the cytochrome-b6f complex, and Fe-containing enzymes of the plastid sulfur assimilation pathway were major targets of Fe deficiency, whereas other Fe-dependent functions were relatively less affected. In coordination, SufA and SufB, two proteins of the plastid Fe-sulfur cofactor assembly pathway, were also diminished early by Fe depletion. Iron depletion reduced mRNA levels for the majority of the affected proteins, indicating that loss of enzyme was not just due to lack of Fe cofactors. SufB and ferredoxin were early targets of transcript down-regulation. The data reveal a hierarchy for Fe utilization in photosynthetic tissue and indicate that a program is in place to acclimate to impending Fe deficiency.


Figures

Figure 1.
Figure 1.
Experimental set up and elemental composition of Arabidopsis rosettes over the experimental time course. A, Arabidopsis plants were grown hydroponically on 10 μm FeIIIEDTA for 3 weeks and then a subset of plants was transferred to 10 nM FeIIIEDTA. After 1 week, the deficient plants were resupplied with 10 μm FeIIIEDTA. Circles represent time points at which data were collected for untreated (black) and treated (white) plants. All analyses were completed before bolting to avoid compounding effects of nutrient reallocation during flowering and seed set. B, Ionome of untreated versus treated plants at day 7. The elemental composition was compared in treated and untreated plants at day 7 (n = 5–7). Concentration, as µg· x g−1 dry weight (DW), of a given element in untreated plants was plotted against its concentration in treated plants. Black circles represent elements that differ significantly (P value < 0.05) in treated plants compared to control. C, Changes in elemental content of Fe, S, and Mn in Arabidopsis rosettes with time. Control (black) and treated (white) plants are compared at each time point in the study with statistical significance denoted by an asterisk (indicating that that treated plants differed from untreated plants on a given time point, P value < 0.05; n = 5).
Figure 2.
Figure 2.
Symptoms of Fe-deficient Arabidopsis and impacts on chlorophyll content and growth. A, Appearance of untreated (top) and treated (bottom) Arabidopsis plants. Representative plants were photographed at day 7 (left) and day 14 (right). B, Total chlorophyll a/b content in Arabidopsis rosettes. Values are given as averages ± sd (n = 10). FW, Fresh weight. C, Shoot biomass of Arabidopsis during Fe deficiency and resupply. Growth of the shoot was monitored by measurement of rosette fresh weight. Values at the indicated days of treatment are given as averages ± sd (n = 15). Insert, total leaf area per plant for Fe-deficient plants (day 7) and Fe-resupplied (day 14) plants. Values are given as averages ± sd (n = 15). Black and white bars represent untreated and treated plants, respectively. Stars above bars represent significant differences (P value < 0.05) between untreated and treated plants for a given time point.
Figure 3.
Figure 3.
Fe deficiency strongly affects photosynthetic CO2 assimilation. Net C assimilation was determined in the light (350 µmol photons x m−2 x s−1) and in darkness at the end of the Fe deficiency treatment. Values are given as averages ± sd (n = 10). Black and white bars represent treated and control plants, respectively. Stars above bars represent significant differences (P value < 0.05) between untreated and treated plants for a given time point.
Figure 4.
Figure 4.
Fe deficiency decreases electron transport though the photosynthetic apparatus, primarily in the younger leaves. A, The NPQ and ΦPSII of Arabidopsis untreated (top) and treated plants (bottom). Representative false color chlorophyll fluorescence images are shown for day 7 (Fe deficient) and day 14 (Fe-resupplied) plants. B to D, Chlorophyll fluorescence parameters obtained using a FMS Hansatech system. B, Fv/Fm of dark-adapted plants. C, ΦPSII measured at 250 µmol photons m−2·s−1. D, NPQ measured at 600 µmol photons m−2·s−1. E, Quantum yield of photochemical energy conversion Y(I). Photooxidation/reduction of P700 was monitored as the light-induced absorbance change at 820 nm using a Dual-PAM-100 P700 fluorometer. All PSI parameters were measured over the time course of the treatment with the exception of day 0, because the intermediate leaves of the rosette at this time point were too small to fit in the Dual-PAM-100 leafclip used for the measurements. B to E, Values are given as averages ± sd (n = 6). Black and white bars represent untreated and treated plants, respectively. Stars above bars represent significant differences (P value < 0.05) between untreated and treated plants for a given time point.
Figure 5.
Figure 5.
Impact of Fe deficiency on the abundance of Fe proteins in the Arabidopsis rosette. Total protein extracts (20 µg) from treated Arabidopsis rosettes were fractionated by SDS-PAGE and blotted onto nitrocellulose membranes. The cytosolic Fru-1,6-bisphosphatase was used as a loading control. Immunoblots are presented for: A, proteins related to the photosynthetic light reactions; B, chloroplast metabolism; C, plastid ROS related proteins; D, plastid Fe cofactor assembly, and E, cytosolic, mitochondrial, and peroxisomal Fe related proteins. Protein name is denoted to the left of the immunoblot. Fe-binding proteins are in bold face. Shown are representative blots of at least four independent biological replicates. Immunoblots were quantified on day 7 comparing treated (low Fe) and untreated (control medium) plant samples. Numbers (right) represent the remaining amount of protein (as %) in Fe-deficient plants (treated plants, day7) relative to controls (untreated, day 7) for significantly (P value < 0.05) affected proteins. For proteins that did not show a significant change, NC for “no change” is written to the right of the blot.
Figure 6.
Figure 6.
Impact of Fe deficiency on the abundance of Fe-related transcripts in the Arabidopsis rosette. Total leaf RNA was analyzed for transcript abundance with NanoString Technology. Normalized mRNA expression for treated and control plants is compared using a log2 scale. UBIQUITIN11 and ACTIN2 were used for normalization. A, Day 2 after Fe deficiency (n = 4). B, Day 4 after Fe deficiency (n = 3). C, Day 7 after Fe deficiency (n = 4). Black circles represent unchanged transcripts, red circles represent significantly decreased transcripts, and blue circles represent significantly increased transcripts (P value < 0.05).

References

    1. Abdel-Ghany SE, Müller-Moulé P, Niyogi KK, Pilon M, Shikanai T (2005a) Two P-type ATPases are required for copper delivery in Arabidopsis thaliana chloroplasts. Plant Cell 17: 1233–1251 - PMC - PubMed
    1. Abdel-Ghany SE, Ye H, Garifullina GF, Zhang L, Pilon-Smits EA, Pilon M (2005b) Iron-sulfur cluster biogenesis in chloroplasts. Involvement of the scaffold protein CpIscA. Plant Physiol 138: 161–172 - PMC - PubMed
    1. Andaluz S, López-Millán A-F, De las Rivas J, Aro EM, Abadía J, Abadía A (2006) Proteomic profiles of thylakoid membranes and changes in response to iron deficiency. Photosynth Res 89: 141–155 - PubMed
    1. Balk J, Pilon M (2011) Ancient and essential: the assembly of iron-sulfur clusters in plants. Trends Plant Sci 16: 218–226 - PubMed
    1. Balk J, Schaedler TA (2014) Iron cofactor assembly in plants. Annu Rev Plant Biol 65: 125–153 - PubMed

Publication types

MeSH terms

LinkOut - more resources