. 2017 Nov 17;8(1):1595.
doi: 10.1038/s41467-017-01718-7.

Mapping tenascin-C interaction with toll-like receptor 4 reveals a new subset of endogenous inflammatory triggers

Affiliations

Mapping tenascin-C interaction with toll-like receptor 4 reveals a new subset of endogenous inflammatory triggers

Lorena Zuliani-Alvarez et al. Nat Commun. .

Abstract

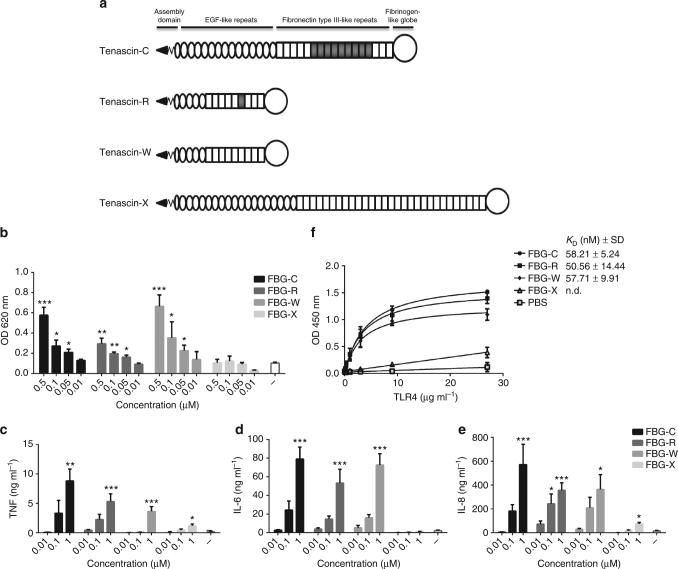
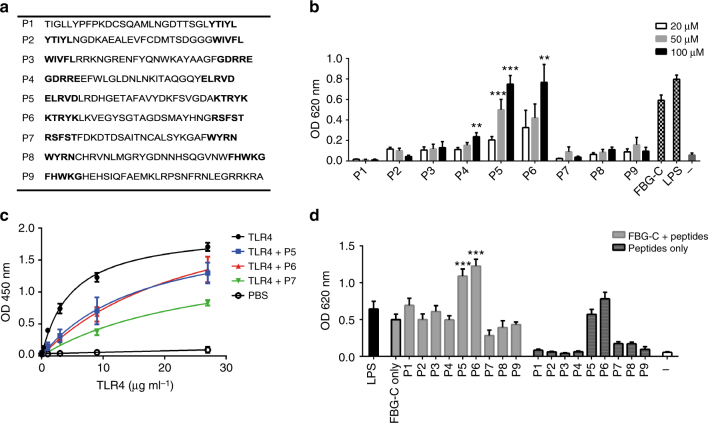
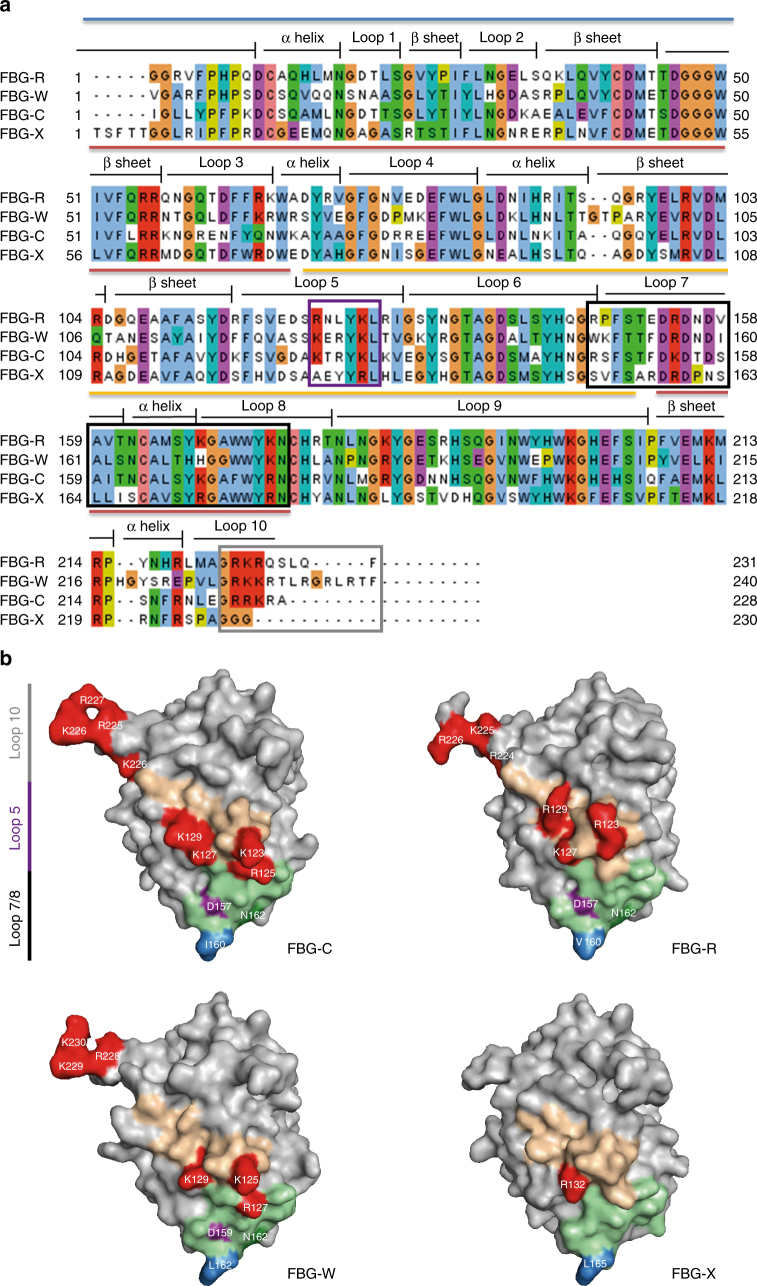
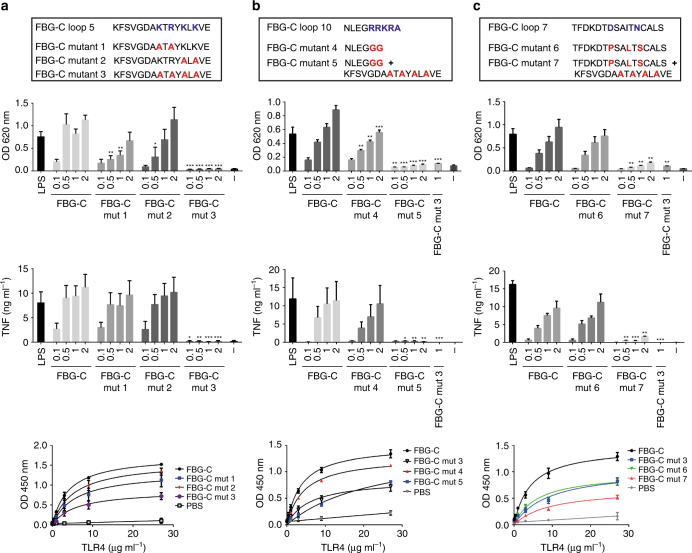
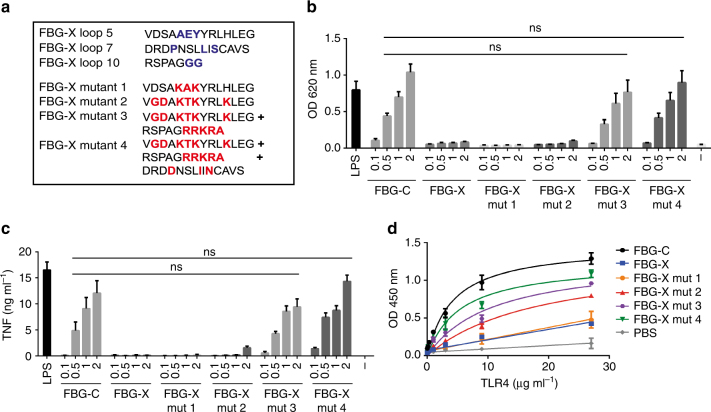
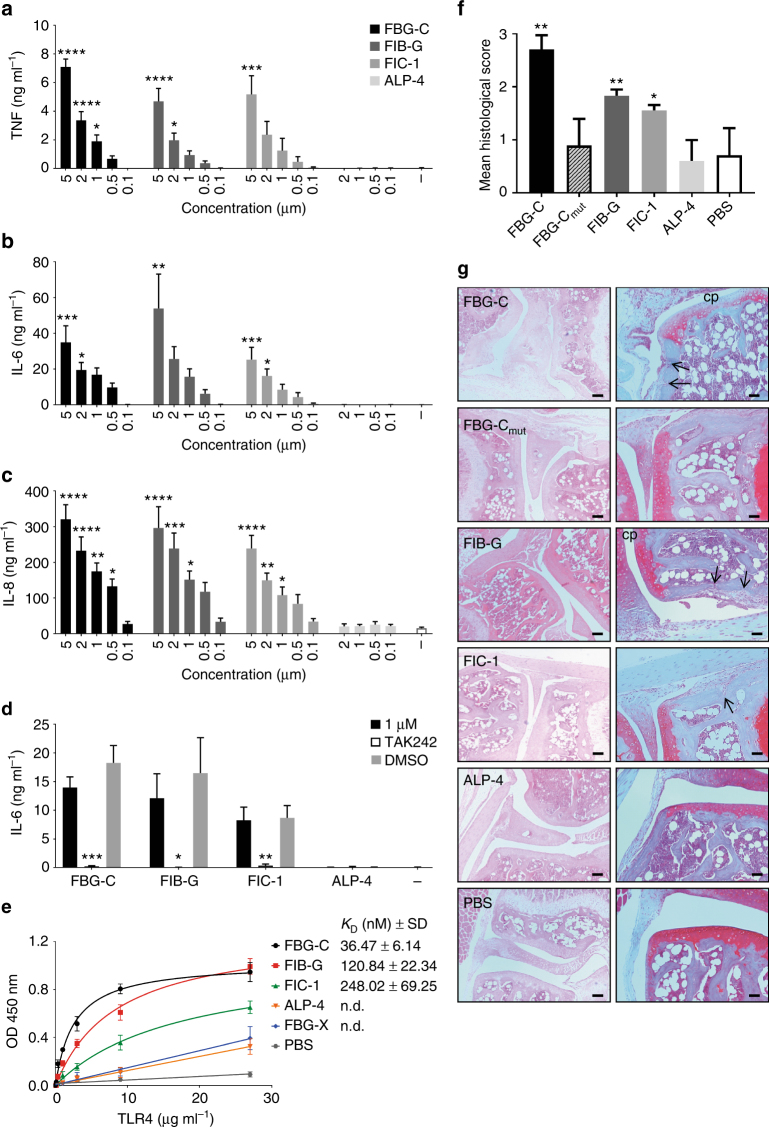
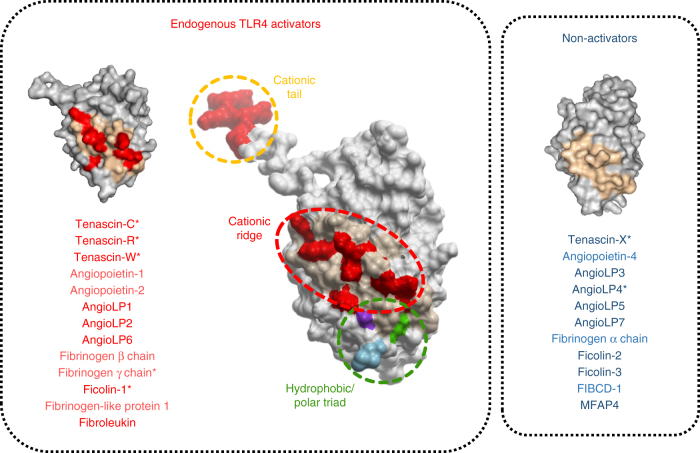
Pattern recognition underpins innate immunity; the accurate identification of danger, including infection, injury, or tumor, is key to an appropriately targeted immune response. Pathogen detection is increasingly well defined mechanistically, but the discrimination of endogenous inflammatory triggers remains unclear. Tenascin-C, a matrix protein induced upon tissue damage and expressed by tumors, activates toll-like receptor 4 (TLR4)-mediated sterile inflammation. Here we map three sites within tenascin-C that directly and cooperatively interact with TLR4. We also identify a conserved inflammatory epitope in related proteins from diverse families, and demonstrate that its presence targets molecules for TLR detection, while its absence enables escape of innate immune surveillance. These data reveal a unique molecular code that defines endogenous proteins as inflammatory stimuli by marking them for recognition by TLRs.


Conflict of interest statement

K.S.M. is the founder of, and consultant to, Nascient Ltd. The remaining authors declare no competing financial interests.

Figures

Fig. 1
Fig. 1
The FBG domains of tenascin-C, -R, and -W can induce NF-kB activation and cytokine synthesis, and bind to TLR4. a Tenascin-C, -R, -W, and -X each contain an assembly domain, a variable number of epidermal growth factor (EGF)-like repeats, a variable number of fibronectin type III-like repeats (these can be constitutively expressed (white rectangles) or alternatively spliced (gray rectangles) and a C-terminal fibrinogen-like globe (FBG) domain. The FBG domains exhibit a similar molecular weight, comprising between 229 and 240 amino acids each (FBG-C: 26.1 kDa, amino acids 1974–2201, FBG-R: 27.0 kDa, amino acids 1128–1359, FBG-W: 27.5 kDa, amino acids 1060–1300, FBG-X: 26.1 kDa, amino acids 4013–4243); protein accession numbers: tenascin-C (P24821), tenascin-R (Q92752), tenascin-W (Q9UQP3), tenascin-X (P22105). b THP1 NF-kB cells were stimulated with different concentrations of FBG-C, -R, -W, and -X, or were left unstimulated (−) for 24 h and NF-kB activation measured using QUANTI-Blue. Data are shown as mean ± SEM from three independent experiments. One-way ANOVA vs. non-stimulated, **p < 0.01, ***p < 0.001. ce Primary human macrophages were stimulated with different concentrations of FBG-C,-R, -W, and -X, or were left unstimulated (−) for 24 h, and TNF (c), IL-6 (d), and IL-8 (e) levels measured by ELISA. Data are shown as mean ± SEM from three independent donors. One-way ANOVA vs. non-stimulated, *p < 0.05, **p < 0.01, ***p < 0.001. f 96-well plates were coated with 1 µg ml−1 of FBG-C, -R, -W, or -X, or PBS, and incubated with increasing doses of TLR4. Curves were fitted in GraphPad Prism using one-binding site hyperbola equation. Data in the graph are shown as mean ± SEM from four independent experiments
Fig. 2
Fig. 2
Peptide mapping reveals specific regions in FBG-C involved in TLR4 activation and binding. a Nine peptides of ~30 amino acids long from FBG-C were synthesized; overlapping amino acid sequences are shown in bold. b THP1 NF-kB cells were stimulated with LPS (0.5 ng ml−1), FBG-C (0.5 µM), or 20, 50, or 100 µM of peptides 1–9 for 24 h and NF-kB activation was measured using QUANTI-Blue™. Data shown as mean ± SEM, n = 4 independent experiments. One-way ANOVA vs. unstimulated cells. **p < 0.01, ***p < 0.001. c Increasing doses of TLR4 were pre-incubated with 200 µM of peptides before adding them to 96-well plates coated with 1 µg ml−1 of FBG-C. Curves were fitted in GraphPad Prism using one-binding site hyperbola equation. Data are shown as mean ± SEM, n = 3. d THP1 NF-kB cells were left unstimulated (−) or pre-incubated with 100 µM peptides prior to stimulation with 0.5 µM of FBG-C for 24 h. NF-kB activation was measured using QUANTI-Blue™. Data shown as mean ± SEM, n = 3 independent experiments. Paired t-test vs. FBG-C only, *p < 0.05, **p < 0.01, ***p < 0.001
Fig. 3
Fig. 3
Sequence alignment and homology models of the tenascin family FBG domains. a Multiple alignment analysis of the FBG domain of tenascin family members highlighting the secondary structure of the predicted protein models. Blue line indicates the A-subdomain, red line indicates the B-subdomain, and yellow line indicates the P-subdomain. The alignment was colored according to the Clustal color scheme. Light blue: hydrophobic, red: positive charged, green: polar, pink: conserved column of cysteine, violet: negative charged, orange: glycine, yellow: proline, cyan: aromatics. The overlapping sequence of peptides 5 and 6, the sequence of peptide 7, and the C terminus are indicated with purple, black, and gray boxes, respectively. b Homology models of the FBG domain of tenascin-C, -R, -W, and -X highlighting the amino acid composition in loop 5, loop 7, and loop 10. The sequence of loop 5 is depicted in pale orange, within which positively charged residues are colored red, any positive residues in the C-terminal loop 10 are also colored red. The sequence of loop 7 is colored pale green within which the triad of polar and hydrophobic residues conserved in FBG-C, -R, and -W but absent in FBG-X, are colored purple, dark green, and blue
Fig. 4
Fig. 4
Pinpointing amino acids in loops 5, 7, and 10 of FBG-C that mediate TLR4 binding and activation. Upper panel: Sequences of wild-type FBG-C and mutants 1–7, highlighting wild-type amino acids in blue and mutations in red (loop 5 variants are shown in a, loop 10 in b, and loop 7 in c). Second panel: THP1 NF-kB cells were left unstimulated (−) or stimulated for 24 h with LPS (1 ng ml−1), increasing doses (μM) of FBG-C or FBG-C mutants 1–7. NF-kB activation was measured using QUANTI-Blue™. Data shown as mean ± SEM. n = 4 independent experiments. Paired t-test vs. FBG-C, *p < 0.05, **p < 0.01, ***p < 0.001. Third panel: Primary human macrophages were left unstimulated (−) or stimulated for 24 h with LPS (1 ng ml−1), increasing doses (μM) of FBG-C or FBG-C mutants 1–7. Cytokines synthesis was measured by ELISA. Data shown as mean ± SEM. n = 4 independent donors. Paired t-test vs. FBG-C, *p < 0.05, **p < 0.01, ***p < 0.001. Bottom panel: 96-well plates were coated with 1 µg ml−1 of FBG-C or FBG-C mutants 1–7, and TLR4 was added in a dose-dependent manner. Curves were fitted in GraphPad Prism using one-binding site hyperbola equation. Data shown as mean ± SEM; n = 4
Fig. 5
Fig. 5
Mutations in FBG-X confer TLR4-activating ability. a FBG-X chimeric proteins were designed to introduce the amino acids found in FBG-C to activate and bind to TLR4 (red) into the FBG-X sequence (blue). b ThP1 NF-kB cells were left unstimulated (−) or stimulated for 24 h with 0.5 ng ml−1 of LPS or increasing doses (μM) of FBG-C, FBG-X, FBG-X mutant 1, 2, 3, and 4. NF-kB activation was measured using QUANTI-Blue™. Data shown as mean ± SEM. n = 3 independent experiments. One-way ANOVA vs. FBG-C. c Primary human macrophages were left unstimulated (−) or stimulated for 24 h with 1 ng ml−1 of LPS or increasing doses (μM) of FBG-C, FBG-X, FBG-X mutant 1, 2, 3, and 4. Cytokine synthesis was measured by ELISA. Data shown as mean + SEM. n = 3 independent donors. One-way ANOVA vs. FBG-C. d 96-well plates were coated with 1 µg ml−1 of FBG-C, FBG-X, FBG-X mutant 1, 2, 3, and 4, and TLR4 was added in a dose-dependent manner. Data shown as mean ± SEM. n = 4 independent experiments
Fig. 6
Fig. 6
A conserved cationic ridge in fibrinogen-related proteins (FRePs). a Simplified domain organization of human FRePs: each protein contains distinct N-terminal sequences but all possess a C-terminal FBG domain, including the four tenascin family members (shown in Fig. 1a), α, β, and γ chains of fibrinogen, the three angiopoietins, seven of the angiopoietin-like proteins (Angio-LPs), the three ficolins, fibroleukin, FIBCD-1, FGL1, and MFAP4. b The cationic loop 5 ridge present in FBG-C, -R, and -W, but absent in FBG-X, is conserved in a subset of FRePs, which possess a comparable structural epitope made up of residues from loops 5, 6, and 7. Homology models of the FBG domains of the three FRePs selected for further analysis are shown together with that of tenascin-C (FBG-C); these include two predicted TLR4 agonists; the fibrinogen γ chain (FIB-G) and ficolin-1 (FIC-1), and one FBG domain predicted to be incapable of activating TLR4; angiopoietin-like protein 4 (ALP-4). The region created by residues from loops 5, 6, and 7 on the surface of each FBG domain is shown in pale orange, within which positively charged residues are colored red
Fig. 7
Fig. 7
The FBG domains of FIB-G and FIC-1 exhibit pro-inflammatory effects in vitro and in vivo. ac Primary human macrophages were stimulated with different concentrations of FBG-C, FIB-G, FIC-1, and ALP-4, or were left unstimulated (−) for 24 h. Cytokine levels were measured by ELISA. Data shown as mean ± SEM from at least three independent donors. One-way ANOVA vs. non-stimulated, *p < 0.05, **p < 0.01, ***p < 0.001, ****p < 0.0001. d Primary human macrophages were pre-incubated for 6 h with 3 µM TAK 242 prior to stimulation with FBG-C, FIB-G, FIC-1, and ALP-4 (1 µM), or no stimulation (−) for 24 h. Cytokine synthesis was measured by ELISA. Data shown as mean ± SEM from at least three independent donors. Paired t-test vs. non-treated, *p < 0.05, **p < 0.01, ***p < 0.001. e 96-well plates were coated with 1 µg ml−1 of FBG-C, FBG-X, FIB-G, FIC-1, and ALP-4, or PBS, and incubated with increasing doses of TLR4. Curves were fitted in GraphPad Prism using one-binding site hyperbola equation. Data are shown as mean ± SEM from three independent experiments. f, g Synovial inflammation was assessed 3 days post injection of each protein (1 µg) or PBS alone into the knees of DBA-1 mice. The histological score was calculated as the mean of seven sections from each knee joint per mouse. n = 5 mice per group except for FIC-1 (n = 4) (f). Mann–Whitney non-parametric test vs. PBS, *p < 0.05, **p < 0.01. Images show representative sections stained by haematoxylin and eosin (left panels) or safranin-O (right panels) (g). Mice injected with FBG-C, FIB-G, and FIC-1 exhibit cell infiltration into a thickened synovial lining layer, cellular invasion into the subchondral bone (arrows indicate bone erosion) and loss of articular cartilage proteoglycan (cp), pathological features not observed in mice injected with FBG-C mut or ALP-4.Scale bar left panels: 100 μM, right panels: 50 μM
Fig. 8
Fig. 8
A common danger domain revealed. Three distinct sites within the FBG domain of tenascin-C contribute to TLR4 activation (center panel); a cationic ridge made up of residues from loops 5–7 (pale orange with positive residues highlighted red), underneath which sits a triad of hydrophobic/polar residues from loop 7 (green, purple, and blue), plus a C-terminal cationic tail in loop 10 (positive residues highlighted red). The cationic ridge is the dominant inflammatory epitope; its deletion renders inflammatory stimuli inert and its ectopic expression can convert immunologically inactive proteins into TLR4 agonists. In addition to tenascin-C, in other proteins that contain FBG domains, possession of this inflammatory epitope also confers TLR4-activating capabilities, irrespective of protein family (*denotes validated domains). Together, these data reveal a common mechanism by which distinct inflammatory triggers, spanning a wide range of tissue locations, induced in response to a spectrum of different threats, can activate TLR4 to raise an immune response

References

    1. Bryant CE, et al. Advances in Toll-like receptor biology: modes of activation by diverse stimuli. Crit. Rev. Biochem. Mol. Biol. 2015;50:359–379. doi: 10.3109/10409238.2015.1033511. - DOI - PubMed
    1. Song W, et al. Structural basis for specific recognition of single-stranded RNA by Toll-like receptor 13. Nat. Struct. Mol. Biol. 2015;22:782–787. doi: 10.1038/nsmb.3080. - DOI - PubMed
    1. Ohto U, et al. Structural basis of CpG and inhibitory DNA recognition by Toll-like receptor 9. Nature. 2015;520:702–705. doi: 10.1038/nature14138. - DOI - PubMed
    1. Hu Z, et al. Structural and biochemical basis for induced self-propagation of NLRC4. Science. 2015;350:399–404. doi: 10.1126/science.aac5489. - DOI - PubMed
    1. Zhang L, et al. Cryo-EM structure of the activated NAIP2-NLRC4 inflammasome reveals nucleated polymerization. Science. 2015;350:404–409. doi: 10.1126/science.aac5789. - DOI - PMC - PubMed

Publication types

MeSH terms